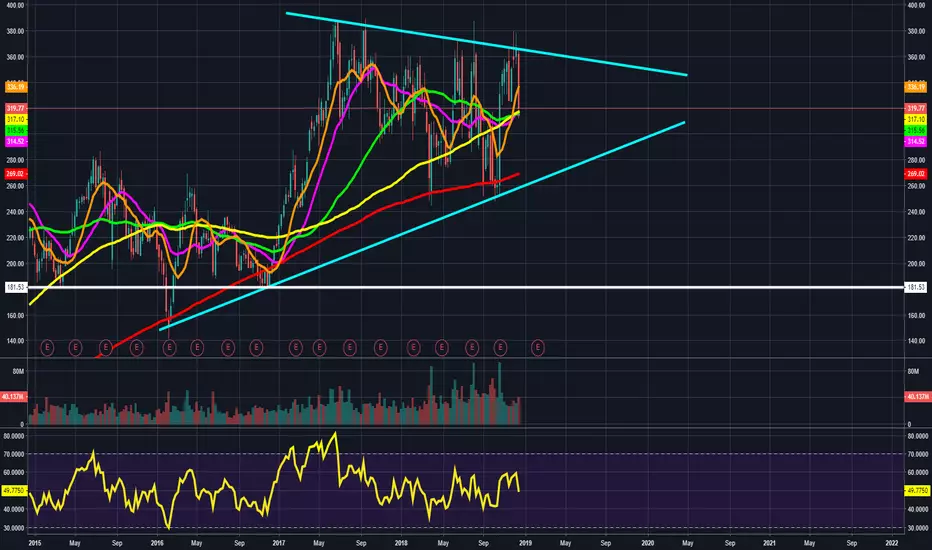
symmetrical bullpennant breakout confirmed/higher high on 4hr We wanted to see the price action rise above this horizontal purple line to achieve a higher high on the 4hr chart and with the current 4hr breakout candle we have seen just that. A great sign for the bulls. However to securely reach a higher high on the chart that really matters(the 1 day chart). We're gonna need to get price action above this pink horizontal line just above that. The breakout target of this bullflag should have us reaching that higher high no problem plus we still have the price target to reach from the green falling wedge which is slightly above that too...that helps increase the odds even though falling wedge breakouts often don't reach their full breakout targets. There's also the large tan symmetrical triangle we have been above for quite some time now odds are good we will trigger its breakout and reach its breakout target. Only thing that could stop us from getting above that pink higher high on the 1 day chart horizontal line is the fact that we haven't had a higher high on the 1 day chart since the very beginning of the bear market and they always say the trend is your friend until the end. That's also why if we do trigger a breakout here above that higher high the trend may indeed finally be starting to reverse...we will of course want to see it followed up with a higher daily low and then one more consecutive daily higher high to be certain the trend is changing....or even a capitulation plummet right after this higher high and after that follow it up with a higher high/higher low/higher high sequence on the daily chart....either way to me it feels like the end of the bear market is truly near.
Bullish Pennant

USD/JPY - Possible BULLISH Pennant formation breakout for 111USD bulls are preparing to break out of 110 by forming a bullish pennant.
Waiting for price action to break out of the pennant and bounce off resistances as shown on the chart.
Target is near R5 and around 110.9.
If this chart helped at all, leave a like or follow.
I would love any feedback/advice about my chart to correct any of my mistakes and learn more about TA.
DISCLAIMER: Not a financial advisor, I don't suggest using my ideas for your own as I am a complete amateur for TA.
Good luck to everyone!

BTC/USDT Time of truth 4000$ if it breaks up the bull pennant 4hIt BTC breaks up this BULL pennant, probably we will it in 4000$
Volume is enough or otherwise, we will see a new lower bottom if it is broken down... What do you think?
Don´t forget hit the like. ;)
Regards

Bullish move expected on AMDAfter a bullish run AMD has been trading sideways in the last 4/5 days. I'd trade a bullish breakout from this level.

4hr deathcross nears…can 2 bull patterns be enough to reverse itWe currently have 2 4hr chart bull patterns forming a little falling wedge bull pennant pattern(in yellow) and a potential small 4hr inverted head and shoulders pattern....a breakup at the right point from the falling wedge pennant could give the bulls enough breakup momentum to get above the neckline of the 4hr inverted head and shoulders and even potentially trigger it...if this were to occur we could see a brief trip back up to the 3950 range. However even if this were to occur I don't think the momentum will be big enough to prevent the 4hr death cross or even flip it quickly back to a golden cross...so while both these patterns may very possibly break bullishly I think the end result is still going to be a sustained 4hr death cross and a bearish drop in price action to go with it. If they don't break bullish and it just continues to break down from here then I think we may see a double bottom bounce at the 1 week chart's 200ma around 3260 or so...if we do break upwards and hit the inv h&s target of 3950 or so there may be enough fomo generated at that point to get above the neckline of the much bigger inverted head and shoulders pattern around 4k at this point...I could potentially see this setting a huge bull trap at this point and if we did inch above the neckline I think there would be such a spike in longs that it would set the perfect bull trap for a big capitulation candle inv h&s fakeout crash from there...one that could drop to 2.8-2.9k or possibly even lower. Of course I always gotta also factor in the slim possibility however that it could actually legitimately trigger that bigger inverted head and shoulders pattern as well and take us to over 5k but that seems very improbable at this point especially with the 4hr deathcross on track to happen in the enxt 8 hours or so. Of course with crypto nothing is impossible so I can't discount the possibility entirety. Thanks for reading and understanding this is not financial advice!

bitcoin bullflag looking more like a symmetrical pennant now The breakout targets are still roughly pretty close to eachother even though price action on the flag is now looking more like a symmetrical pennant. I anticipate a break upward from the pennant no later than tomorrow but possibly tonight. That will put us above the neckline of the inverted head and shoulder pattern...I'm still not completely confident we will trigger the inverted head and shoulder breakout but plan on having a smart stop loss should a fakeout occur.

TRX big buy opportunity! All indicators are bullish . If on the chart is bullish penant, potential target can be around 700 sats . I´m in TRX with light leverage. If it will go down, I´ll buy more. Conservative traders should BUY TRX after breakout and place stoploss under support trendline . BUT be carefull with fake breakdowns!

GBPUSD Long After Short Fakeout on H1So dusting off the old charts here.
My Script is for entry predictions.
After the H1 candles called a short twice i went down to the M30 which put in a shooting star . So i took my loses and went long 2 micros. This is the first time I've traded since early to mid summer.
Went down to the M15 and got a buy signal.
Went down to the M5 for closer monitoring. See flag forming.
Confirm Bullish Pennant . Measure mask whip out the fibs. Notice Retracement to below bottom of where i considered above the pennant with lowest possible entry. Stack one micro.
Should be a nice ride. Trendline broken and all.
GBPUSD Long After Short Fakeout on H1

Bull Flag and Bullish PennantFlags and pennants are continuation patterns. They are traded in the same way, but each has a slightly different shape. The terms flag and pennant are often used interchangeably.
A flag or pennant pattern forms when the price rallies sharply, then moves sideways or slightly to the downside. This sideways movement typically takes the form or a rectangle (flag) or a small triangle ( pennant ), hence their names. Draw trendlines along the highs and lows of the sideways price action. The sharp price rise preceding the flag or pennant is called the flag pole.
The sideways period is often followed by another sharp rise. This is where the trading opportunity comes in. Once the flag pole and a flag or pennant have formed, traders watch for the price to breakout above the upper flag/pennant trendline . When this occurs, enter a long trade.
Target 1: Size of the Flag
The first target of a confirmed Flag pattern can be derived using the measured move technique. The measured move target is a distance equal to the size of the flag. To measure the size of the flag, you would just take the vertical distance between the upper and the lower channel within the flag.
Then you would apply this distance starting from the breakout point. Your first target is located at the end of this distance.
Target 2: Size of the Pole
The next target of the Flag formation equals the size of the Flag Pole. So, to get this target 2, you need to measure the vertical distance between the high and the low of the Pole. Once you get that distance, you will need to apply it to the pattern. Again, as we did with Target 1, you would apply it starting from the breakout point.
Even though flags and pennants are common formations, identification guidelines should not be taken lightly. It is important that flags and pennants are preceded by a sharp advance or decline. Without a sharp move, the reliability of the formation becomes questionable and trading could carry added risk. Look for volume confirmation on the initial move, consolidation, and resumption to augment the robustness of pattern identification.

SPY LongAnother update to a post from earlier -
Another way of looking at the same thing.
A Bull Flag is painting on the 15-30 Min Charts
We will see how this plays out, however, we are long at this time.

TSLA within a bullish price structure in a bearish market. TSLA seems to be one of the few stocks that is within a bullish price action structure while the rest of the market is getting smashed. This to me looks like a bullish pennant, and if TSLA can continue to hold the rising line of support and its 200 weekly MA, it could be set up to succeed as the rest of the market falls off. We can see TSLA got rejected once more off of the top of the pennant structure, and is currently holding right above a cluster of its weekly moving averages. I think there is a good possibility this will retest the bottom of the pennant structure again around 260-270, and if it can hold that rising line of support and the 200 weekly MA again, that would be incredibly bullish in my opinion.
What to watch for:
-Retest of the rising line of support and the 200 weekly MA around 260-270. If it holds again and starts to move back up, price could be setup to retest the top of the pennant structure, if not just outright break out to the upside.
-If that rising line of support/200 weekly MA does not hold again, we could see a break-down out of the pennant, and we could TSLA drop down to the $100-200 range, if not lower.
-This is not financial advice. Always do your own research and own due-diligence before investing and trading, as for investing and trading comes with high amounts of risk.
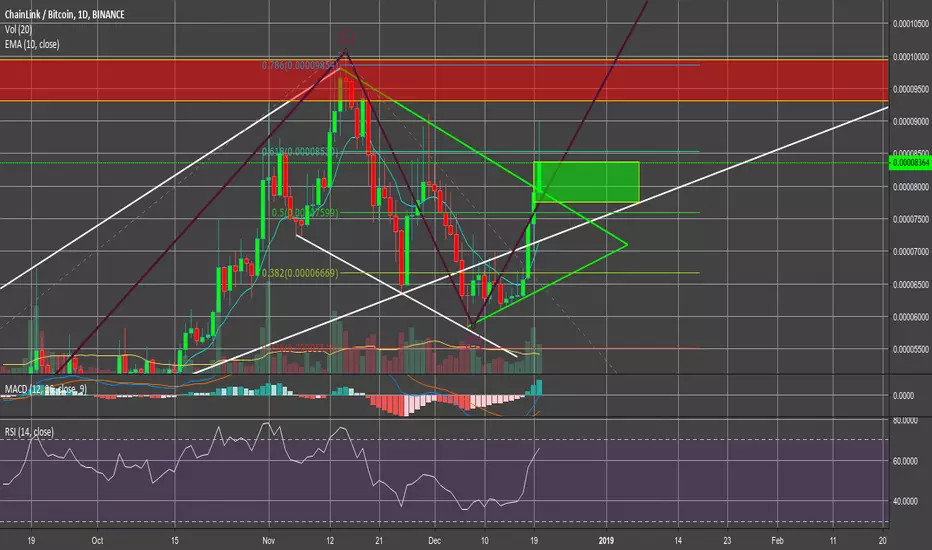
MAGNIFICENT! UNSTOPPABLE... CHAINLINK!!BINANCE:LINKBTC is making crazy moves upwards, unlike many alts which have just moving a few percentage points to BITFINEX:BTCUSD during the recent surge. I believe the BINANCE:LINKBTC price will definitely continue to follow BITFINEX:BTCUSD and the overall market cap, however if you take a look at this chart...
Clearly, LINK broke out from a bullish penant yesterday vs. BTC and made an incredible move of 33% gains in a day! As I write this, there is a pullback going on. However, this wave count on this chart is very valid, as the C wave cannot be the shortest, and each wave has 5 clear sub-regions within it where C is not the shortest. I tried a few, but this is the only one that could fit this technicality. Furthermore, the A wave territory acted as strong support for the D wave. This is one of the best coins there is in terms of fundamentals and I highly recommend DYOR on it if you haven't already.I'm in this trade for the long term so I'll be looking at the higher targets above the 1:1 extension, but shorter term traders may wish to take profits sooner, and thus use a tighter stop loss for increased risk:reward ratio. Overall this setup is very nice and all the indicators are pointing up at least for the short term, but in the past it has had difficulty going above 10k sats which seems to be the big joke for the bears who keep pushing it down at that psychological level as they know it's where the hype builds up.
Entry: 0.0007750-0.0008350
Target 1: 0.0009297- 0.0009970
Target 2: 0.001155
Target 3: 0.001637
Target 4: 0.002430
Stop loss:0.0006669 or 0.0007601 if you only want a short term trade. This lower stop is to take into account a possible bear trap region like we have already seen below the white trend line, which allowed us to form the pennant.
(click and drag the right side of the chart to zoom and move the chart to see higher targets)
Please leave a like and consider following for more live crypto analysis. More open trade charts linked below. :)
Huge pump or what? What's going on with BITCOIN (BTC)So, it looks like the big pump we had that was caused by a short squeeze and strong resistance levels is seeing some resistance here.
Many traders are calling for levels as high as 4500, 5100, and even 6k. It appeared to me before that we had a bull flag with a big bear trap, but then this even bigger BULL trap came along and I'm left not knowing what to think. If you are wondering what my overall view is on Bitcoin, you can read my previous analysis. But the main point to consider is that no matter how fast we can retrace in this move up, if we are below 6k then the overall trend is bearish because there will be no higher high. The other fundamental factor that could halt this run is how strong alts are looking, so more money may be going directly into them, rather than into Bitcoin. Especially considering how increasingly easy it is to buy alts directly from fiat with all these new coins being added to coinbase and the recent introduction of USDC on Binance.
I have two main scenarios here: Bullish or bearish:
The bullish scenario is we are in fact painting a bigger bullish pennant with that "bull trap" region and this was part of the plan all along.
The bearish scenario is we make a bigger ABC correction down after the move up, and the higher targets will no longer be in play.
Hope you enjoyed this quick analysis! Please consider following/ leaving a like and happy Christmas!
-Etch
Previous analysis:

xrp bull pennant1000 shares long .53947 cost $540.65 with fee
this has not confirmed its breakout just scaling into the position
for confirmation im looking for a volume spike as well as a close above the trend line
because of this still small in size and only risking less than $20
its very tight here so wanted to start building a position because I know these things can move quicker than you can click a mouse and I do not like chasing
Im in a short on eth and although xrp and eth aren't directly correlated, the market usually moves in unison especially lately with a few coins going against the trend from time to time
so dont like going long on one and short on the other

Bitcoin Cash | Potential Bullpennant Breakout Coming Up [BCHUSD]Bitcoin Cash is forming a bullpennant on the lower timeframes and looks like it's getting ready for a breakout.
If prior resistance around the red box breaks ( ~0.09 Sats, $600 USD), I wouldn't be surprised to see continuation of the little bull run up to $1000, leading up to the hardfork on November 15.
This move would be supported by the double bottom and fueled by FOMO.
Prior to the hardfork, I'd say get the hell out because the RSI on the Daily is already starting to get overbought.


Bullish Pennat spotted! All sail ahead!Gold had make a strong upward movement last 2 weeks, giving us the flag pole. however, the pattern is not a flag pattern but a bullish pennant! It is currently testing the new support line (previous resistance line). If the support holds, going LONG is a good idea.
This Idea is solely my personal opinion and it is not a entry signal. Trading leveraged assets also are very risky!

New beginners view of BULLISH pennant forming on XAUUSDMy updated view on XAUUSD until US GDP this friday.
My personal entry point is on the stop hunt that I've indicated on the chart, I will be looking at indicators and volume to confirm my long during the time frame of the grey stop hunt box I've placed.
If this chart helped at all, leave a like.
I would love any feedback/advice about my chart to correct any of my mistakes and learn more about TA.
DISCLAIMER: Not a financial advisor, I don't suggest using my ideas for your own as I am a complete amateur for TA.
Good luck to everyone!

Potential BULLISH PENNANT formation on XAUUSD I am still very bullish on gold since USD was really strong last week and gold was barely affected. DXY also seems to be doing a double top soon on the H1-H4 time frame which could fuel a stronger bullish momentum for gold this week.
My personal entry point is on the stop hunt that I've shown on the chart.
If this chart helped at all, leave a like.
I would love any feedback/advice about my chart to correct any of my mistakes and learn more about TA.
DISCLAIMER: Not a financial advisor, I don't suggest using my ideas for your own as I am a complete amateur for TA.
Good luck to everyone!

AION/BTC Bull Pennant! [35% profit potential]- Big bull pennant
- RSI knocking on the door already
- ATH on volume

Bullish Pennant on XAU/USD @ H4A bullish pennant has formed on XAU/USD @ H4 and offers an upside breakout trading opportunity. The pennant and its pole are marked with the yellow lines. My potential entry level is marked with the cyan line. My potential take-profit level is marked with the green line. I will set the stop-loss to the low of the breakout candle (not shown).

Golden Bull?Gold is formed a bullish pennant that might get broken during the coming up FED Powell Speech!
Bulls looking to take control?
Is this the moment to buy and hold Gold for what could be an economic recession?
Best of luck!

Bitcoin: We're gonna ri-ri-ri-ri-rise til we fall!Bitcoin is in a bullish pennant and we have RSI hidden bullish divergence on the 4 hour chart. BTC has found support at $6560 (0.618 fib) and we will probably have some sideways action until we have a breakout to the upside within the next day. Volume has been dropping steadily so expecting capitulation once we get closer to our pennant support. The break out should coincide with a break above the Daily MA50 and the break above the pennant resistance should take BTCUSD above the Daily MA100 at around $6750.
We can expect strong buying pressure once we break through the blue trend line which connects the peaks on 24 July, 4 September and 28 September. Price should then carry enough momentum to break the heavy $6800 resistance and should then reach $7026 at 1.272 fib with an extension to $7127 at 1.414 fib. $7127 also coincides with the large yellow trend line resistance which connects the peaks at 05 May and 24 July. A close above this yellow trend line above $7272 at 1.618 fib should spark a short term rally, however this will be a strong level of resistance given its fib positioning and price could turn from there for a retest of $6800 support. This yellow trend line also serves as resistance for the large bearish descending triangle playing out on the weekly chart.
Remember the bear market is not over until BTC is over the daily MA200 so take caution when everyone starts piling in to the 4th quarter ''bull run".
Good luck and happy trading!
Previous analysis:
