📉 MAGIC/USDT Falling Wedge Setup! 📉📈 #MAGICUSDT is currently forming an intriguing Falling Wedge pattern on the chart, suggesting a potential bullish turnaround! 🚀
📉 The price action has been establishing lower highs and lower lows, outlining the falling wedge pattern. This pattern often implies a period of consolidation and declining selling pressure.
🧩 Falling wedges are renowned for their tendency to precede upward breakouts, which could indicate a forthcoming trend reversal and the initiation of a new bullish phase.
💡 Keep a close eye on the wedge's resistance and support levels to determine the possible direction of the breakout.
📊 Technical indicators are displaying hints of a potential reversal, lending further support to the bullish outlook.
🔔 Be on high alert for a breakout above the upper trendline, as it might serve as a signal for the start of a bullish trend. Plan your profit targets and stop-loss levels accordingly.
📅 Always practice prudent risk management and responsible trading. Conduct your own research before making any trading decisions.
🚨 Exciting possibilities await for #MAGIC! 🚨 Let's see how this Falling Wedge unfolds! 🤞
(Note: This post is for informational purposes only and should not be considered as financial advice. Trading carries risks, and past performance is not indicative of future results. Always conduct your due diligence and seek professional advice when needed.)
#CryptoTrading #TechnicalAnalysis #BullishSetup #TradeSmart #DYOR #CryptoMarket #ChartAnalysis #EmbraceTheWedge #BullishTrend 🚀📈💹
Bullishreversal

SWANENERGY - Bullish Swing ReversalNSE: SWANENERGY is closing with a bullish swing reversal candle supported with volumes.
Today's volumes and candlestick formation indicates strong demand and stock should move to previous swing highs in the coming days.
The stock has been moving along the horizontal support for the past few days which is indicating demand.
One can look for a 8% to 13% gain on deployed capital in this swing trade.
The view is to be discarded in the event of the stock breaking previous swing low.
#NSEindia #Trading #StockMarketindia #Tradingview #SwingTrade

DIXON - Bullish Swing ReversalNSE: DIXON is closing with a bullish swing reversal candle supported with volumes.
Today's volumes and candlestick formation indicates strong demand and stock should move to previous swing highs in the coming days.
The stock has been moving along the horizontal support for the past few days which is indicating demand.
One can look for a 8% to 12% gain on deployed capital in this swing trade.
The view is to be discarded in the event of the stock breaking previous swing low.
#NSEindia #Trading #StockMarketindia #Tradingview #SwingTrade

ZYXI reverses from whipsaw volatility LONGXYNI is now ready to reverse long. I analyze this because ZYXI has dropped
from overvalued and overbought through the fair value zone into undervalued
territory in three trading days by viewing the anchored VWAP bands and the
volume profile, The mean VWAP and POC line are confluent at 7.25. This is the
logical first target. The MACD lines are negative 4X the amplitude of the
the negative histogram on the 2H and impending cross. The mass index is a sensitive
signal of reversal potential is about to trigger and probably has done so on
lower time frames. I will take ZYXI long with a good entry to be found on a 15-30 minute
the time frame when I get an alert that it has crossed over the hand-drawn resistance
trend line. I am expecting 8% before the first take profit target and 12% on the overall
trade over the next 5 trading days or so. A modest profit for low risk, I think.
Anyone in faraway places from the Wall Street market manipulators and FDA, this
one is for you.

RELIGARE - Bullish Swing ReversalNSE: RELIGARE is closing with a bullish swing reversal candle supported with volumes.
Today's volumes and candlestick formation indicates strong demand and stock should move to previous swing highs in the coming days.
The stock has been moving along the horizontal support for the past few days which is indicating demand.
One can look for a 8% to 11% gain on deployed capital in this swing trade.
The view is to be discarded in the event of the stock breaking previous swing low.
#NSEindia #Trading #StockMarketindia #Tradingview #SwingTrade

FCL - Bullish Swing ReversalNSE: SUNCLAYLTD is closing with a bullish swing reversal candle supported with volumes.
Today's volumes and candlestick formation indicates strong demand and stock should move to previous swing highs in the coming days.
The stock has been moving along the horizontal support for the past few days which is indicating demand.
One can look for a 8% to 13% gain on deployed capital in this swing trade.
The view is to be discarded in the event of the stock breaking previous swing low.
#NSEindia #Trading #StockMarketindia #Tradingview #SwingTrade

$PSI - a potential 110% trade based on nothing but TAI an not sure about the fundamentals of TridentDao anymore. It saw a terrible selloff, but this isn't our concern in this moment. This is a purely technical trade I am going to take.
BITGET:PSIUSDT has rallied in the past 2 days, but if it breaks through $0.335 and holds that level it should go to $0.75, with a potential of buy/sell action around $0.54.
If it dumps below $0.32 there is no trade for me. Easy to understand, isn't it?
NFA.
Please understand I am not a professional trader, but an amateur who loves solving riddles, playing chess, analyzing useless stuff - don't invest in anything based of my foolish interpretation of price charts. :-)

PRICOL - Bullish Swing ReversalNSE: PRICOL is closing with a bullish swing reversal candle supported with volumes.
Today's volumes and candlestick formation indicates strong demand and stock should move to previous swing highs in the coming days.
The stock has been moving along the horizontal support for the past few days which is indicating demand.
One can look for a 8% to 12% gain on deployed capital in this swing trade.
The view is to be discarded in the event of the stock breaking previous swing low.
#NSEindia #Trading #StockMarketindia #Tradingview #SwingTrade

Potential Falling Wedge Pattern Formation on $SUSHI/USDT Chart#SUSHI #DEFI #FallingWedge #PatternFormation #TradingView
Hello traders! 👋 I wanted to share an interesting chart observation I made on the $SUSHI/ AMEX:DEFI pair. It appears that a potential falling wedge pattern is forming, which could indicate a bullish reversal in the near future. Let's dive into the details!
1️⃣ Falling Wedge Formation: The price action on the $SUSHI/ AMEX:DEFI chart shows a series of lower highs and lower lows, converging between two trend lines. This pattern is commonly known as a falling wedge, characterized by a contracting range. Falling wedges are often considered bullish reversal patterns.
2️⃣ Volume Analysis: Volume plays a crucial role in confirming patterns. Ideally, we would like to see declining volume as the wedge develops, followed by an increase in volume upon breakout. This could indicate a strong buying interest that could potentially propel the price higher.
3️⃣ Resistance and Support Levels: The upper resistance trend line and lower support trend line are important areas to monitor. A break above the resistance line, accompanied by a surge in volume, may suggest a bullish breakout. Conversely, a breakdown below the support line could invalidate the pattern.
4️⃣ Price Target and Stop Loss: If the falling wedge pattern confirms, a common technique to estimate the potential target is to measure the distance between the widest part of the wedge and add it to the breakout point. As for stop loss placement, it is often set below the support line to limit potential losses.
Keep in mind that technical patterns are not foolproof and should be combined with other forms of analysis, such as fundamental research and market sentiment, before making trading decisions.
To summarize, the $SUSHI/ AMEX:DEFI pair is exhibiting a potential falling wedge pattern, which suggests a bullish reversal might be on the horizon. However, confirmation is required through a breakout above the upper resistance trend line and a surge in volume. Traders should exercise caution and consider utilizing proper risk management strategies.
What are your thoughts on this pattern? Share your insights below! Remember to do your own analysis and consult with financial professionals before making any investment decisions.
#SUSHI #DEFI #FallingWedge #PatternFormation #BullishReversal #TradingAnalysis #TechnicalAnalysis #Cryptocurrency #TradingView

📉 Major Falling Wedge Setup on $STORJ 🚀Hello, fellow traders! Today, I've identified a significant trading opportunity on $STORJ with a major falling wedge pattern. Let's take a closer look:
📈 Technical Analysis:
$STORJ has been forming a well-defined falling wedge pattern, indicating a potential reversal in the current downtrend. Falling wedges are bullish chart patterns that often precede a breakout to the upside, making this setup particularly intriguing.
📉 Wedge Structure:
The falling wedge is characterized by a series of lower highs and lower lows, converging towards a point. This tightening price range suggests diminishing selling pressure and a possible shift in market sentiment. Keep an eye on the wedge's boundaries for potential breakouts.
🔍 Key Levels to Monitor:
Resistance: Watch the upper boundary of the falling wedge as a crucial level that needs to be breached for a bullish breakout.
Support: Monitor the lower boundary of the wedge, which acts as a key support level.
📢 Potential Breakout:
A decisive breakout above the wedge's resistance, accompanied by a surge in trading volume, could signal a bullish move. This breakout might lead to a reversal in the downtrend and potentially provide an opportunity for profits.
💡 Trading Strategy:
Consider initiating a long position on a confirmed breakout above the wedge's resistance level. It's essential to manage risk by setting a stop-loss order below the support level. Keep an eye on the overall market conditions and ensure proper risk management before entering any trades.
Please conduct your own analysis and exercise caution while trading.
📢 Disclaimer: This post is for educational purposes only and should not be construed as financial advice.
Let's stay tuned and follow the action on $STORJ! Share your thoughts and join the discussion below.
#TradingView #FallingWedgeSetup #STORJ #Cryptocurrency #TechnicalAnalysis #BullishReversal #BreakoutPattern

📈 $AAVE Spotting a Triple Bottom within a Downward Channel! 🔍EURONEXT:AAVE has caught our attention with a compelling price pattern - a triple bottom formation within a downsloping channel. 📉⚖️ This setup presents an intriguing opportunity for traders!
The triple bottom, characterized by three distinct lows, suggests a potential bullish reversal. Combined with the downsloping channel, it adds an interesting dynamic to the price action. 📈🔄
Will EURONEXT:AAVE break out of the channel and embark on a bullish rally? Or will it face resistance and continue its downward trajectory? Join the discussion! 📊💬
#AAVE #TechnicalAnalysis #TripleBottom #DownslopingChannel #BullishReversal #TradingOpportunity #TradingView"
Remember, technical analysis is just one piece of the puzzle. Always conduct thorough research and practice risk management. Happy trading! 🚀💰

PNB - Bullish Swing ReversalNSE: PNB is closing with a bullish swing reversal candle supported with volumes.
Today's volumes and candlestick formation indicates strong demand and stock should move to previous swing highs in the coming days.
The stock has been moving along the horizontal support for the past few days which is indicating demand.
One can look for a 8% to 12% gain on deployed capital in this swing trade.
The view is to be discarded in the event of the stock breaking previous swing low.
#NSEindia #Trading #StockMarketindia #Tradingview #SwingTrade

Bullish Reversal Potential on $FIL: Falling Wedge PatternGreetings, Traders! Today, I'm thrilled to share an intriguing technical analysis discovery on the stock of Filecoin ( TSX:FIL ). A falling wedge pattern has emerged, indicating the potential for a bullish reversal in the near future. Let's dive into the details!
📈 Ticker: TSX:FIL
📅 Timeframe: Daily Chart
📊 Pattern: Falling Wedge
📉 Understanding the Falling Wedge Pattern:
A falling wedge is a bullish chart pattern characterized by converging trendlines that slope downward. Typically formed during a downtrend, it suggests diminishing selling pressure and the potential for a reversal. This pattern indicates the possibility of an upward price movement.
🔍 Identifying the Falling Wedge on TSX:FIL :
Upon analyzing the daily chart of TSX:FIL , the following observations come to light:
1️⃣ Recent downtrend: TSX:FIL has experienced a decline in price over the past weeks.
2️⃣ Converging trendlines: The upper trendline connects the lower highs, while the lower trendline connects the lower lows.
3️⃣ Decreasing trading volume: As the falling wedge pattern forms, the trading volume has been declining, indicating a potential reduction in selling pressure.
📈 Price Targets and Trading Strategy:
If the falling wedge pattern on TSX:FIL plays out as expected, a potential bullish breakout above the upper trendline might occur, signaling a reversal and potential price appreciation. Consider the following price targets:
1️⃣ Target 1: Resistance level near $80.00
2️⃣ Target 2: Psychological resistance near $100.00
🛡️ Risk Management:
Implement the following risk management techniques to protect your capital and manage risk effectively:
1️⃣ Set a stop-loss order below the lower trendline to safeguard against unexpected price reversals.
2️⃣ Adjust position size based on your risk tolerance and overall portfolio management strategy.
🔔 Conclusion:
Stay watchful as Filecoin ( TSX:FIL ) continues to develop this falling wedge pattern. The formation suggests the potential for a bullish reversal in the near future. However, please remember that technical analysis has limitations, and market conditions can change. Consider incorporating additional analysis and fundamental factors before making any trading decisions.
Disclaimer: This post is for informational purposes only and should not be considered as financial advice. Always conduct your own research and consult with a qualified financial professional before making any investment decisions.
Happy Trading! 📈💰
#TradingView #TechnicalAnalysis #FallingWedge #BullishReversal #FIL #StockAnalysis #ChartPatterns #TradingStrategies #Investing #Finance #MarketAnalysis

UTIAMC - Bullish Swing ReversalNSE: UTIAMC is closing with a bullish swing reversal candle supported with volumes.
Today's volumes and candlestick formation indicates strong demand and stock should move to previous swing highs in the coming days.
The stock has been moving along the horizontal support for the past few days which is indicating demand.
One can look for a 8% to 12% gain on deployed capital in this swing trade.
The view is to be discarded in the event of the stock breaking previous swing low.
#NSEindia #Trading #StockMarketindia #Tradingview #SwingTrade

$C98 Unveiling the Potential Falling Wedge Pattern! 📉💥FWB:C98 has caught our attention with the emergence of a potential falling wedge pattern. This pattern is characterized by converging trendlines forming a narrowing price range. It suggests a potential bullish reversal and presents an intriguing trading opportunity for savvy traders. 🚀📈
As the price consolidates within the falling wedge, it sets the stage for a potential breakout to the upside. Traders can watch for a decisive move above the upper trendline as a signal of bullish momentum. This pattern may indicate a shift in sentiment and the beginning of an upward price trend. 💹📈
Join the discussion and let's analyze the potential of FWB:C98 as we monitor the development of this falling wedge pattern together! 📊💬
#C98 #FallingWedgePattern #BullishReversal #CryptoTrading #TradingOpportunity #TechnicalAnalysis #TradingView
Remember, conduct your own research and consider risk management strategies when making trading decisions. Stay tuned for further updates on FWB:C98 and other exciting cryptocurrency opportunities!
Happy trading! 📈💰"
#C98 #FallingWedgePattern #BullishReversal #CryptoTrading #TradingOpportunity #TechnicalAnalysis #TradingView

📈 $APE Unveiling a Promising Node Falling Wedge Pattern! 🐵📉$APE/USDT has caught our attention with a notable Node Falling Wedge formation. This pattern signifies a potential bullish reversal and presents an intriguing trading opportunity. 🚀💥
Will $APE/USDT break out of the wedge pattern and ascend to new heights? Join the discussion and let's unravel the potential of this exciting cryptocurrency! 📊💬
#APE #NodeFallingWedge #BullishReversal #CryptoTrading #TradingOpportunity #TechnicalAnalysis
#Crypto #Trading #TechnicalAnalysis
Disclaimer: This analysis is for informational purposes only and should not be considered as financial advice. Always do your own research before making any investment decisions. Happy trading! 📈💰"
Remember, trade wisely and manage risk effectively!

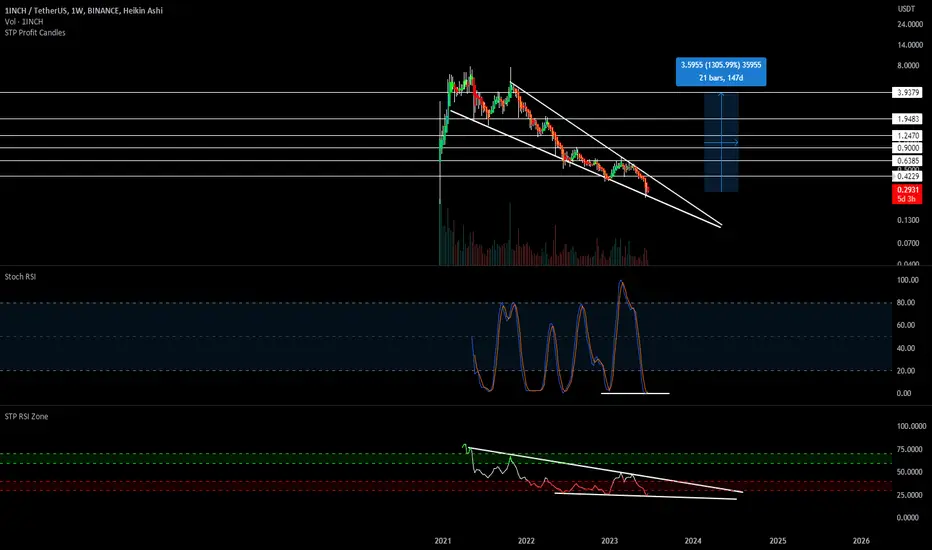
📉 Falling Wedge Alert on $1INCH! Reversal Potential!Hey traders! Today, I want to discuss an intriguing chart pattern I've identified on $1INCH. Let's explore the falling wedge pattern and its implications, particularly in relation to the parabolic trend. 📊💡
Pattern: Falling Wedge 📉🔽
Symbol: CRYPTOCAP:1INCH 💰
Overview:
A falling wedge is a bullish chart pattern characterized by converging trendlines, with the upper trendline sloping downward and the lower trendline sloping upward. The presence of the parabolic trend further adds to the potential reversal scenario. Let's delve into the falling wedge pattern on CRYPTOCAP:1INCH in more detail. ⚡💹
Key Features of the Falling Wedge on CRYPTOCAP:1INCH :
Converging Trendlines: The upper trendline connects lower highs, while the lower trendline connects higher lows, indicating a potential shift in market sentiment. 📈📉
Parabolic Trend Support: Notice that CRYPTOCAP:1INCH is currently holding the parabolic trend, which reinforces the bullish outlook and strengthens the potential reversal signal. 🚀📈
Breakout Expectations:
Falling wedge patterns often precede bullish breakouts. To confirm the pattern, traders typically look for a decisive move above the upper trendline. It is essential to wait for a confirmed breakout before considering any trades. 🚀📈
Trading Strategy:
Entry Point: Consider entering a long position once CRYPTOCAP:1INCH successfully breaks above the upper trendline of the falling wedge pattern, supported by the parabolic trend. This breakout could indicate a potential reversal and continuation of the upward trend. ⬆️💰
Stop-Loss: To manage risk, set a stop-loss order below the lower trendline, protecting against potential downside. ⛔️📉
Target Levels: Identify key resistance levels or previous swing highs as profit targets. Adjust your position size and take profits accordingly. 🎯📈
Risk Management:
Implement proper risk management techniques, such as position sizing, setting stop-loss orders, and adhering to your trading plan. Always be aware of the inherent risks associated with trading cryptocurrencies like $1INCH. ⚠️💼💡
Disclaimer: Trading cryptocurrencies carries risks, and it is crucial to conduct thorough analysis and seek professional advice before making any investment decisions.
#FallingWedge #1INCH #Cryptocurrency #ParabolicTrend #BullishReversal #TradingStrategy #TechnicalAnalysis #ProfitTargets #RiskManagement
In conclusion, the falling wedge pattern identified on CRYPTOCAP:1INCH , combined with the parabolic trend, suggests a potential bullish reversal. Exercise caution and wait for a confirmed breakout before making any trading decisions. Stay tuned for further updates on $1INCH! 🚀💹
(Note: This post is for informational purposes only and should not be considered as financial advice.) 💡💼📚
🔥📉 Falling Wedge Alert on $POLS! Bullish Reversal Brewing?Hey traders! Today, I want to bring your attention to an intriguing chart pattern on $POLS (Polkastarter). Let's dive into the falling wedge pattern and explore the potential for a bullish reversal. 📊💡
Pattern: Falling Wedge 📉🔽
Symbol: $POLS 💰
Overview:
A falling wedge is a bullish chart pattern characterized by converging trendlines, with the upper trendline sloping downward and the lower trendline sloping upward. It often signals a potential trend reversal from bearish to bullish. Now, let's analyze the falling wedge pattern on $POLS in more detail. ⚡💹
Key Features of the Falling Wedge on $POLS:
Converging Trendlines: Notice how the upper trendline connects lower highs, while the lower trendline connects higher lows. This pattern suggests a potential shift in market sentiment. 📈📉
Decreasing Volatility: Observe the gradual contraction of price range and declining trading volume as the pattern develops. These characteristics may indicate diminishing selling pressure. 📉🔻📈
Breakout Expectations:
A falling wedge pattern often precedes a bullish breakout. Traders typically await a decisive move above the upper trendline for confirmation. However, exercise caution and wait for a clear breakout before initiating trades. 🚀📈
Trading Strategy:
Entry Point: Consider entering a long position once $POLS breaks above the upper trendline of the falling wedge pattern. This breakout could signal a potential trend reversal and the start of a bullish move. ⬆️💰
Stop-Loss: Place a stop-loss order below the lower trendline to manage risk and protect against potential downside. ⛔️📉
Target Levels: Identify key resistance levels or previous swing highs as profit targets. Adjust your position size and take profits accordingly. 🎯📈
Risk Management:
Implement proper risk management techniques, including position sizing, stop-loss orders, and adherence to your trading plan. Always be mindful of the inherent risks involved in trading cryptocurrencies like $POLS. ⚠️💼💡
Disclaimer: Trading cryptocurrencies carries risks, and it is essential to conduct thorough analysis and seek professional advice before making any investment decisions.
#FallingWedge #POLS #Cryptocurrency #BullishReversal #TradingStrategy #TechnicalAnalysis #ProfitTargets #RiskManagement
In conclusion, the falling wedge pattern identified on $POLS indicates the potential for a bullish reversal. However, exercise patience and wait for a confirmed breakout before making any trading decisions. Stay tuned for further updates on $POLS! 🚀📊
(Note: This post is for informational purposes only and should not be considered as financial advice.) 💡💼📚

📉 Falling Wedge Alert on $HBAR! Potential Reversal Opportunity?Hey traders! Check out the falling wedge pattern I identified on CRYPTOCAP:HBAR (Hedera Hashgraph). Is a bullish reversal in the cards? Let's analyze and explore potential profit-taking levels! 📊💡
Pattern: Falling Wedge 📉🔽
Symbol: CRYPTOCAP:HBAR 💰
Overview:
A falling wedge pattern on CRYPTOCAP:HBAR suggests a potential trend reversal from bearish to bullish. It forms when converging trendlines indicate decreasing volatility and selling pressure. Now, let's discuss potential profit-taking levels! ⚡💹
Key Features of the Falling Wedge on CRYPTOCAP:HBAR :
Converging Trendlines: Upper trendline connects lower highs, while lower trendline connects higher lows, indicating a potential shift in sentiment. 📈📉
Decreasing Volume: Observe declining trading volume as the pattern develops, implying diminishing selling pressure. 📉🔻📈
Breakout Expectations:
A bullish breakout from the falling wedge can be anticipated. Traders often await a decisive move above the upper trendline for confirmation. Exercise patience and confirm a clear breakout before executing trades. 🚀📈
Profit-Taking Levels:
Take Profit 1: Consider booking partial profits as CRYPTOCAP:HBAR breaks above the upper trendline and reaches the first significant resistance level around $.07. 🎯💰
Take Profit 2: If the bullish momentum continues, look for the next resistance level around $0.10 as a potential profit target. Adjust your position accordingly. 🎯💰
Risk Management:
Implement effective risk management techniques to protect your capital. Set appropriate stop-loss orders below the lower trendline to mitigate potential downside risk. Adapt your trading plan as market conditions evolve. ⚠️💼💡
Disclaimer: Trading cryptocurrencies carries risks. Conduct thorough analysis, seek professional advice, and take responsibility for your investment decisions.
#FallingWedge #HBAR #Cryptocurrency #TradingOpportunity #TechnicalAnalysis #ProfitTakingLevels #BullishReversal #TradingStrategy
In conclusion, the falling wedge pattern on CRYPTOCAP:HBAR indicates the potential for a bullish reversal. Monitor the breakout and adapt your strategy accordingly. Don't forget to implement proper risk management techniques. Good luck! 🚀📊
(Note: This post is for informational purposes only and should not be considered as financial advice.) 💡💼📚

Bullish Reversal on DRIP/BUSD: Falling Wedge Pattern UnveiledGreetings, Traders! Today, I want to share an exciting technical analysis finding on the trading pair of DRIP (the DeFi protocol) and Binance USD (BUSD). A falling wedge pattern has been identified, indicating the potential for a bullish reversal in the near future. Let's delve into the details!
📈 Trading Pair: DRIP/BUSD
📅 Timeframe: Daily Chart
📊 Pattern: Falling Wedge
📉 Understanding the Falling Wedge Pattern:
A falling wedge is a bullish chart pattern characterized by converging trendlines that slope downward. Typically formed during a downtrend, it suggests diminishing selling pressure and the potential for a reversal. This pattern indicates the possibility of an upward price movement.
🔍 Identifying the Falling Wedge on DRIP/BUSD:
Upon analyzing the daily chart of DRIP/BUSD, the following observations come to light:
1️⃣ Recent downtrend: The trading pair has experienced a decline in price over the past weeks.
2️⃣ Converging trendlines: The upper trendline connects the lower highs, while the lower trendline connects the lower lows.
3️⃣ Decreasing trading volume: As the falling wedge pattern forms, the trading volume has been declining, indicating a potential reduction in selling pressure.
📈 Price Targets and Trading Strategy:
If the falling wedge pattern on DRIP/BUSD plays out as anticipated, a potential bullish breakout above the upper trendline may occur, leading to a reversal and potential price appreciation. Consider the following price targets:
1️⃣ Target 1: Resistance level near $40.00
2️⃣ Target 2: Psychological resistance near $50.00
🛡️ Risk Management:
Managing risk is essential for successful trading. Implement the following risk management techniques:
1️⃣ Set a stop-loss order below the lower trendline to protect against unexpected price movements.
2️⃣ Adjust position size based on your risk tolerance and overall portfolio management strategy.
🔔 Conclusion:
Keep a close eye on the DRIP/BUSD trading pair as it develops this falling wedge pattern. The pattern suggests the potential for a bullish reversal on the horizon. However, please note that technical analysis is not infallible, and market conditions can change rapidly. Combine this analysis with other relevant factors before making any trading decisions.
Disclaimer: This post is for informational purposes only and should not be considered as financial advice. Always conduct your own research and consult with a qualified financial professional before making any investment decisions.
Happy Trading! 📈💰
#tradingview #technicalanalysis #fallingwedgepattern #DRIP #BUSD #DeFi #cryptotrading #chartpatterns #bullishreversal #tradingstrategies #investing #finance #marketanalysis

$TOTALDEFI Identifying a Rectangle Bottom PatternHello, Traders! Today, I want to share an exciting technical analysis finding on the cryptocurrency Total DeFi ( CRYPTOCAP:TOTALDEFI ). A rectangle bottom pattern has been identified, indicating the potential for a bullish move in the near future. Let's delve into the details!
📈 Ticker: CRYPTOCAP:TOTALDEFI
📅 Timeframe: Daily Chart
📊 Pattern: Rectangle Bottom
📉 Understanding the Rectangle Bottom Pattern:
A rectangle bottom is a bullish chart pattern characterized by a horizontal price consolidation range. It signifies a period of consolidation before a potential bullish breakout. This pattern indicates the possibility of an upward price movement.
🔍 Identifying the Rectangle Bottom on CRYPTOCAP:TOTALDEFI :
Upon analyzing the daily chart of CRYPTOCAP:TOTALDEFI , the following observations come to light:
1️⃣ Price consolidation range: CRYPTOCAP:TOTALDEFI has been trading within a horizontal range, with relatively equal highs and lows.
2️⃣ Multiple touches: The price has tested the upper and lower boundaries of the range multiple times, confirming the validity of the pattern.
3️⃣ Volume analysis: Observe increasing trading volume during the breakout phase to confirm the pattern's reliability.
📈 Price Targets and Trading Strategy:
If the rectangle bottom pattern on CRYPTOCAP:TOTALDEFI plays out as anticipated, a potential bullish breakout above the upper boundary may occur, indicating a potential price appreciation. Consider the following price targets:
1️⃣ Target 1: Resistance level near $60 billion
2️⃣ Target 2: Psychological resistance near $80 billion
🛡️ Risk Management:
Managing risk is crucial for successful trading. Implement the following risk management techniques:
1️⃣ Set a stop-loss order below the lower boundary to protect against unexpected price reversals.
2️⃣ Adjust position size based on your risk tolerance and overall portfolio management strategy.
🔔 Conclusion:
Keep a close eye on Total DeFi ( CRYPTOCAP:TOTALDEFI ) as it continues to develop this rectangle bottom pattern. The pattern suggests the potential for a bullish breakout and subsequent price increase. However, please remember that technical analysis is not foolproof, and market conditions can change. Consider incorporating additional analysis and fundamental factors before making any trading decisions.
Disclaimer: This post is for informational purposes only and should not be considered as financial advice. Always conduct your own research and consult with a qualified financial professional before making any investment decisions.
Happy Trading! 📈💰
#tradingview #technicalanalysis #rectanglebottom #bullishpotential #TOTALDEFI #cryptocurrency #chartpatterns #tradingstrategies #investing #finance #marketanalysis

Reversal Potential on $XLM: Falling Wedge PatternHello, Traders! Today, I want to share an exciting technical analysis finding on the cryptocurrency Stellar Lumens ( LSE:XLM ). A falling wedge pattern has been identified, indicating the potential for a bullish reversal in the near future. Let's dive into the details!
📈 Ticker: LSE:XLM
📅 Timeframe: Daily Chart
📊 Pattern: Falling Wedge
📉 Understanding the Falling Wedge Pattern:
A falling wedge is a bullish chart pattern characterized by converging trendlines that slope downward. Typically formed during a downtrend, it suggests diminishing selling pressure and the potential for a reversal. This pattern indicates the possibility of an upward price movement.
🔍 Identifying the Falling Wedge on LSE:XLM :
Upon analyzing the daily chart of LSE:XLM , the following observations come to light:
1️⃣ Recent downtrend: LSE:XLM has experienced a decline in price over the past weeks.
2️⃣ Converging trendlines: The upper trendline connects the lower highs, while the lower trendline connects the lower lows.
3️⃣ Decreasing trading volume: As the falling wedge pattern forms, the trading volume has been declining, indicating a potential reduction in selling pressure.
📈 Price Targets and Trading Strategy:
If the falling wedge pattern on LSE:XLM plays out as anticipated, a potential bullish breakout above the upper trendline may occur, leading to a reversal and potential price appreciation. Consider the following price targets:
1️⃣ Target 1: Resistance level near $0.40
2️⃣ Target 2: Psychological resistance near $0.50
🛡️ Risk Management:
Managing risk is crucial for successful trading. Implement the following risk management techniques:
1️⃣ Set a stop-loss order below the lower trendline to protect against unexpected price movements.
2️⃣ Adjust position size based on your risk tolerance and overall portfolio management strategy.
🔔 Conclusion:
Keep a close eye on Stellar Lumens ( LSE:XLM ) as it develops this falling wedge pattern. The pattern suggests the potential for a bullish reversal on the horizon. However, please note that technical analysis is not infallible, and market conditions can change rapidly. Combine this analysis with other relevant factors before making any trading decisions.
Disclaimer: This post is for informational purposes only and should not be considered as financial advice. Always conduct your own research and consult with a qualified financial professional before making any investment decisions.
Happy Trading! 📈💰
#tradingview #technicalanalysis #fallingwedge #bullishreversal #xlm #cryptocurrency #chartpatterns #tradingstrategies #investing #finance #marketanalysis

Bullish Potential on $PYPL: Falling Wedge Pattern Greetings, Traders! Today, I'm excited to share an intriguing technical analysis discovery on the stock of PayPal Holdings Inc. ( NASDAQ:PYPL ). A falling wedge pattern has been identified, indicating the potential for a bullish reversal in the near future. Let's dive into the details!
📈 Ticker: NASDAQ:PYPL
📅 Timeframe: Daily Chart
📊 Pattern: Falling Wedge
📉 Understanding the Falling Wedge Pattern:
A falling wedge is a bullish chart pattern characterized by converging trendlines that slope downward. Typically formed during a downtrend, it suggests diminishing selling pressure and the potential for a reversal. This pattern indicates the possibility of an upward price movement.
🔍 Identifying the Falling Wedge on NASDAQ:PYPL :
Upon analyzing the daily chart of NASDAQ:PYPL , the following observations come to light:
1️⃣ Recent downtrend: NASDAQ:PYPL has experienced a decline in price over the past weeks.
2️⃣ Converging trendlines: The upper trendline connects the lower highs, while the lower trendline connects the lower lows.
3️⃣ Decreasing trading volume: As the falling wedge pattern forms, the trading volume has been declining, indicating a potential reduction in selling pressure.
📈 Price Targets and Trading Strategy:
If the falling wedge pattern on NASDAQ:PYPL plays out as anticipated, a potential bullish breakout above the upper trendline may occur, signaling a reversal and potential price appreciation. Consider the following price targets:
1️⃣ Target 1: Resistance level near $320.00
2️⃣ Target 2: Psychological resistance near $340.00
🛡️ Risk Management:
Implement the following risk management techniques to protect your capital and manage risk effectively:
1️⃣ Set a stop-loss order below the lower trendline to safeguard against unexpected price reversals.
2️⃣ Adjust position size based on your risk tolerance and overall portfolio management strategy.
🔔 Conclusion:
PayPal Holdings Inc. ( NASDAQ:PYPL ) is exhibiting a falling wedge pattern, suggesting the potential for a bullish reversal in the near future. However, please remember that technical analysis has limitations, and market conditions can change. Incorporate additional analysis and fundamental factors before making any trading decisions.
Disclaimer: This post is for informational purposes only and should not be considered as financial advice. Always conduct your own research and consult with a qualified financial professional before making any investment decisions.
Happy Trading! 📈💰
#TradingViewAnalysis #TechnicalAnalysis #FallingWedgePattern #BullishReversal #PYPLStock #StockMarketAnalysis #ChartPatterns #TradingSignals #InvestSmart #FinancialMarkets #MarketAnalysis
