ALLCARGO - Bullish Swing Reversal with VolumesNSE: ALLCARGO is closing with a bullish swing reversal candle supported with volumes.
Today's volumes and candlestick formation indicates strong demand and stock should move to previous swing highs in the coming days.
The stock has been consolidating for the past few days which is indicating demand.
One can look for a 8% to 12% gain on deployed capital in this swing trade.
The view is to be discarded in the event of the stock breaking previous swing low.
#NSEindia #Trading #StockMarketindia #Tradingview #SwingTrade
Disclaimer:
This is for educational purposes only.
Bullishreversal

ROLEXRINGS - Bullish Swing ReversalNSE: ROLEXRINGS is closing with a bullish swing reversal candle.
Today's candlestick formation indicates strong demand and stock should move to previous swing highs in the coming days.
The stock has been consolidating for the past few days which is indicating demand.
One can look for a 8% to 12% gain on deployed capital in this swing trade.
The view is to be discarded in the event of the stock breaking previous swing low.
#NSEindia #Trading #StockMarketindia #Tradingview #SwingTrade
Disclaimer:
This is for educational purposes only.

RCF - Bullish Swing ReversalNSE: RCF is closing with a bullish swing reversal candle supported with volumes.
Today's volumes and candlestick formation indicates strong demand and stock should move to previous swing highs in the coming days.
The stock has been consolidating for the past few days which is indicating demand.
One can look for a 8% to 11% gain on deployed capital in this swing trade.
The view is to be discarded in the event of the stock breaking previous swing low.
#NSEindia #Trading #StockMarketindia #Tradingview #SwingTrade
Disclaimer:
This is for educational purposes only.

SIYSIL - Bullish Reversal with VolumesNSE: SIYSIL is closing with a bullish reversal candle supported with volumes.
Today's volumes and candlestick formation indicates strong demand and stock should move to previous swing highs in the coming days.
The stock has been consolidating for the past few days which is indicating demand.
One can look for a 8% to 13% gain on deployed capital in this swing trade.
The view is to be discarded in the event of the stock breaking previous swing low.
#NSEindia #Trading #StockMarketindia #Tradingview #SwingTrade
Disclaimer:
This is for educational purposes only.

RAIN - Bullish Swing Reversal with VolumesNSE: RAIN is closing with a bullish candle supported with volumes.
Today's volumes and candlestick formation indicates strong demand and stock should move to previous swing highs in the coming days.
The stock has been consolidating for the past few days which is indicating demand.
One can look for a 8% to 13% gain on deployed capital in this swing trade.
The view is to be discarded in the event of the stock breaking previous swing low.
#NSEindia #Trading #StockMarketindia #Tradingview #SwingTrade
Disclaimer:
This is for educational purposes only.

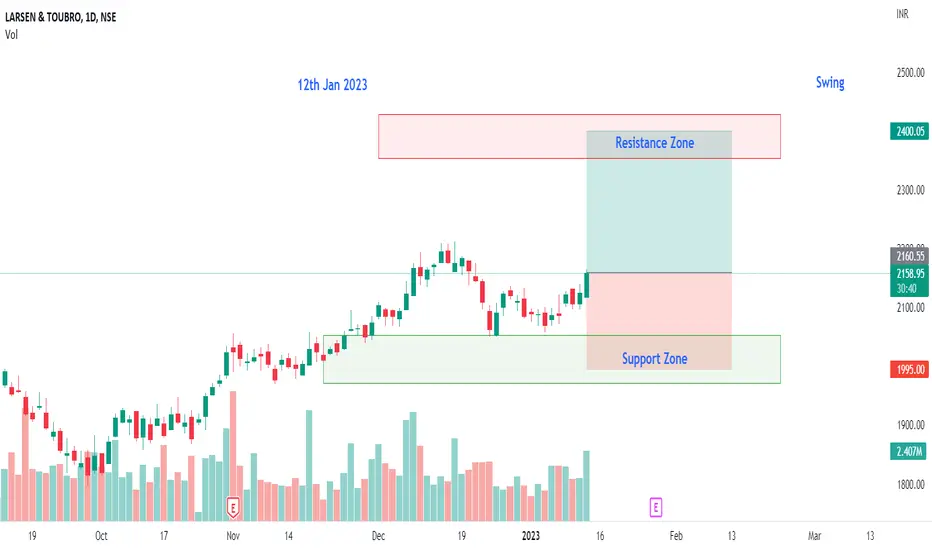
LT - Bullish Swing ReversalNSE: LT is closing with a bullish candle supported with volumes.
Today's volumes and candlestick formation indicates strong demand and stock should move to previous swing highs in the coming days.
The stock has been consolidating for the past few days which is indicating demand.
One can look for a 8% to 11% gain on deployed capital in this swing trade.
The view is to be discarded in the event of the stock breaking previous swing low.
#NSEindia #Trading #StockMarketindia #Tradingview #SwingTrade
Disclaimer:
This is for educational purposes only.
RBLBANK - Bullish Engulfing Reversal NSE: RBLBANK is closing with a strong bullish engulfing reversal candle.
Today's candlestick formation indicates strong demand and stock should move to previous swing highs in the coming days.
One can look for a 8% to 11% gain on deployed capital in this swing trade.
The view is to be discarded in the event of the stock breaking previous swing low.
#NSEindia #Trading #StockMarketindia #Tradingview #SwingTrade
Disclaimer:
This is for educational purposes only.

How to Spot Reversal Of Bullish Or Bearish Trend- Elliott Wave Dear traders,
In this video I want to look at some basics of Elliott Wave analysis and how to spot top/bottom or reversal of a trend. There are specific patterns that can help us define useful set-ups for potential trade idea.
Hope you will enjoy the video.

semiconductors daily bounce or continued downsidewe are at the low end of top anchored vwap. if we get over this pivot and support meaningfully we could see a test of sss moving average or signal around upper horizontal and gap close. if we remain beneath and resist with sss signal and qqe staying red id look for that lower horizontal.

MSFT: A bullish reaction in a support area!• MSFT is reacting just above a clear support level at $235.10 (dividend adjusted chart);
• Although we see a strong bullish reaction, we don’t see reversal signs yet;
• Would be good if MSFT close the weekly chart like this, or if we see a clear bullish reversal pattern in the daily chart before assuming it’ll reverse;
• Either way, there are two open gaps (yellow squares, daily chart), and they would be our next targets if MSFT confirms a reversal;
• On the other hand, by losing the $235 level, it will just resume the bear trend and seek the $200 area;
• This could be the beginning of a strong reversal, so it is important to keep an eye on MSFT for now, as the Risk/Reward ratio looks very good.
I’ll keep you guys updated on this. Remember to follow me for more analysis like this! Keep in touch.

MU: Reacting at a SUPPORT LEVEL!• MU is reacting this week, but the trend is still bearish;
• MU is doing lower highs/lows, and in theory, it is seeking the next support at $46.23 (red line);
• Could MU bounce from here? Yes, and this week is doing a bullish reaction, but it must close above the $51.30 again in order to recover to the $58 - $60 area again;
• By closing above $51.30, MU will trigger a false breakout from a previous support level. Along with the recent increase on the volume, this might be what it takes for MU to recover;
• MU is a promising stock, but for now, it must do better signs in order to become attractive again.
I’ll keep you guys updated on this. Remember to follow me for more analysis like this! Keep in touch.

AMZN: This structure could REVERSE the bear trend!• AMZN is in a bear trend, as it is doing nothing but lower highs/lows, and there’s no sign of reversal yet;
• In addition, AMZN is trading below the 21 ema, which is working as a resistance;
• Since it is a bear trend and there’s no confirmation of a reversal, the area near $100 is the next support level;
• However, a possible bullish structure could reject this thesis. If AMZN breaks the previous resistance at $117 (black line), it’ll break the bear trend by doing a higher high/low, and by breaking the 21 ema;
• This reversal would have a target at the last gap ($136 – green line), however, there’s no confirmation that AMZN will trigger this bullish pivot point;
• In the daily chart, we see why the $117 is important. It is not just the previous top in the 1h chart, but the previous top twice, in June and July;
• In addition, AMZN is below the 21 ema in the D chart as well, and this point will probably work as a resistance in the future. Still the gap around $136 would be the ideal target;
• However, in the lack of confirmation, AMZN will just seek the next bottom at $102, therefore, it is important to see some reaction as soon as possible if it wants to avoid this scenario.
Remember to follow me for more analysis like this! Keep in touch.

SPY: Very bearish! What could make it bounce?• So far, SPY is heading to the next support at $360.69, indicating we have a few more bucks to drop, and there’s no technical evidence pointing to a reversal. In the daily chart, at least, there’s not a single bullish pattern yet;
• We see some open gaps (yellow squares), and they will become targets, in the future, if (and only if) SPY triggers a reaction;
• In the 1h chart we see a possible bullish structure, a Double Bottom chart pattern. Keep in mind, this pattern wasn’t triggered yet, and maybe SPY won’t trigger it at all, but it is important to keep in mind a scenario where it’ll break the $370.21;
• By triggering this Double Bottom, SPY would bounce back up to the $388 (its next target);
• In my view, I would prefer to see it bouncing after a retest of the $360, but this could work too;
• This wouldn’t be a true bullish reversal sign, and maybe would be just a Dead Cat Bounce, but could be the beginning of a true mid-term reversal. I’ll keep you guys posted on this.
Remember to follow me for more analysis like this! Keep in touch.

EUR/USD waiting for break out of range to go bullishI'm currently waiting for a break out of range to find signs of a bullish market considering current overbought situation on the dollar.
A break above level X will indicate a comfortable upward continuation.
For now we wait for a break outside the range to see what the market tells us

ZYDUSLIFE - Bullish ReversalNSE:ZYDUSLIFE was trading in a downtrend from July 2021 to May 2022 until it stopped making lower lows. It traded in sideways (accumulation phase) for past 3 months and finally broke out of sideways price action recently. Let's take a deep dive to understand the trading opportunity in ZYDUSLIFE.
Multi timeframe analysis -
Weekly TF(Higher timeframe) -
Below chart shows the price structure change from LH-LL to HH-HL in weekly TF. We are also getting additional trend change confirmation using a RSI technical indicator. RSI is showing bullish divergence.
Daily TF(Trading timeframe) -
We are able to see the similar price structure and bullish RSI Divergence in daily TF.
Zooming into sideways price actions, Presence of supply had been seen between 370 and 375. Price was rejected from this supply zone multiple times until it absorbed all the supply and did a breakout. There was a significant volume in the breakout candle which indicates the presence of demand (supply zone is now turned into demand zone). At present the price has retraced back to the breakout level (demand zone).
45 minutes TF(Lower timeframe) -
Looking into 45 minutes timeframe, We are seeing two bullish signs.
1) Price reversal from demand zone with a good volume
2) Bullish RSI Divergence
As per the above analysis, we may see a bullish reversal price action for short term. Once 400 price level is breached, the next supply zone is around 450.
If you have a different opinion, please share your thoughts in the comment section. If you like my ideas, please show some appreciation with a like and follow me for more such trade ideas. Happy and safe trading! :)

DASH - bullish reversalNYSE:DASH has formed falling wedge pattern and recently did a breakout. Additionally, It has formed a double bottom and there's a RSI bullish divergence on daily time frame. If price breaks above double bottom neckline, bullish trend will be confirmed and bullish entry can be taken upon retest of a neckline.

Zomato - Bullish reversalNSE:ZOMATO had been trading in a downtrend for months and now seems like it found a bottom. It made a falling wedge structure in a downtrend which indicates that selling pressure is getting weaker and buyers are stepping in. It broke out of falling wedge resistance and now trying to take a support at the breakout level. If it succeeds in breaking 75 level, We could see it go up to previous supply level (115-125). Range between 115 and 125 is a supply zone as a huge selling volume came in between these two prices and price fell down sharply.

RIVN: Doing its first BULLISH STRUCTURE ever!Hello traders and investors! Let’s see how RIVN is doing today! For the first time, RIVN is doing a clear bullish structure, and this could indicate a reversal ahead.
In the daily chart, we see that for the first time ever, RIVN has a clear bullish structure, as it just did a higher high/low, and triggered a pivot point. In addition, it is trying to leave the 21 ema behind again (it tried to do that in the past, but with the lack of bullish structure, it failed miserably).
Keep in mind that this is the early stage of a reversal, and the situation is still risky. Another key point we must pay attention is the red line at $ 33.46. This point worked as a support and resistance in the past, and could work as a resistance again. In the end, RIVN must break this point to confirm a reversal, and not lose it again.
By breaking this line, RIVN could do a pullback to its 21 ema in the weekly chart, at least, near the $ 50 (the 21 ema is descending, so it’ll be lower in the next weeks, keep that in mind).
Either way, we have a lot of upside potential in the mid-term. This is not a long-term reversal yet, as the trend is clearly bearish on RIVN since its IPO in November.
I’ll keep you guys updated on this, so remember to follow me to keep in touch with my daily analyses!

Swing & positional trading opportunities for next week (9th May)Our watchlist for the week ahead, compiled with @AVENUESOFINVESTMENT

SPX: Doing a REVERSAL pattern!Hello traders and investors! Let’s see how the SPX is doing today!
First, in the 1h chart, we see that it is reacting nicely, after yesterday’s crash. This is a good recovery, and might be the beginning of a reversal, the problem is that we don’t see a clear bullish structure yet, and the index is still in a bear trend, doing lower highs/lows.
In the 1h chart, we see no technical reversal pattern yet. I think it is good to see it breaking the 21 ema, but I would be happier to see a good chart pattern indicating a reversal.
However, in the daily chart, something interesting is happening:
We might not have any reversal chart pattern in the 1h chart, but we do have a reversal candlestick pattern in the daily chart. Yesterday, we had a Hammer pattern, which was triggered today. One may argue that Hammers are not that reliable, but in my experience, when this pattern appears just above a support, the chances of a reversal are greatly increased.
The support level was at 4,167, and today, the index is breaking this point. If we close above it, even better. The volume looks ok, which confirms a bullish thesis. Now, we can expect the index will retest its 21 ema in the daily chart again.
Even considering it could do a pullback in the 1h chart (and I prefer to see this happening), the index is giving us some interesting technical reversal signs. What could ruin this reversal? If it loses yesterday’s low.
I’ll keep you guys updated on this, so remember to follow me to keep in touch with my daily analyses!

Swing & positional trading opportunities for next week (2nd May)Here's my watchlist for the coming week, compiled with @AVENUESOFINVESTMENT. What are some of your picks?

Graph Protocol Relief RallyNear-term long positions are attractive, with reassessment necessary as inflation reporting in April approaches. Bullish continuation will be more risky in the days leading up to CPI/PPI reporting.
Following Bitcoin and the broader markets, GRT will realize near-term bullish support as the markets have shrugged of the Fed's 25 bps rate hike.
GRT will flip 20 EMA into support, then push through 100 EMA... ultimately testing 200 EMA until next round of economic reporting.
Sharply rising prices are elected to continue as there's been no substantive change to monetary policy, QE continues, corporations continue elevated pace of stock buybacks.
Inflation results for March (CPI & PPI) will be published by BLS on 4/12 & 4/13 with high likelihood of further increases from the lagging reporting.
April reports will be a pivotal as the FOMC will not meet until early May with the April inflation results published a week after the Fed meeting.
Current expectation is shockingly higher inflation with the Fed's hand being forced, either accept persistent inflation and risk a wage-price spiral or adjust approach with more hawkish action and less reliance on hollow words.
Maintaining status quo until midterm elections is likely to become untenable, recession risk is increasing.

SPX: Time to BUY the DIP? Only if it does this...Hello traders and investors! The SPX dropped sharply after it lost our support at 4,456, so we have a lot to update.
First, as we already discussed in my last analysis, the 4,456 was the key point, and only by losing it, we would see a bearish reversal. I’ll leave the link to my previous analysis below this post. Now the index lost all of its support levels, and there’s nothing indicating it could reverse from here.
We had a good reaction yesterday, but this is not enough, and I don’t see any clear bullish structure in the 1h chart that could convince me that the index will fly again. However, if the index reacts and breaks the 4,299, I’ll consider it a great sign, and it might be the reversal structure it needs (it must not lose the 4,200, though, otherwise, the bear trend will likely persist).
Now, let’s see the daily chart:
Yesterday the index did a classic Hammer candlestick pattern, a good bullish reaction, but to me, this pattern would be much more appealing if it appeared closer to the support at 4,167. Either way, it is a Hammer and the volume was above the average, indicating a possible exhaustion of the bear trend.
The points mentioned in the 1h chart (resistance at 4,299 and support at 4,200) are this Hammer’s high and low. If it loses the 4,200, it’ll just resume the bear trend. However, the 4,299 is yesterday’s high, and if the index breaks this point, it’ll trigger this Hammer pattern, along with a possible bullish structure in the 1h chart (as we already mentioned), and this is the confirmation sign we need.
Let’s keep our eyes open at the 4,299, as this seems to be the most important resistance on the SPX! I’ll keep you guys updated on this, so, remember to follow me to keep in touch with my daily analyses! I couldn’t update you guys last Friday and yesterday, but the link to my previous idea is in the link below.
