IOST DAILY TREND REVERSAL (BULLISH)Hi guys ...
it is not a financial advise please do your own research .
Looks like this baby is BULLISH !
1. daily bearish trend line is broken
2. triple bottom
3. RSI overbought
4. we need a test of support
5. if plays out 64 % minimum
As a wise man said Yepi yoka yay
2k in
profit : 1280 $
stop loss : 340 $
Take care, trade safe , best regards
Bullishreversal

ADAUSD D1Cardano preparing for breakout! It has been consolidating In the falling wedge pattern for some time, below the key level support. I am watching for a clear breakout candle above the upper trendline & green zone for bullish confirmation as ADA may be preparing for a big bull run soon !

Bitcoin Relative to Trend & CPI/PPI ResultsBroader markets have responded to the continuation of loose monetary policy, while the Fed will be faced with spiking prices as CPI & PPI results post within 24 hours each the next two months and the FOMC has to decide whether the current approach remains viable as midterm elections approach.
BTC will likely reverse bearish trend for next month or two as it follows the broader markets, then falling back into bearish drawdown as the Fed is forced to tighten monetary policy or risk runaway inflation.
Status quo in the markets until post midterm elections are complete is unlikely given unsustainable spikes in commodities and further increased wage pressures.
Housing sales continue to decline as a reference, the near-term reprieve from bearish continuation will offer some opportunities but likely will not be sustained come summertime.

ZEC Breakout Confirmation NeededZcash has realized a bullish reversal this week as the markets absorbed inflation reporting, the EU parliament excluded language restricting Proof-of-Work from MiCA, and the Federal Reserve clearly conveyed no substantive change to monetary policy in the immediate future.
Bullish price action likely to continue if ZEC confirms a breakout from the descending triangle with a daily close above the trendline, idealing realizing $170 support with a clean bounce.
Broader markets appear poised to enjoy bullish sentiment for next few months given midterm elections this fall.
Significant risk of further inflationary pressure resulting in a monetary policy reversal cannot be ignored.
Closely watch CPI & PPI in the coming months as these likely will see further sharp increases that will ultimately result in Central Banks reversing course.

Bitcoin Bullish Reversal Post FOMCTraditional markets responded with rallies following the Federal Reserve's tame communication following the FOMC meeting this week.
The 25 bps hike is nothing more than a symbolic statement, with the midterm elections looming and the Fed finally acknowledging that inflation is more persistent than what they had hoped.
The lack of serious action is likely to result in a reversal to near-term bullish action while inflation continues unchecked.
The next few months of "business as usual" are likely to support more upward prices, with CPI & PPI continuing to climb.
With the Fed's dovish stance and inflation soaring, there will be a significant amount of attention on what steps to take.
The real question is: can the economy support rampant inflation until midterm elections in November?

US30 longThe Dow has been bearish for the most part this year, and I believe we're about to see a bullish recovery in the long term considering current price action.

ROKU - Bullish Shark Harmonic ReversalNASDAQ:ROKU just hit the harmonic PRZ level of bullish shark harmonic pattern. Stock might see a short term bullish reversal from here.

SPX: What could technically reverse the trend? Check this out!Hello traders and investors! Let’s see how the SPX is doing today!
First, it hit our target at 4,292, and it seems we see some reaction in this area. We identified the 4,292 as an important support level, and so far, it is working. The link to my previous analysis is below this post.
The fact the index is stabilizing in a support area is a good thing, however, it is not enough to reverse the trend. Remember: Trends persist, until a clear reversal occurs (Dow Theory 6th tenet). No clear reversal? It is still a bear trend.
However, we do have a possible reversal chart pattern, which is still in formation. We see a possible Double Bottom chart pattern, and for this pattern to be triggered, we must break the 4,333 (the peak between the valleys). This would break the 21 ema at the same time, and the target for this bullish leg would be the Breakaway Gap at 4,472 (red line).
The index is in a support level in the daily chart too, as evidenced by the black line. So far, this drop was intense price-wise, but weak volume-wise. This makes the index more vulnerable to catalysts, and the volatility might increase dramatically when this happens.
Despite the possible bottom sign in the 1h chart, we see no meaningful reaction in the daily chart that justifies a buy at this moment, but I agree that we could see one soon. If this reaction could reverse the mid-term trend as well, it is a different story.
Either way, I’ll keep you guys updated every day on SPX, so remember to follow me to not miss any of my future analyses.

Bullish BreakoutNZDCAD has broken out of the descending trendline. We expect a period of consolidation followed by a possible short term bullish reversal.
#SpeculativeSetup
#NFA
#RiskManagement

It's just FUD. Stick with the fundamentals and be patientWe faced a >50% drop from the previous ATH around the 68k level and created a new lower low.
The last dip down to the 33k level was bought up with higher volume compared to the previous dips during this downtrend which indicates that we could have bottomed out.
The RSI still is below 40 and probably will test the yellow line in the near-term.
Once we break this downtrend on RSI we expect to be above the critical 40k level and recover properly from this downfall.
Until this happens we are in a downtrend and could see further downside.
Big support lies around the 30k level while the support around 40k turned into resistance and is our first test for upside movement.
Most indicators show that we have bottomed out or are very close to it.
Keep in mind that often times we feel doomed or the opposite invincible, this is the time we are wrong and reversals happen.
So ask yourself how you feel and what it means.
Feel free to comment or ask anything you like.
Always do your own research and keep in mind that my charts and comments cannot be considered financial advice.
Cheers
Ctumblery

IDFC - Potential Bullish ReversalNSE:IDFC is at the key support level formed by fibonacci cluster. It is also at the PRZ level of Bullish Gartley Harmonic PRZ pattern. Volume Zone Oscilator is also in the oversold zone. It might do a bullish reversal from here.
Gartley PRZ pattern requires below criteria:
XAB - 0.618
AC - 0.383-0.886
BD - 1.272-1.618
XD - 0.786

AAVE Inverse Head and Shoulder PatternBINANCE:AAVEUSDT
Hello Traders,
AAVE is forming inverse head and shoulders pattern on a daily timeframe which is a short term bullish reversal sign. Prices have been fluctuating between 160-300 since November. AAVE formed left shoulder and head during December and finally formed the right shoulder in 2022. Left neck is lower than the right neck which is one of the main characteristics of head and shoulder pattern. AAVE tested resistance zone of 280-290 lately but couldn't break above it. It made a partial decline forming the right shoulder and we know that partial declines or partial rises are usually a sign of the change in the trend. Volume has shaped U pattern which also pretty common in head and shoulder patterns.
Even though there are strong signals and confirmations of a bullish trend I would suggest to wait for the final confirmation of price breakout above the resistance line (red line) and the right neckline (blue line). If the price breaks and trades above these 2 lines open a long position.
Using our measure rule (distance between the lowest price in head formation and the highest price on neckline) for inverse head and shoulder patterns, my price targets are:
1st price target is $360 for the next 15-30 days.
2nd price target is $450 for the next 15-30 days.
I will share an update if I see any reversal signs.
Good luck and trade smart! (not a financial advice)
Please like and share if you like my idea.

BTC Market Cap (Time to resume the bullish momentum)This is the weekly timeframe of BTC market cap, as you can see the BTC often bounce off the trendline which acts as an support. Base on this, i feel BTC is gaining dominance as we reclaim back 1 trillion market cap for BTC. As history data proven, during the period where we count down to end of the year, it's gonna be bullish for crypto market.
BTC Market Cap

HDFC - Potential Bullish ReversalNSE:HDFC is at the PRZ level of Bullish Gartley Harmonic PRZ pattern. Volume Zone Oscilator is also in the oversold zone. It might do a bullish reversal from here.
Gartley PRZ pattern requires below criteria:
XAB - 0.618
AC - 0.383-0.886
BD - 1.272-1.618
XD - 0.786

DESCENDING BROADENING WEDGEDescending broadening wedge happens during a downtrend. which in case of breaking the Resistance of the wedge it can bring in a good setup for a long on the asset.
Price makes a low and rises. We then track price as it rises away from the low. We are looking for lower highs and lower lows in a tight range.
The lower highs make a falling trendline, this forms the upper boundary to our pattern. The lower lows make a lower falling trendline, this forms the lower boundary to our pattern.
With the Descending Broadening Wedge formation, we are looking for two touches to each trendline.
Both the upper and lower trendlines should fall. The lower trend line should fall more steeply than the upper trendline thus forming the broadening wedge.

Bitcoin at crucial support around 46k$ testing the 200 daily MABitcoin tests the 200MA at the same level we have the purple central line of the accumulation box indicated by the thick orange and bright green lines.
We are within this accumulation box for 241 days yet and holding the central line is important to stay within the upper bullish zone.
The current drop looks too steep for a long term trend and price volatility calmed down a little bit just above crucial support lines.
The RSI shows that we are just above 30 and currently in a downtrend indicated by the yellow line.
We expect Bitcoin to hold the 46k$ line, maybe consolidate a week, and move back up to the 60k$ levels.
This would result in a breakout of the yellow downtrend lines on the price and RSI chart.
Keep in mind that often times we feel doomed or the opposite invincible, this is the time we are wrong and reversals happen.
So ask yourself how you feel and what it means.
Feel free to comment or ask anything you like.
Always do your own research and keep in mind that my charts and comments cannot be considered financial advice.
Cheers
Ctumbler

EURGBP Elliott Wave Analysis: Ending Diagonal Causes A ReversalHello traders!
EURGBP is coming higher for the last few weeks, after the pair moved to the lower side of a big 2016-2020 range. Notice that pair is coming higher after a five-wave drop on a daily chart where we see a bottom formation because of a wedge pattern in a fifth wave. Wedge, or ending diagonal, is a special type of a pattern that has a slow and choppy price action, with slow momentum and volume, which is normally indication that opposite move will occur, usually very strongly.
Notice that so far, we can see a price coming nicely out of a wedge so we should be aware of a higher prices, but possibly after intraday set-backs. Many times you will also notice that after an ending diagonal is finished, price will retrace back to the starting point of the pattern which in our case is at 0.8720.
Trade well!
Disclosure: Please be informed that information we provide is NOT a trading recommendation or investment advice. All of our work is for educational purposes only.

BTC-USD Bitcoin road to Recovery 68K and new ATHsInterval: 4hrs
Description: After the Taproot upgrade Bitcoin gets as low as 53/54Ks and recovers for 68/69K ATH with parabolic flight. Afterwards new ATHS 79K and others are on the horizon.

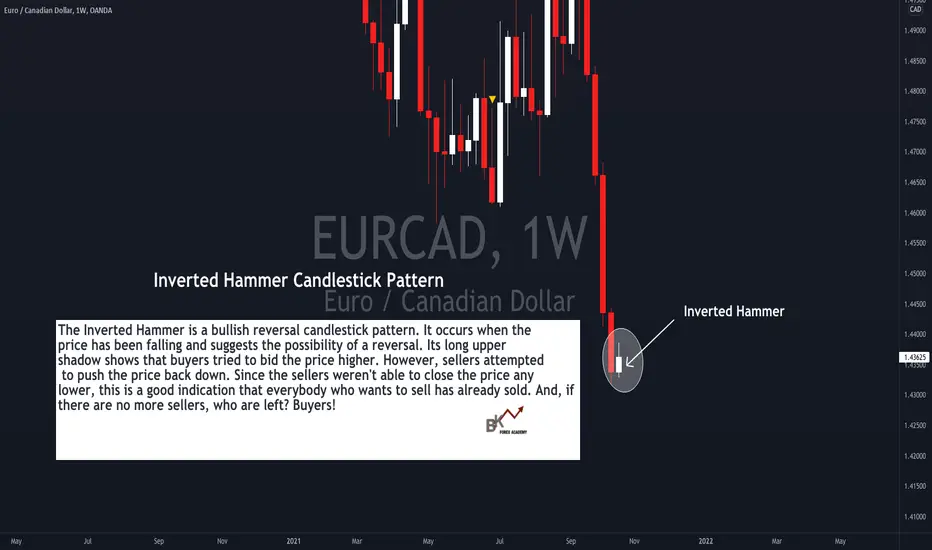
What Does the Inverted Hammer Candlestick Pattern Mean? Hello Traders!
Have you ever wondered when will a strong trend end? Do you struggle to spot candlestick patterns that potentially signal when the bulls or bears might take over?
Take a look at this example of EUR/CAD and let's see how the trade plays out! :)
About the Inverted Hammer Candlestick Pattern and Why It Forms:
The Inverted Hammer is a bullish reversal candlestick pattern. It occurs when the price has been falling and suggests the possibility of a reversal. Its long upper
shadow shows that buyers tried to bid the price higher. However, sellers attempted to push the price back down. Since the sellers weren't able to close the price any
lower, this is a good indication that everybody who wants to sell has already sold. And, if there are no more sellers, who are left? Buyers!
And just an important observation, the Inverted Hammer has a small real body, and has a large upper shadow with a small or no lower shadow (also known as "wick").
Would you like to receive more "live charting" tutorials like this?? Comment below and let us know! :)
Happy Trading!
OXTUSDT CwH Pattern | 75% Move ExpectedOXTUSDT CwH Pattern | 75% Move Expected on Handle Breakout
NOTE: Do your own analysis. Do proper risk and money management. Spot trading only.
Entry: 0.3910
TP1: 0.4326
TP2: 0.5072
TP3: 0.5889
TP4: 0.6865
SL: 0.3322
ROI: 68% - 75%
Risk: 15%
Do not use more than 10% Risk of your account.
Do not enter if you don't know how to trade.

EB - texbook chartI went through a lot of charts this weekend. Most of them look choppy and ugly which is not surprising with this choppy market.
Picked this one which looks really healthy.
Just left the March-to-September downtrend, went above the strong level at 19.
Then made a healthy pull back, still hold arond the level. Yesterday - nice breakout.
MACD. RSI - positive
Weekly chart: breaking out from a wedge
Stop loss 18.40
Target 25

AUDJPY Bullish ReversalIf you like this idea, like it and follow me for more.
Colour key: Pink = weekly, Grey = daily
I've drawn out several supply and demand zones from the weekly timeframe, as week as key levels from the daily timeframe.
I held a nice 180 pip short last week but i expect to see price have a correction and continue to go up. I've also taken DXM and interest rates into account for my bias.
Updates to follow, follow me to see them.

Industower long setup Industower seems to be at crucial level and have high probability of reversal from the current level based on historical price action, fibo-retracements and trendline.
Suggestions for entry:
> wait for high volume rejection from the level.
> entry point should be the OHLC4 of this candle
> Stoploss should be below the low of this candle or below trendline
> Targets 280 and 350
Good luck to all the traders!!
