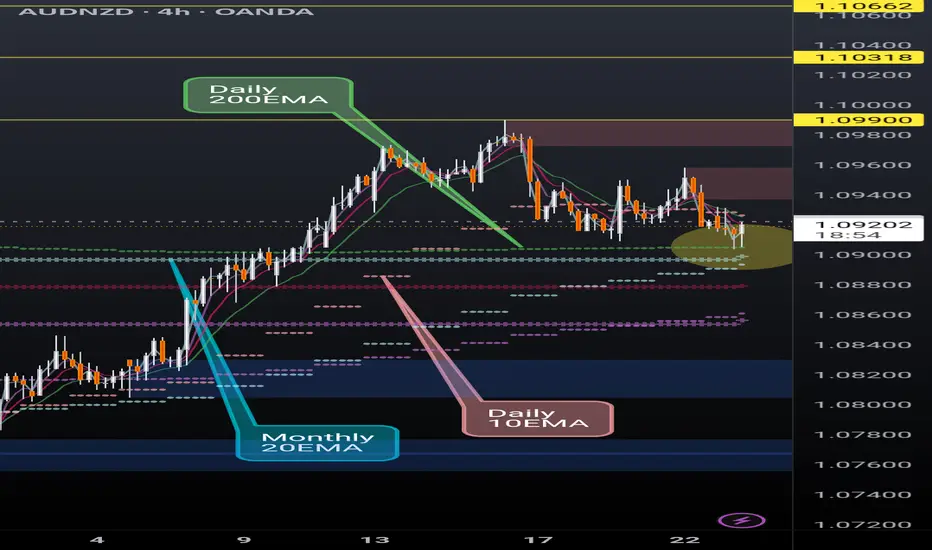
AUDNZD finding support on critical EMAsAUDNZD is finding support at the daily 200EMA (overlayed on 4H chart) and, more significantly, above the monthly 20EMA (overlayed). Break and hold the daily 10EMA (overlayed) will be key.
If the momentum continues we could see a continuation of the ongoing rally however recent AUD monetary policy meeting minutes seemed to lean dovish.
I'm a cat not a financial advisor.
Bullishsetup
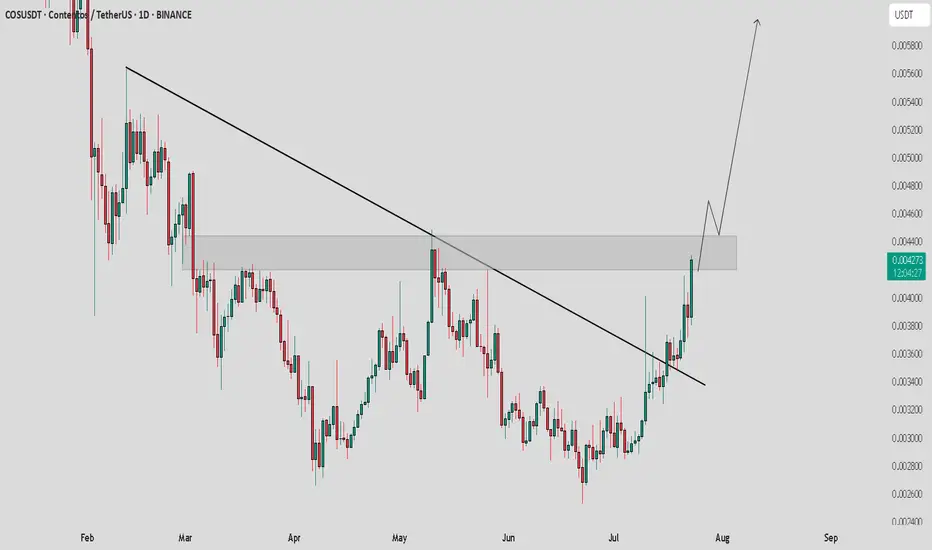
COS / USDT : Breakout setupCOS/USDT - Breakout Setup
COS/USDT is showing strong potential, currently trying to break out from horizontal resistance after a successful trendline breakout. Once the horizontal resistance is cleared, we could see a bullish move of +30% to +40%.
Bullish Scenario:
Break above horizontal resistance confirms continuation, targeting a move of +30% to +40%.
Pro Tip:
Watch for confirmation with volume before entering. Set stop losses below the breakout level for risk management.
CADJPY daily 20EMA bounceSimple idea here, CADJPY is testing the daily 20EMA (overlayed on this 4H chart) and recently broke above the monthly 20EMA (overlayed)... if price reclaims the daily 10EMA (overlayer) could be a nice move up.
Very simple trade, tight SL if entering.

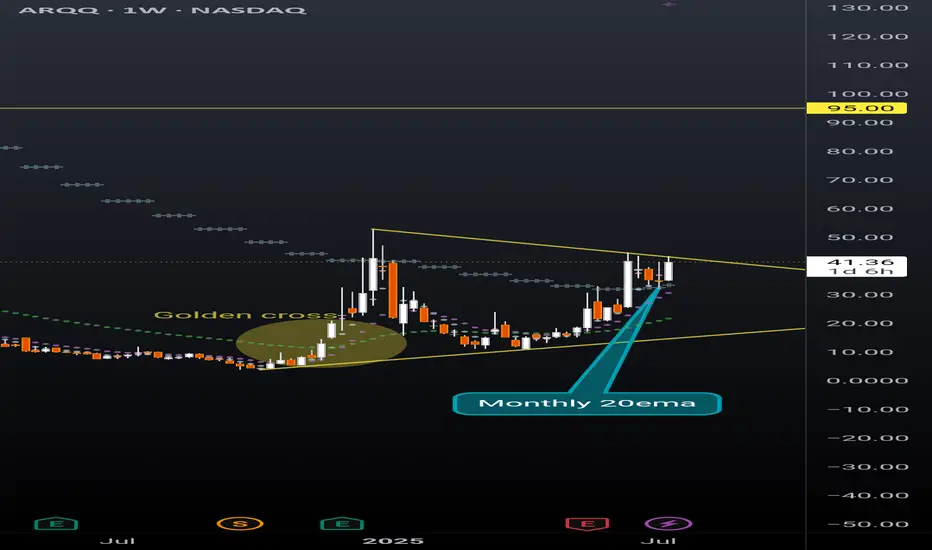
ARQQ weekly pennantBeautiful weekly pennant on ARQQ weekly timeframe. This chart is coiling nicely for a continuation. Still early in the process of reaching breakout but given the recent momentum in this sector a premature break to the upside can happen at any moment.
The ticker is currently sitting above the monthly 20ema (overlayed on this weekly chart), and just had a strong bounce off the daily 20ema (overlayed on this weekly chart). Golden cross is also highlighted that occurred in December 2024 with the daily 50ema retracing back to the daily 200ema and then continuing the uptrend earlier this spring.
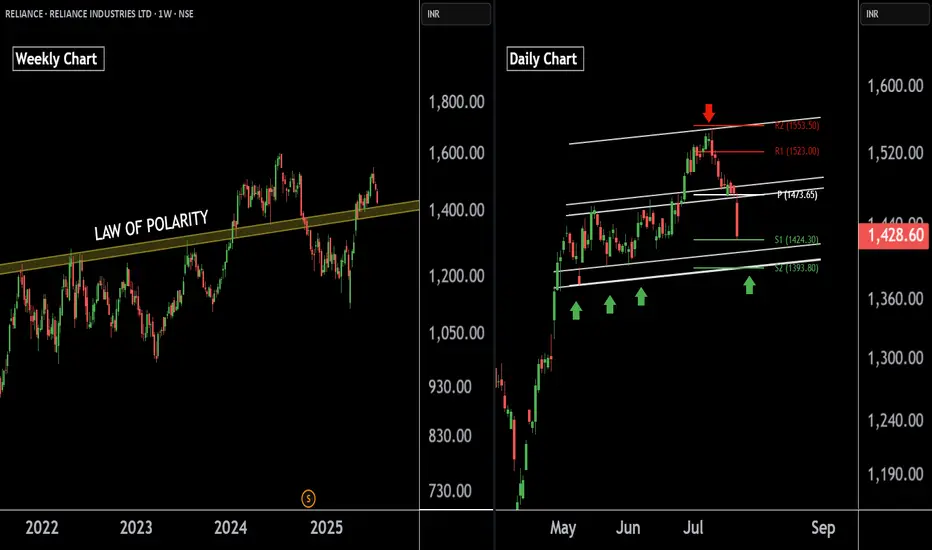
Reliance Industries — Preparing for the Next Bullish Leg !!There are two charts of Reliance Industries — one on the weekly timeframe and the other on the daily timeframe.
On the weekly timeframe:
Reliance industries is trading near (LOP), with a key support zone in the range of 1385–1400.
On the daily timeframe:
Reliance industries is moving in well defined parallel channel with support zone near at 1400-1410.the stock is also taking support at pivot levels S1 and S2, positioned between 1393 and 1422 levels.
If this level is sustain then we may see higher prices in Reliance industries.
Thank You !!
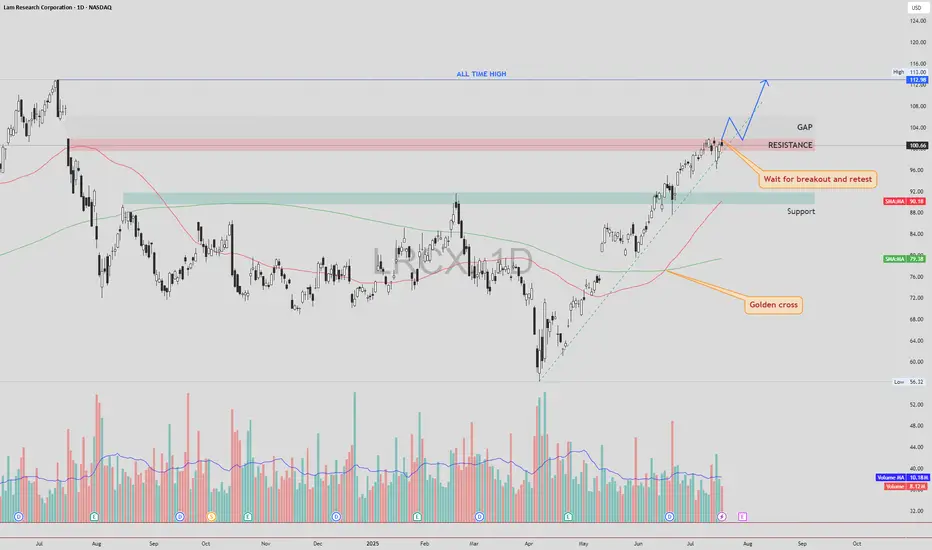
LRCX – Gap Fill First, Then Retest and Potential Move to ATHLRCX NASDAQ:LRCX is currently trading just below a key resistance zone, supported by strong bullish momentum and a confirmed Golden Cross formation.
🔍 Technical Scenario
There is a high probability that price may fill the gap above without retesting the current resistance. After the gap is filled, we could see a pullback to retest the previously untouched resistance zone (now acting as support).
If this retest is successful and holds, the structure may support a continuation move toward the All-Time High (ATH) zone.
📌 Trade Plan
Entry: Avoid chasing the breakout candle. Wait for a gap fill, followed by a clean retest of the broken resistance zone. Enter on confirmation of support holding.
Stop Loss: Place SL just below the retest zone or under the most recent higher low (structure-based stop).
Target 1: Gap fill completion
Target 2 : All-Time High (ATH), if retest confirms
⚠️ Risk Management
The gap-fill rally without retest can be volatile. Patience is key — let the price come back and confirm the breakout zone as new support.
As always, DYOR and manage your position sizing based on your risk profile.
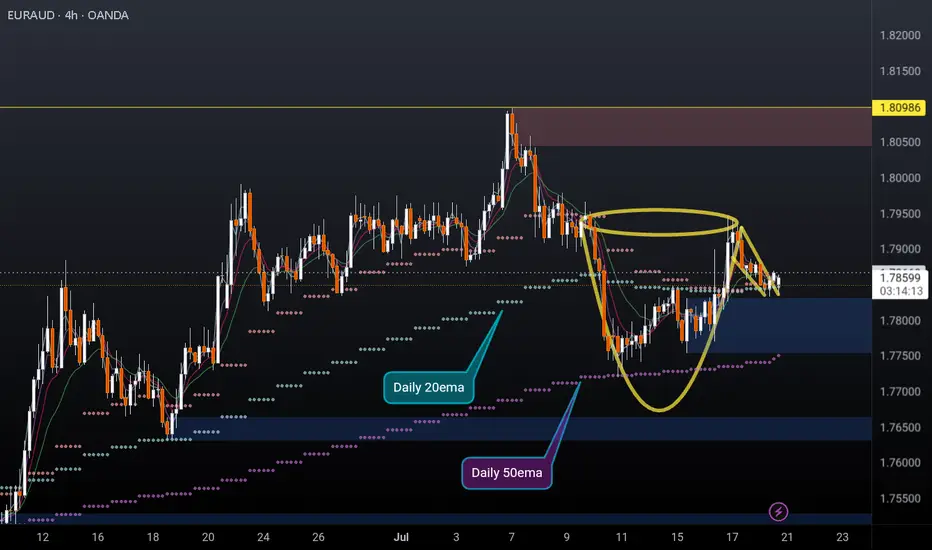
EURAUD 4H cup and handleEURAUD 4H cup and handle formed and possibly breaking out to the upside. Price recently found support off the daily 50ema (overlayed on this 4h chart) and is holding above the daily 10 & 20EMAs (overlayed).
I'm a cat not a financial advisor.
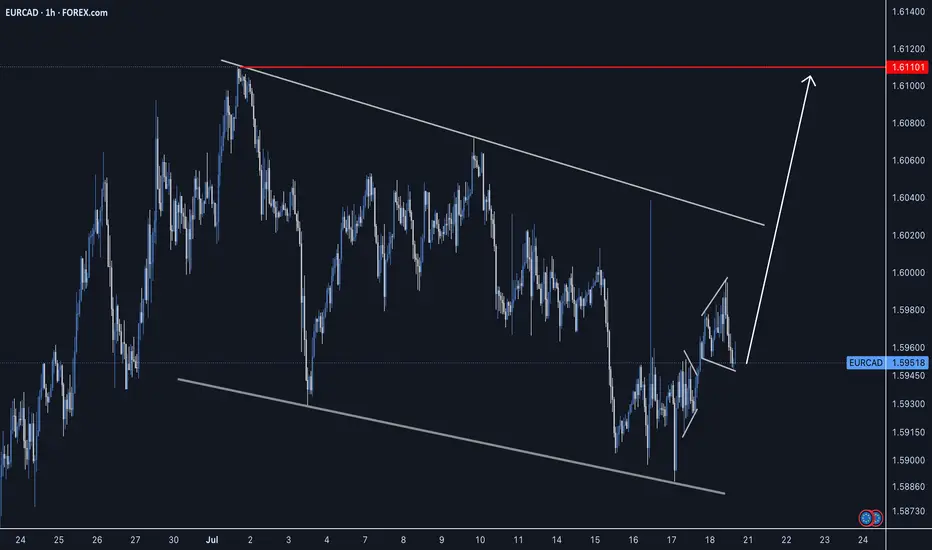
EURCAD - Long Setup - Impulse, Correction, ImpulsePrice action has been setting up for the next impulse phase as we can the bullish continuation is completing to indicate price has further growth. Looking for a long entry this upcoming week.
Good Luck
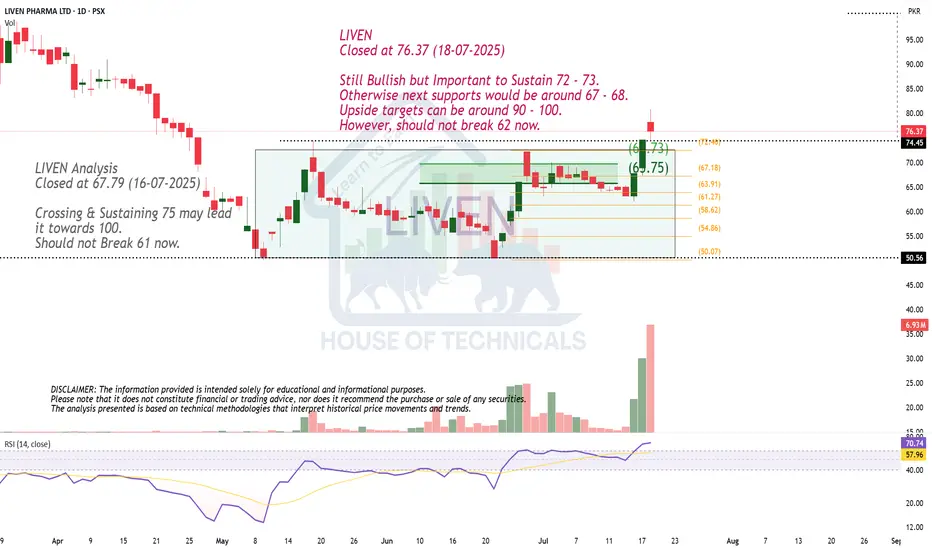
Still Bullish but ..LIVEN
Closed at 76.37 (18-07-2025)
Still Bullish but Important to Sustain 72 - 73.
Otherwise next supports would be around 67 - 68.
Upside targets can be around 90 - 100.
However, should not break 62 now.
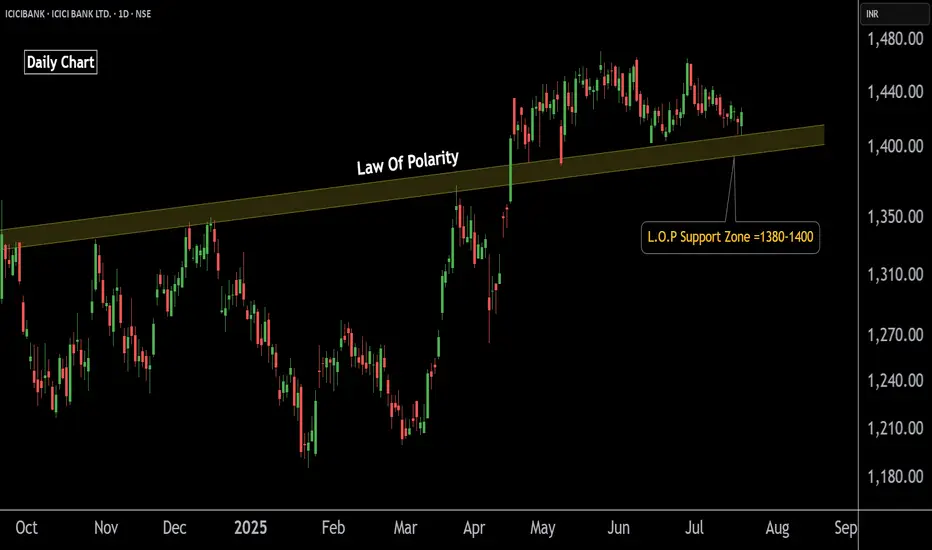
ICICI Bank Poised for Upside – Buy OpportunityThis is the daily chart of ICICIBANK.
ICICIBANK having a good law of polarity at 1380-1400 level .
If this level is sustain then we may see higher prices in ICICIBANK.
Thank You !!
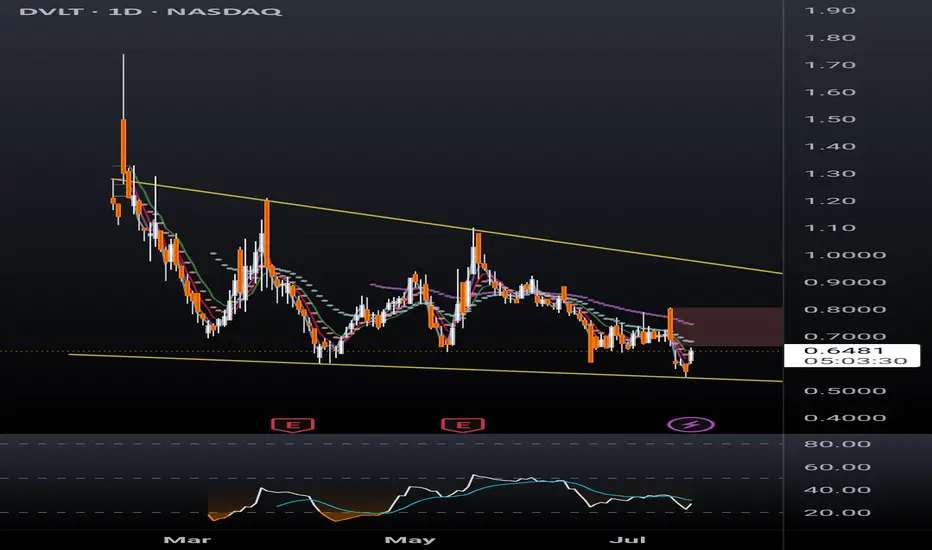
DVLT falling wedge, TP $1+DVLT a relatively new ticker is already drawing a lot of attention. Up 13% today after hitting new all time low yesterday, sure to catch a lot of eyes from retail investors. With recent news releases such as a licensing agreement with IBM, a lawsuit against naked short selling, and US patent allowances, target prices have been announced ranging from $3 to $11/share.
Disclaimer, this ticker is PRONE TO HEAVY DILUTION, however in order to remain listed on NASDAQ the SP will have to hit $1 and remain there. This being the case, the company must have something in the books to break upward out of this falling wedge and give shareholders a reason to stay with the company long term.
I'm just a cat not a financial advisor.
TRON TRX Eying New ATH📈 After 6 months of sideways accumulation, CRYPTOCAP:TRX is finally picking up momentum. A weekly close above $0.317 could trigger acceleration toward the next targets at $0.50–$0.60 🚀

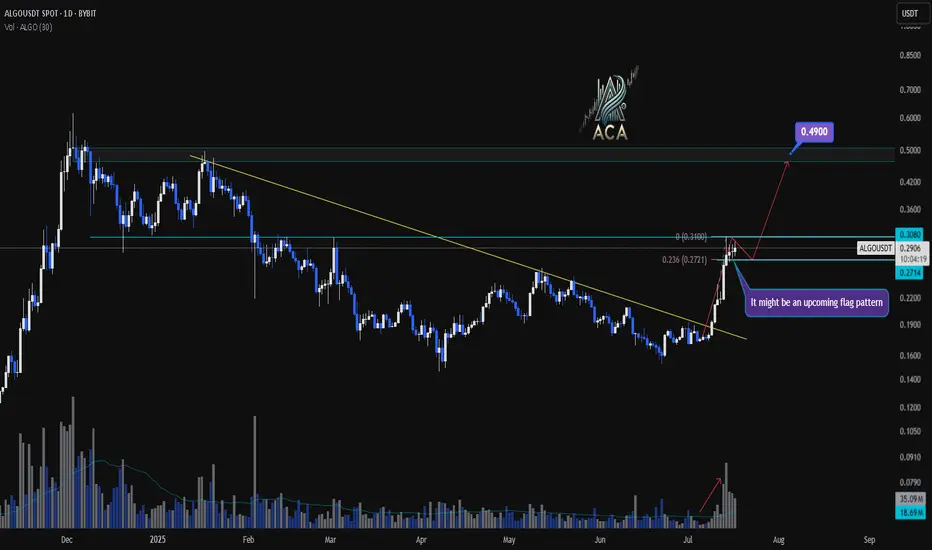
ALGOUSDT Daily Chart Analysis | Continuational patternsALGOUSDT Daily Chart Analysis | Momentum Picks Up on Higher Timeframe
🔍 Let’s break down the latest ALGO/USDT daily chart, highlighting a shift in market structure and key bullish signals.
⏳ Daily Overview
A decisive breakout above the long-standing descending trendline has flipped the narrative for ALGOUSDT. Increased volume during the breakout points to robust bullish momentum, suggesting buyers are regaining control at this multi-month inflection point.
🔔 Flag Pattern & Chart Structure
- Bullish flag pattern is emerging after the recent breakout, as price consolidates in a tight range—a classic continuation formation.
- Former trendline resistance is now acting as support, confirming a notable shift on the higher timeframe.
📐 Fibonacci & Target Levels
- The 0.236 Fibonacci retracement at $0.2771 is providing immediate support, with price consolidating above this anchor level.
- Upside targets:
- First resistance at $0.3080, which aligns with horizontal supply and previous pivot highs.
- If the flag pattern resolves upward, the next Fibonacci extension points to $0.4900, marking a significant confluence and potential for further gains.
📊 Key Highlights
- Strong daily candle and surging volume confirm momentum shift.
- Watch the developing flag pattern for breakout confirmation.
- Major trendline break on the daily signals structural reversal.
- $0.3080 is the immediate target; $0.4900 is the extended objective from the flag/Fibonacci alignment.
🚨 Conclusion
ALGOUSDT is setting up a compelling bullish scenario—keep a close eye on price behavior at the flag and $0.3080 level. A breakout may trigger the next impulsive move toward $0.4900.
MARA Is Waking Up And Looks Promising For The Crypto MarketMARA Is Waking Up And Looks Promising For The Crypto Market, as it can send the price even higher this year from a technical and Elliott wave perspective.
Marathon Digital Holdings with ticker MARA nicely and sharply recovered away from the strong support after a completed projected higher degree abc correction in wave B/2. So, similar as Crypto market, even MARA can be forming a bullish setup with waves »i« and »ii« that can soon extend the rally within wave »iii« of a five-wave bullish cycle within higher degree wave C or 3, especially if breaks above 21 first bullish evidence level. It could be easily supportive for the Crypto market if we consider a positive correlation.

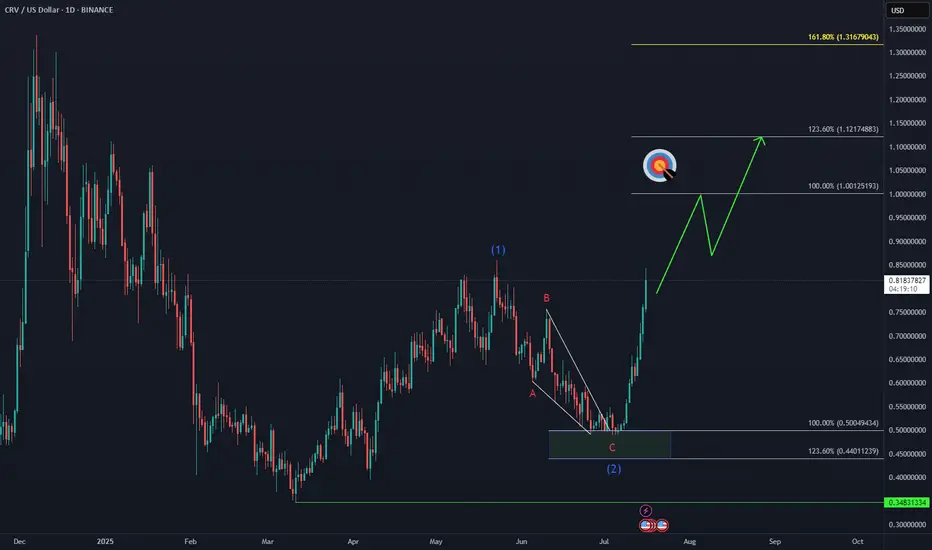
CRV Marching Toward Target📈 CRYPTO:CRVUSD is approaching a key breakout level, with bulls aiming to surpass the May peak and reach the $1.00 initial target.
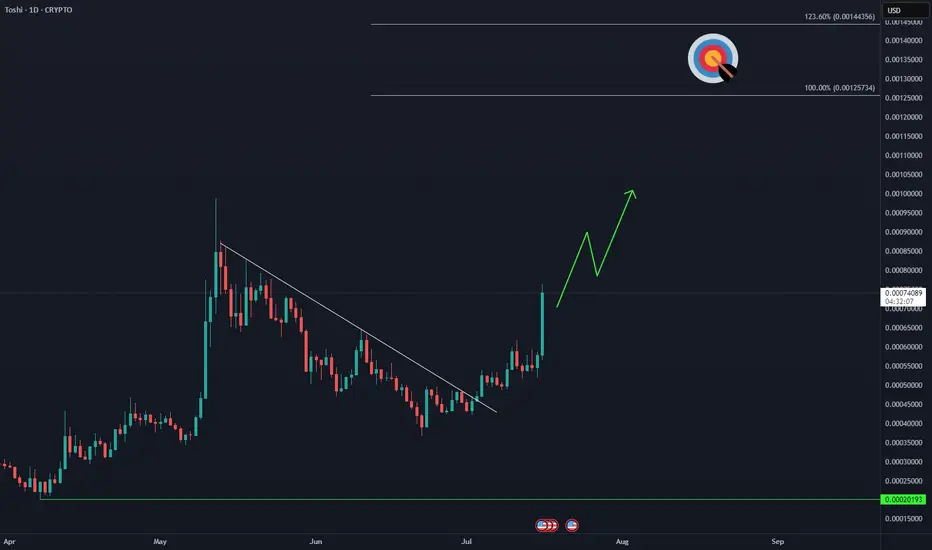
TOSHI Bulls on the Move🚀 COINBASE:TOSHIUSD is showing signs of acceleration, aiming to break above the May peak and extend toward the $0.0012 target zone.
DPRO falling wedge breakoutDPRO has broken out of a falling wedge on the weekly. Ticker will respond well to Trump's "Big Beautiful Bill" which includes over $30 billion for defense/military spending. The drone company is already making progress with US military projects and is setting up for a strong rally.

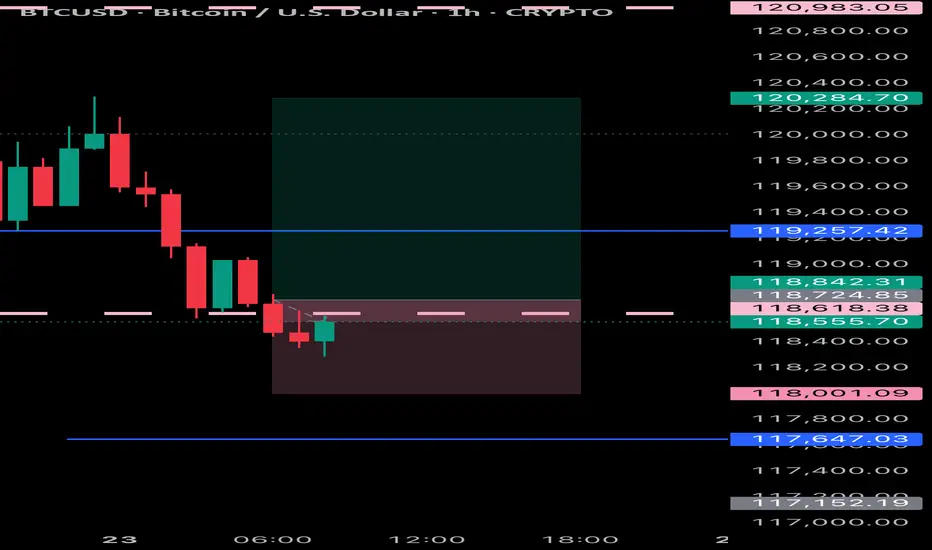
Bitcoin positive diversion to $131,000Using fibonacci retracements for price targets based off of positive divergences on the 15 min time frame and hourly time frame. I am utilizing 2 ioscilating indicators: RSI length is 36 with smma at 50 and the Chande momentum oscillator with a length of 24. My conservative estimate is $131,000 for a safe trade close. $132,400 exact area for pullback to $128,500?

XAUUSD Analysis : Gold's Bullish Comeback + Target📊 Chart Overview:
Gold has shown a technically strong structure on the 4-hour time frame, respecting multiple layers of support, while slowly shifting momentum in favor of buyers. What stands out most in this chart is the parabolic curve formation at the bottom, labeled the "Black Mind Curve Support" — a key psychological zone that has guided price action back to the upside.
Let’s walk through the key elements and why this current setup deserves your attention:
🧠 1. Black Mind Curve Support – Bullish Base Formation:
This curved structure at the bottom is no ordinary pattern. It reflects gradual accumulation and buyer dominance, often seen in textbook rounded bottom formations. The market printed multiple higher lows along this curve, suggesting a deliberate and patient entry by smart money.
Whenever price touched this curve, it found strong demand — a clear sign that the bulls are defending their territory.
🧱 2. Channel Support + SR Interchange – Historical Demand:
Zooming into the left side of the chart, you’ll notice how price dropped into a converging zone where a descending channel support intersected with a historical support/resistance (SR) level. This confluence created a high-probability buy zone — the very origin of the current bullish wave.
This channel breakout also represents a structural shift, marking the beginning of bullish control.
🔁 3. Major SR – Interchange Zone:
One of the most critical areas in this chart is the Major SR Interchange zone, where former resistance was broken and later retested as support. This is a classic support-resistance flip — the type of zone institutional traders watch closely.
This level currently acts as a launchpad for bulls, reinforcing bullish structure and offering low-risk long opportunities when respected.
⚔️ 4. Minor BOS (Break of Structure):
Recently, the price broke above a short-term lower high, indicating a minor bullish break of structure. This is confirmation that momentum has shifted in the short term. Such BOS events are powerful signals, especially when backed by curve support and SR flips.
This also paves the way for the price to push into the next liquidity pocket above.
🧭 5. Central Zone – 50% Equilibrium:
The horizontal line drawn around the $3,330 level marks the central 50% zone — the midpoint of this entire price range. This acts as a natural equilibrium zone where buyers and sellers usually fight for control.
Price is now trading above this zone, giving the upper hand to bulls. Holding above the 50% line increases the probability of continuation to higher resistance levels.
🧨 6. Target Area – "Next Reversal Zone":
Looking ahead, the $3,370 – $3,380 range is labeled as the Next Reversal Zone. This is where sellers previously stepped in and rejected price hard. However, if momentum remains strong and bulls can push price into this zone again, we might witness either:
A sharp pullback (if bearish reaction occurs), or
A major breakout above toward the $3,400 key resistance (if buyers overpower).
This is the zone to watch for either short-term profit taking or potential trend continuation setups.
📌 Key Technical Levels:
Immediate Support: $3,330 – $3,315 (Central + Retest Zone)
Major Support: $3,290 (Mind Curve Base)
Short-Term Resistance: $3,370 – $3,380 (Reversal/Reaction Zone)
Bullish Continuation Target: $3,400+
📒 Conclusion & Strategy Insight:
This chart presents a textbook bullish reversal setup with clean structural progression:
Price formed a rounded base
Broke out of previous range resistance
Retested multiple key SR zones
Now targeting liquidity above
The bulls are in control as long as the price remains above the curve and the major SR zone. A retracement into $3,330 could offer an ideal long entry, targeting the $3,370–$3,380 zone with tight risk.
✅ Suggested Trading Approach:
Buy Opportunities: On pullbacks toward $3,330–$3,315 with confirmation
Sell Watch: Near $3,375–$3,380 if bearish divergence or strong rejection appears
Invalidation: Break and close below $3,290 curve support
🧠 Final Thoughts:
Gold continues to build a strong bullish base. The parabolic nature of the support curve suggests rising demand. As long as support holds, the bulls may take price to fresh highs in the coming days.
Keep an eye on how price behaves around the Next Reversal Zone — that will reveal whether this bullish rally is ready for a breakout or a cooldown.

KALV FDA approval rallyKALV received FDA approval this week for a new drug, has $220mln in cash, and just bounced off the daily 21EMA (overlayed on this 4H chart).
Recently rejected off the monthly 100ema two times (overlayed on this 4H chart). Breakout beyond the monthly 100ema and first target is $20. Numerous price target increases, most notably, one at $27 and another increased from $32 to $40.

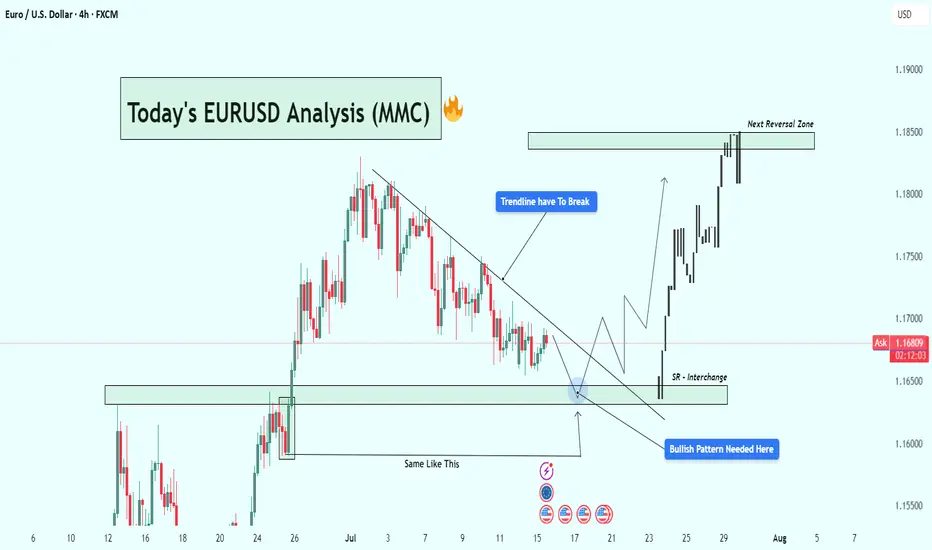
EURUSD Analysis : Eyes on Bullish Breakout Setup + Target🧭 Current Market Context:
The EURUSD pair is currently trading near 1.16765 on the 4H timeframe, displaying classic accumulation behavior at a key Support-Resistance Interchange Zone (SR Flip). After an extended bearish correction from the previous swing high, price has started compressing in a descending structure underneath a well-respected trendline. This tightening range near a historic support zone suggests that a major breakout could be on the horizon.
🧠 Technical Confluences:
🔹 1. Descending Trendline - Bearish Control Line:
The trendline drawn from the July highs has acted as a clear resistance line, rejecting multiple bullish attempts to break higher.
Price has failed to close above it on the 4H chart, showing sellers are still in control—but momentum is fading.
A breakout of this line is a crucial confirmation of buyer strength returning.
🔹 2. SR Flip Zone - Interchange Area:
This zone previously acted as resistance, capping the rally in June.
After price broke above it, the same area now acts as support, confirming its role as an SR flip zone—a textbook demand level.
Smart money often steps in at these interchange areas to accumulate long positions.
🔹 3. Re-accumulation Phase (Smart Money Behavior):
Market structure is showing a rounded bottom formation, hinting at possible absorption of sell-side liquidity.
Price action is compressing into the support zone, reducing volatility—a signal that a reversal or breakout is near.
The previous similar move ("Same Like This") from late June led to a strong bullish impulsive wave—this historical behavior adds confidence in the current bullish outlook.
🔹 4. Potential Bullish Pattern:
Price needs to develop a bullish reversal pattern (e.g., inverse head & shoulders, bullish engulfing, or a sweep of the low with rejection).
Only then will the setup be validated. This is not a blind buy zone, but a zone of interest for high-probability longs if price confirms.
🧨 Trade Plan Scenarios:
✅ Scenario 1 - Confirmation Breakout:
Wait for a clean breakout above the descending trendline.
Enter on breakout + retest structure.
Target the next major reversal zone at 1.18500.
🐢 Scenario 2 - Early Long Entry:
Enter on bullish confirmation (engulfing, pin bar, etc.) at the SR Interchange zone.
Stop loss below the support box.
Ride early for better R:R if the breakout confirms.
❌ Invalidation:
A clean breakdown below 1.1600 with momentum will invalidate the bullish bias.
In that case, reevaluate based on new structure.
📊 Projected Path:
If the trendline breaks, expect a bullish rally toward the next major resistance zone (1.18500).
That zone has historically acted as a major reversal and profit-taking level for bulls, and we expect price to react again if tested.
🔍 Macro View (Optional Insight):
USD may show weakness due to macro data (CPI/FED talks), helping EURUSD lift.
Eurozone data stability could further fuel demand for EUR.
📌 Final Thoughts:
This EURUSD setup is forming at a high-value area, backed by technical structure, historical behavior, and smart money positioning. If the price reacts positively from this zone and breaks the descending trendline, it could trigger a bullish leg toward 1.18500, offering a rewarding risk-to-reward opportunity for both swing and short-term traders.
Stay patient. Let the market confirm the direction before execution. 📈
SUIUSDT Weekly Chart Analysis | Breakout Confirmed!SUIUSDT Weekly Chart Analysis | Breakout Confirmed, Massive Liquidity at $4–$4.20
🔍 Let’s dive into the SUI/USDT weekly chart after a decisive breakout from the symmetrical triangle, highlighting the critical liquidity zone and what it means for price action.
⏳ Weekly Overview
SUI has broken out of its multi-month triangle pattern following a textbook fakeout, with volume dynamics confirming renewed bullish momentum. The breakout is now awaiting daily candle confirmation for full validation.
🔺 Bullish Breakout & Key Liquidity Zone
A major liquidity cluster sits between $4.00 and $4.20, with more than $140 billion in liquidity concentrated in this range. This zone is crucial for several reasons:
- It represents a significant area where large buy and sell orders are stacked, likely leading to heightened volatility as price approaches or breaks through.
- Clearing this liquidity could unlock rapid moves toward the next upside targets at $7.03 and $9.50, as shown on the chart.
📊 Key Highlights
- Symmetrical triangle resolved with a bullish breakout, confirmed by increasing volume.
- The $4.00–$4.20 range holds over $140B in liquidity, making it a pivotal battleground for bulls and bears.
- Daily candle confirmation remains essential for trend validation.
- SUI ecosystem has reached a new all-time high in DeFi TVL, adding fundamental strength to the bullish case.
🚨 Conclusion
The breakout above the triangle, combined with surging volume and a record DeFi TVL, sets the stage for a potential rally. Watch the $4.00–$4.20 liquidity zone closely—how price interacts with this level could determine the speed and magnitude of the next move. Stay alert for daily confirmation and be prepared for volatility as SUI tests this high-stakes region.
#SUI #CryptoAnalysis #TradingView #Altcoins #ACA
