USD/ZAR - Tentative Hello
with the Feds rate decision in play we see that the Rand is getting stronger. Going down to 4hr Support level.
One of two things could happen here
1. The rand could reach up again to close the future value Gaps noted on the 1hr timeframe. This will suggest that the dollar will recover. We will have to monitor the movement in this zone.
2. We could see a sharper movement downwards breaking through the 4hr support zone. This will give us good momentum for sell positions and we will move into the 18.0000 zone.
At this current moment my bias is more centered around bullish momentum as noted on the 4hr TF we had strong bearish momentum.
Remember price must correctly deliver both sides before we reach for any liquidity
Stay Safe
Bullishsetup

MGNI points out to higher valuationMGNI beat EPS and REV in a very competitive industry, pointing out that its market price is undervalued by the crowd.
The Co shows decent profitability and double-digit revenue growth. Moreover, the Co is committed to pro-active cost management - it slashes 6% of the workforce. it sounds not good, but this shows high adaption commitments.
Size your positions according to your risk tolerance.

USD CAD - Long Trade Setup in 1 Hr TF.OANDA:USDCAD USD CAD - Long Trade Setup in 1 Hr TF. Long Trade Setup Support & Resistance Level.

GODREJPROP Daily TF Sellers Trapped
GodrejProp on daily chart gave fake breakdown 2 times of major support to attract sellers.. Now after getting trapped, all their stoplosses will get hit as soon as it gives a breakout of previous swing high or W pattern neckline. Taking it 1700 levels in coming time. It can be a good option to invest for 3-4 months.

EURUSD Is Making A Higher Degree CorrectionEURUSD reversed sharply to the downside in the last few weeks as USD turns up across the board after new global inflation worries. So far we can see a nice and strong decline on the EURUSD, which for now is still in the making and can be even deeper in three legs (A)-(B)-(C). We still think that pair can complete a higher degree of correction around 38,2% Fibonacci retracement and 1.0480 level or even deeper around 50%-61,8% Fibo and 1.03 - 1.02 support zone.


Silver To skyrocketHey Guys,
Banks are realizing bonds arent the safety they thought and need to diversify has shown in a big way with the yields decline, metals bulling and DXY rising. I expect silver to possibly have another leg down with any major panic we might have but once we are past the panic gold and silver will bull just like 2009-2012 and the 80s. Above is the larger picture of silver targets to keep in mind.

BTC weekly outlookIf price should break the 25300 level price will continue towards 33000 point of interest

I'm bullish on Bitcoin I'm expecting bullish price action untill 25k.This is based on my own logics like i did in last 3 years.

BTC - Whose Selling? Whose Buying?Analysis:
- Trend Line
- Fibonacci Retracement
- Support & Resistance
Opinion:
This pullback should create a higher low which will then lead to a higher high...
Accumulating BTC under $20k is not a bad idea as the bull run will commence in the next 1-2 years!

BTCUSDTBullish run levels in 2023
We are waiting for long setups on the 4H time frame at $16,000 and $12,000.

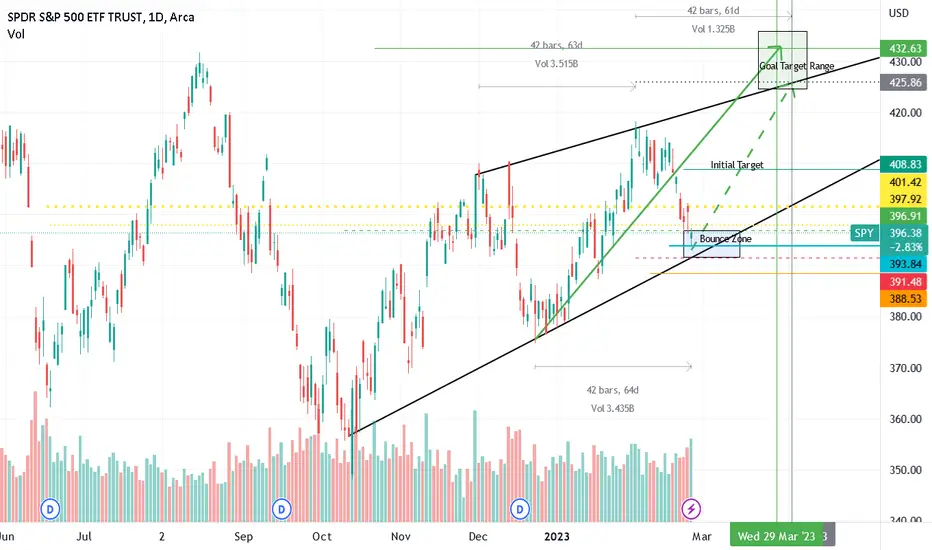
Its More Straight-Forward Than You ThinkThis is an Update to my previous SPY idea - same target/time to target, just more simplified. After the last 2 weeks there is a lot of bearish sentiment but its really just finding support at wave 4 of a leading diagonal.
The initial target is 408 in the next week or 2, and then goal target is 425-432 by late March-Early April.
The symmetry in the waves indicates this is a leading diagonal (or bearish wolfe wave that is about to complete the final wave). Either way its still bullish near-term. After 425-432 there will be significant downside risk, but for now expect a nice rally through March.
We are in the bounce zone, there is still risk to 388-391 early this week, but if any of the following occur we won't see the 388-391:
- retest and hold 393
- close above 397.92
- Intraday breach of 401.42 (above 401.42 it will turn into explosive upside)
BAJAJAUTO bullish move possible..
BAJAJAUTO bullish move continuation possible..
Multiple Confluence Points:
1. Demand Zone Reversal
2. Channel Continuation
3. Double Bottom Breakout & Retest Done
4. Break of Market Structure (Trend Changed)

Solana Is Forming A Bullish SetupSolana with ticker SOLUSD made strong rise from the lows, which is first leg (A)/(1) of a minium three-wave recovery. So we are now tracking a corrective pullback in (B)/(2), which looks like an A-B-C flat correction that can find the support here in the 19-15 area. A bounce and recovery back above 27 region would be definitely indication that higher degree wave (C)/(3) is underway, at least towards 38 - 40 area for (C) or higher for wave (3). In case of deeper and more complex correction, keep in mind that we remain bullish as long as it's above 8 invalidation level.

SAIL Daily Chart Trend Continue
SAIL on daily chart is moving inside a bullish channel
Confluence Points:-
1. Touched lower channel & bounced.
2. Formed Double bottom pattern & breaked the mid point.

ETCUSD Is Moving Into A Support AreaETCUSD can be ready for more upside as market can be forming a new bullish setup formation based on Elliott wave theory.
Ethereum Classic with ticker ETCUSD made an impulsive five-wave recovery since December 19th of 2022, when we spotted a completed ending diagonal/wedge pattern within wave C of an A-B-C correction. A five-wave recovery indicates a change in the trend from Elliott wave perspective, so be aware of more upside in March.
We can see that price is currently nicely slowing down, making a three-wave (A)-(B)-(C) correction for wave 2 after we noticed a five-wave rally into wave 1 from the previous lows. So, keep an eye on strong support here around 19-17 area, from where we expect a bullish continuation above 25.10 while price is above 14.80 low. So as long this level is not breached we expect a new turn up.
I hope to see you in webinar today here on tradingview. Link can be find below.

HAL cup handle pattern breakout HAL was made a breakout of its cup handle pattern
Buy HAL at 2684
Target 2763 2815 2900 3000
Sl 2520

Descending Triangle + Bullish Divergence = ConfluenceHi All,
On the 4hr chart we see a CMF bullish divergence which could be an indication that Aragon is preparing to break out from it's descending triangle and head back up to retest the previous highs.
There's a good Risk Reward ratio even with a conservative stop loss, I'd usually have this tighter but we're seeing big volatility at the moment.
Feel free to leave feedback on the idea
Blockbullder.

$RIO long ⚠Let's see if this trendline and the fib retracement supports the price enough. ;) If you have any questions - feel free to use the comment section below. Good trades, folks!

long on USDJPYlooking at the weekly chart in the last few weeks we see a bullish reversal occuring, from a fundamental perspective JPY's economic is relatively weak compared to USD. I can envisage a pullback next week may enter a position next Wednsday TP 140.000


THE BULLS ARE BACK!! 2K PUSHIf we Look left we can see previous price action creating Lower highs and lower lows, but with most recent buyers/bulls entering the market at 1180 which ignited this bull run price is on now. We broke the downward trend that I believe was the retracement from Ethereums ATH. Most recent price broke above a key level @ 1675 (Daily & 4h confluence of this area), Price found new support at this level and failed to break back below this area. With that newly found support I believe that will give price the push it needs to make new Higher Highs and move up past the 1780 area. My overall Target area is 1985-2k. I made a little under 10k on the first push from 1180 to my TP @ 1490.

AUD/JPY: bullish setup to $95.40 JPYIn this analysis, I see a potential long position in AUD. What I believe that based in the fundamental news, Japan has some bad news that I will share you more later what I read. But I iwll focus on technical analysis here:
In Daily timeframe, we see a AUD so bullish that could to continue in this way to my forecast, what break out this bearish trend line and RSI in Daily look strenght that may have demand in AUD.
in H4 timeframe, AUD/JPY forming a bullish channel, what based in price action, look bullish and I'm very focus in this analysis here. And also, in H1 timeframe look bullish. We see an ABCD pattern formed and we could to see a potential upside. Also to know, in H4 timeframe the price it's resting the EMA 200 like support and watching the grey zone over the EMA 200 work as support too combining those analysis.
Now, I'm bearish in JPY as there're some bad news in the Bank of Japan that you must to read, but more later I will share that. And in some hours, we have our big event about Reserve Bank of Ausralia Interest Rate Decision what I hope that become bullish
That it's all!!! I enter in $91.27 JPY. Stop Loss in $90.04 JPY and take profit to $95.40 JPY
Good luck
