AUD/CAD: bullish market structureAustralian Dollar/Canadian Dollar has the potential change of trend that based on this analysis, we're in the smart point to buy. But we formed a Elliot Wave Cycle in this analysis. And analyzing the price action, we see a bullish candlestick in this timeframe.
In the RSI in H1 timeframe, I appreciate a bullish hide divergence formed and this mean that there's a curb in this trend that will make reversal. Applying market psychology, could to help you to identify this Elliot Wave pattern. What we have the change to get 155 pips in this trade.
This it's the Elliot Wave Cycle, and we're in the phase #4 in this correction before.
And applying this market psychology, we can to see a nice overview in this chart. What in H1 timeframe we can to put a buy order limit in $0.9060 CAD, and SL adjust to $0.9009 CAD. So, guys, this trade has a chance to to up. what depend how the candlestick behaviors during the next hours in the range of 8-16 hour, we can to take clue if that zone to buy place it's an accumulation in process to form and look after this range if AUD/CAD will climb .
Good Luck!!!
Bullishsetup

WEEKLY TIME FRAME - KM SUGAR MILLS LTD The Structure looks good to us, waiting for this instrument to correct and then give us these opportunities as shown on this instrument (Price Chart).
Note: Its my view only and its for educational purpose only. Only who has got knowledge about this strategy, will understand what to be done on this setup. its purely based on my technical analysis only (strategies). we don't focus on the short term moves, we look for only for Bullish or Bearish Impulsive moves on the setups after a good price action is formed as per the strategy. we never get into corrective moves. because it will test our patience and also it will be a bullish or a bearish trap. and try trade the big moves.
we do not get into bullish or bearish traps. We anticipate and get into only big bullish or bearish moves (Impulsive Moves). Just ride the Bullish or Bearish Impulsive Move. Learn & Know the Complete Market Cycle.
Buy Low and Sell High Concept. Buy at Cheaper Price and Sell at Expensive Price.
Keep it simple, keep it Unique.
please keep your comments useful & respectful.
Thanks for your support....
Tradelikemee Academy

Ethereum: Possible pull back to watch!!!In the past analysis, we see that the price not only move up, this was because as CPI data was bearish for USD that this week I don't be pending in the economic calendar in Forex market, if I do it, I can to adjust my analysis very well. But we only see a one trade for the specific movement in the price. Also, if I would gotten draw the bullish channel flag on December, 12, 2022, I would identify this opportunity to change to long. But as based my technical analysis, it's seem bearish, but in economic calendar spoke us the right direction for the global financial market.
But now, we see an interesting trade in Ethereum to long position here, and also another bearish perspective to take in note in all consideration for us. We see a pull back in formation in Ethereum price, what this mean if Ethereum make any bullish signal in the price action, we can to put long position following the green arrow model in this chart, but in another hand, if we see a market trap like the red arrow model in this chart, we can to see a little up, and then a small consolidation in the previous higher in $1,344 USD approx. we can to see a possible bearish signal and a strong volatile to forming a liquidation of long position. As I learned in the previous analysis in Ethereum that my analysis was in short, I was good and this analysis could to happen, but goes to short liquidation in this case. what it's very important to be prepared in both scenario
In Daily timeframe, we could to get a clear clue that if this candlestick closed up with any bearish rejection, we could to see a drop incoming days to watch. What it's very important to recall that we would need to be prepared for both scenario: bullish and bearish.
Now, I will hope if in H1 timeframe we see a bullish signal in Ethereum price in what the price develop the formation, by the contrary, I will still hope if bearish scenario may to occur in the next days.
Good luck!!!

EURGBP again - Trade SetupHello Dear fellows, how are you doing , yesterday we stopped out in Sell trade , it was a just quick trade setup i knew it can go up but for some reason i went with with Short side , anyways today i will be looking this pair for Buying for reasonable target , today's Stoploss slightly bigger than usually i use . so take risk accordingly .
I will keep updating here whether the idea is performing or not or positions adding Etc .
Take Affordable Risk . this is not your Last Trade keep in mind !
Best of Luck !

EUR/AUD: smart bought in the reaction points!!!Euro/Australian Dollar look bullish from this point that I identify a possible nice opportunity to get so much pips in this only trade.
As first, in Daily timeframe EUR/AUD forming a bullish channel perspective that could to continue climb until $1.5920 AUD. Also, the candlestick it's appear that still bullish.
In H4 timeframe we are in the smart zone in the $1.5551 AUD that price it's just make reaction in this zone to find down new buyers to long position. And also, I make some correlations that I draw a order block and a diagonal point line that work like support and maybe, if in H4 timeframe closed up with a bullish signal. We can to see a strength in this par.
And finally, we're in H2 timeframe here in this analysis, and we see that that EUR look strength than Aussie. So guys, we see a nice opportunity here to bought!!
Good luck!!!

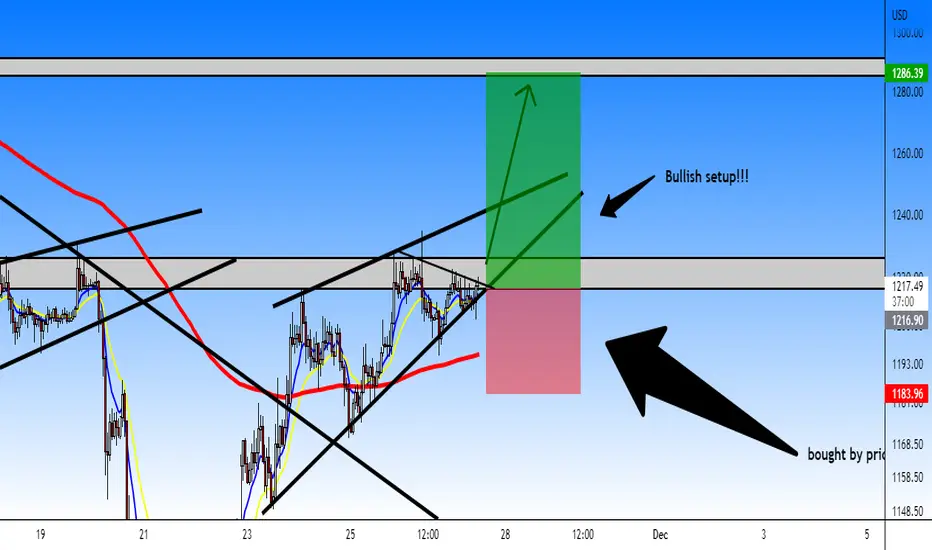
Ethereum: bullish market strucutreEthereum doesn't make a drop as it's supposed what I had counted it. But right now, the price action may to speak us that the price in H1 timeframe it's moving to the upside and maybe, bulls appear that want to go to carry up the price to $1,286 USD. I closed up manually and I decide to long Ethereum now from this point!!!
It's appear that Ethereum doesn't want to drop as may to continue up toward $1,286 USD and then, we would to see if the price could to forming a bearish rejection and check out in timeframes if we see any chartist pattern.
Good luck in this long position in Ethereum price!!!
GBP/CAD: Review!!!In this review. I made an analysis to first in long position that I was in the right direction, but as I make a wrong to closed up a long position and then shorting GBP/CAD that I commented a possible bearish rising wedge in formation. As I loss in this trade 6.56% and the only earns was small like 1.16%. This will turn in 5.41% in loss hold in this trade
But it's the same case of my past analysis in EUR/USD and USD/CAD. The only when I was in long, I don't supposed to closed up this long position when I was in good believing after that this it's a potential bearish rising wedge. In my case, for this kind of analysis, it's necessary to work a little more and always I will use price action o read better this analysis. This long position that I took in Monday, this could be a excellent opportunity. But I see that I will need to be a little more patience to hit my target, read the price action better and what said in timeframes and then don't entry in panic as sometimes the trend only cheat us.
And I believe that this kind of analysis, to add here, when it's talk about a change of trend, it's will being a good option that a change of trend need to make a break up and fall in the market structure to confirm it.
APOLLOHOSPITAL HAS GIVEN A BREAKOUT Apollo hospital has given a very strong breakout, the setup is also looks very good. In this trade 1:1,2 Risk Reward easily achievable.

GBP/JPY: Bullish setupGreat Britain Pound/Yen Japanese look bullish, what we can to get this opportunity to the upside direction, what I look that GBP/JPY still bullish form this point over $168.12 JPY. But if the price action still bullish in the next up confirmation ,we're very sure that GBP will continue strengthen.
So, this it's the idea that I decide to trade after GBP/CAD and EUR/CAD rose up and I was shorting them. But I'm sure that GBP/JPY will going to strengthen. But whatever, I will check what I fell in those trades GBP/CAD and EUR/CAD later of those review and how I can to work this trade a little more.
So, I enter in the midday that I'm in long from $168.51 JPY, and I update my Stop Loss now to $167.63 JPY and take profit toward $170.00 JPY.
Good luck in this long position!!!

GBP/JPY: Long positionIn this analysis,I see potential long in GBP/JPY.
I buy in market price I this dip and SL to $167.84 JPY
Good luck in this long position!!!

GBP/CAD: Update!!!In this update, as I made an analysis in Day Trading in GBP/CAD. i said that I enter in $1.5875 CAD and the moment, GBP/CAD it's climb the price as I'm in profit with 27 pips approx.
But well, as I mentioned in Daily chart, we have 2 perspective to watch out in this timeframe the following levels: $1.6000 CAD*** and $1.6050 CAD
I mark 3 little star after CAD to take in note this level in case that doesn't make this break-out, we would closed this position manually with profits in hands. But now, I made a little update that GBP/CAD has a lot chance to reach $1.6050 CAD as the trend still bullish, I don't believe that goes bearish. We can to forming a possible bearish rising wedge by type of charts that I see and I first watching the level $1.5977 that I mark this horizontal line in the previous high. For that, I will watching this level, as we can to see a possible take profit until $1.60 CAD and then make this significantly large drop from this price by the formation of this chartist pattern, be always analyze the price action ever.
At the moment, we're in long and I'm profit!!!
Good luck if you enter in my indications
I will trade until this Wednesday, as after of Thursday, I will closed up all Forex position manually at 5:00 pm independent the status of my trade as I will celebrate Thanksgiving Day and Black Friday for me to share with my family. Unless cryptocurrency position that I'm shorting Bitcoin and XRP since past weeks. My target in $13,500 USD for Bitcoin and $0.25 cents for XRP

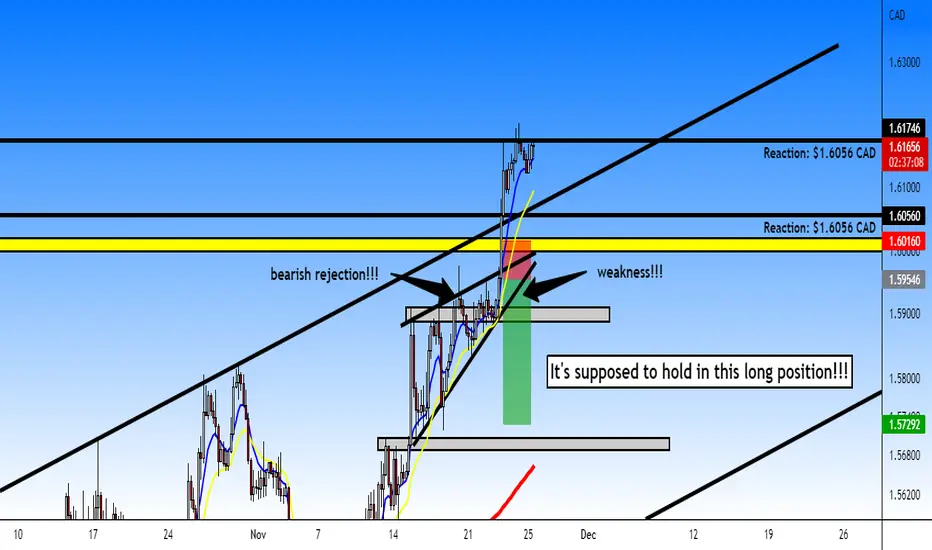
GBP/CAD: Daily overview!!!Great Britain Pound/Canadian Dollar was in the upside and now we see a potential bullish setup that GBP/CAD do.
This it's the Daily overview to update here as my analysis to recall that we're in the bullish line. But with a clear perspective that could to be a top until $1.60 CAD.
So, we have 2 perspective to watch:
1. $1.6000 CAD
2. $1.6050 CAD (into this reaction to watch out)
One of these perspective will need to watch out if in case that GBP/CAD break the $1.60 CAD. we can to see a possible perspective to hit $1.6050 CAD.
I hope that this Daily analysis support you!!!

GBP/CAD:Long positionWe see a good opportunity to long GBPCAD u til $1.60. I put a buy order limit in $1.5875 CAD and Stop Loss to $1.5816 CAD.
Good luck!!!
We have a good opportunity but will e so shortly as market reversal it's possible around $1.60

EUR/GBP: ReviewIn this review from November 9 2022, Euro/Sterling Pound was a perfect analysis that I found out when I made this analysis in the past 2 weeks and I was lead by fundamental news that Euro was bullish by fundamental news that I will show you here to recall why Euro was bullish.
Fundamental News to recall it:
1) Euro and Sterling Pound rose against he safe haven dollar on November, 7, 2022, supported by a risk on sentiment across market as investors digested positive eurozone data and looked to cash in on the strength of the US Dollar
2) A survey showed on November, 7, 2022 that investors morale in the euro zone improved in November, and reflecting hopes that recent warmer temperatures and falling energy prices will prevent as rationing on the continent this winter
3) Germany should hike taxes on rich to finance relief packages, adviser say-report
4) Germany's economic council less pessimistic than government on looming recession-source
5) German economic will not face as severe recession next year appointment optimistic economic policy that growth 1.7% compared 1.4% based on unexpected third-quarter growth despite inflation and energy supply concerns.
6) Inflation expected to hit 8% this year, but advisers said that inflation's effect on consumer's purchasing power what exceptionally strong price increase are on the way in 2023, a reason for the looming recession.
7) A German newspaper reported that the advisers will recommend the government raise taxes on the wealthy to help finance the multi-billion-euro relief packages it has agreed to fight the energy crisis.
8) Uk Businesses fear gloomy Christmas as cost of living soars.
9) Dollar slips as German bund yields strengthen Euro
10) Marc Chandler (chief market speculation at Bannockburn Global Forex) told in November, 9, 2022 that a steady climb in German bond yields weakened the Dollar on expectations of further European Central Bank tightening, which cut the spread with Treasury yields.
11) Marc Chandler believe that European Central Bank it's about more aggressiveness than Federal Reserve do, focusing in the movement in two year German bunds. He believe that it's not much difference that monetary and fiscal policy it's playing down in the U.S. election than European Central Bank trying to tightening the European monetary policy and tightening in Euro currency.
12) Germany must ask high earners to help with energy relief-economic council
13) A panel of economic advisers said that Germany must tighten its energy-relief measures in the face of soaring inflation, ensuring only households and businesses that need help are on the receiving end while asking high earners.
14) Monica Schitzer (Economist advisers) said that she look an expectations that Germany's pointing out high earners that benefit from a fuel tax cut and a planned gas price brake. She added at a news conference that "increases government debt will likely more than necessary as well as stoking inflation
15) Christian Lindner (First Ministry German Finance) said that government would carefully to examine the panel's report, but he rejected calls for higher taxes.
16) Germany to examine revised European Union debt rules closely
17) Germany welcomes the fact that the European Commission has proposd its changes to EU fiscal rules on debt.
18) ECB Nagel calls for letting long-term rates rise too.
19) European Central Bank should led long-term borrowing costs rise too, as it increases short-term interest rates to fight runaway prices in the euro zone.
20) ECB has been raising its policy rates at record speed but it is still buying bond to replenish portfolio, which has a dampening impact on long-term bond yields.
So, fundamentally Euro was in the morale up and optimistic by fundamental news that every news may to support Euro/Pound into a long term to plan to bought bonds yields. That it's a key fact that Euro can to change the trend in medium term as a signal.
So, this was a perfect trade without observations as I'm very lead by fundamental news. So, in this trade from past 2 weeks. I got 8.96% in profit that I end this in the past 2 weeks. But was a perfect trade that I found out.

GBP/CAD: Review!!!What I think about this analysis, was very well. Now, as this analysis that I bought was in the smart zone, I see that was a very good analsis buying GBP/CAD in $1.5892 CAD. That I remember that I made this analysis in H4 timeframe.
But I thinking that GBP/CAD forming a bullish channel that right now, we can to see any sell from this point like $1.60 CAD to take in note.
And also, in Daily timeframe we're forming this bullish channel, but I want to share my perspective point that GBP/CAD it's ready to down, and we can to udpate this line to monitoring the exact point what GBP/CAD will stop this buy off.
As I closed up manually in this trade from Friday that I got 7.04% earned!!! So this trade was very well!!!
But this trade look interesting to short!!! Now as I look in H1 timeframe we can to forming a market trap in H1 timeframe that we can to see a market trap. but some carefully in the next week, as I'm interesting to short
Now, calculating what I hold up in month ROI that I have 16.57% and plus 7.04%. So I got 23.61% in ROI. This mean that I overpass 20% monthly ROI.
So, this week as I have EUR/USD and USD/CAD to review a little more, we can to work this analysis to become more patience when I knew that I was a clear perspective. with the same of GBP/CAD that I see a possible short position in GBP/CAD for the next week.
Good Day!!!!
So guys, talking about review, every review of my analysis it's show me some things that I can to improve by my evaluation that I do in my trades by real account to test my skills in trading. During this year, I work too much in Forex market the style how I analyze each par. Reviews will help you to get an evaluation to measure your progress in your Day Trading. Apart of cryptocurrencies, as I like more to make a swing trading and position trading to hold those position by long term.
For tomorrow, I will make the last EUR/GBP analysis of the past week to know my review and how I did it this trade.

USD/CAD: Review!!!U.S. Dollar/Canadian Dollar was a good trade that at least for me I catch the target profit fix in $1.3400 CAD exacly. What I was in 2 trades to long position when I knew very good that USD/CAD climbed. And also ,I had a loss of -3.58% in my first trade that I enter and hit my Stop Loss very bad, also I put all my update and analysis of USD/CAD in this week. But my last 2 trades I had a earn of 15.52%, what I recover part of my loss and also my extra earns that only my real earned was 11.95%.
But I want to share you some observations that I note that I can to work my technical analysis better, when I knew that USD/CAD climbed the price and my perspective was excellent, but I can to work a little more my analysis to share my observations here
Everything it's explain in this screenshot!!!
So, my analysis in H1 timeframe look good, but I can to work a little more as I explain in the above of this screenshot to improve my entry in the smart point to be my entry a little more precise when I'm very sure that USD climbed.
And my Daily analysis, as I predicted very well, pass.
In summary, I would have a precise entry if I only draw in H4 timeframe the smart point and also put my buy order limit around 1.3450 CAD and also a little more patience. This it's the major observations that I note to work my analysis like this when it's about a market reversal. The key it's being a little more patience when I knew that my perspective was excellent, and could be perfect, but was almost perfect, the only to know it's study this observations to the next analysis like this.
So, as i got 11.95% earned. i will need tu sum with my anothers analysis in EUR/USD and GBP/CAD to get my real results. At the moment, I hold 10.07% in this month and sum it 11.95%. So, I get 22.02% for now. But only one moment because as I had 2 fell trades in EUR/USD and 1 trade with a small eanr, I will need to calculate it very well with GBP/CAD whtat was a partial earns that I decide today to closed up this long position with profits. And also a review of EUR/GBP of the past week analysis that I need to make a review too.
So guys, if you like the review111 Notice that every week I will make review to evaluate my trades specially in Forex market.

USD/CAD: UpdateAt the moment, we're in profit in both trades. and also I see that USD/CAD was manipulated for second time, but in this time doesn't hit my Stop Loss, but as I knew, was climb up as I said you. This was a pure manipulation that also, I have a comment and note to improve my skill in this kind of analysis a little more to be excellent to trade when I knew it. At the moment, I'm in profit with 4.89% in profit. what I recover part of my loss in the first trade. The only that I want to do it's update my target profit to down a little to fix in $1.3400 CAD. As first we have a smart point that institutional want to carry the price to this smart point that I'm watching in this grey zone.
So, we continue hold this position.
For tomorrow, we have 2 important news in our economic calendar about U.S. Initial Jobless Claims and Philadelphia FED Manufacturing, what I expect that Dollar continue bullish in this way.
This it's the H4 timeframe and analysis here to view better!!! We're bullish in this trade

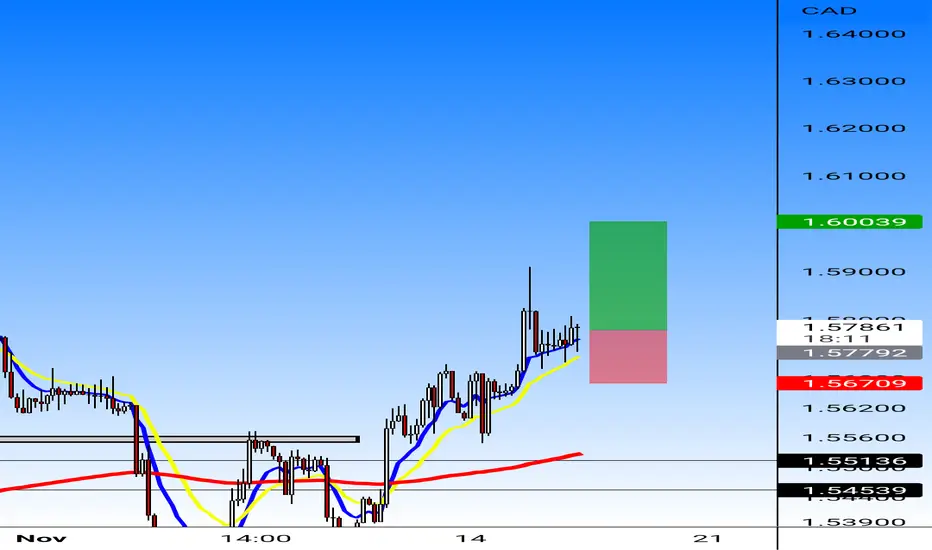
GBP/CAD bought zone opportunityIn this analysis, as I follow this trade in this week. GBP/CAD still bullish, what we can to buy now and fix our target to $1.6000 CAD. Also, I'm in long and I re-enter again to $1.5811 CAD. We're in the best zone to buy!!! Buy now!!!
Meanwhile, in H4 timeframe still bullish in this side.
Good luck!!!

GBP/CAD:Long positionI buy GBPCAD in this point.
I'm going to long!!!
Good luck
I enterado around $1.5786 CAD. Stop Loss to $1.5671 CAD
USD/CAD: bought by fundamental news!!!The U.S. Dollar look bullish by sense in the fundamental news what I read in my own opinion. What as I share what I found out.
1) U.S. Dollar rose against the basket of currencies, as investor kept their focus on the Federal Reserve's interest rate hiking path after a policymaker said too much of last week's cooler U.S. inflation data
2) Governor Christopher Waller told on this Sunday that FED could now start thinking about hiking at a slower pace as inflation print was just one data point that they're similar readings would needed to show convincingly that U.S. inflation was slowing.
3) Adam Button (Chief Currency Analyst at Forex Live in Toronto, Canada) put in note that investor hopes how far the FED make recalibration to rethink it needs some time to digest the enormous. He comment too, that he's expect that market to consolidate and digest some of these moves.
4) The release of cooler than expected U.S. Consumer Price Index for October on Thursday prompted a sharp retreat in the Dollar on raised expectations that FED will decide to temper its aggressive monetary tightening with another potential to hike 50 bps in December.
5) Governor Christopher Waller attempted to punture this optimism, saying in an interview over the weekend that the markets shouldn't get carried away over just one a data point to hike slower pace as inflation began to slow.
6) Federal Reserve will likely soon slow its interest rates hikes. Signalizing that U.S. Central Bank tries to figure out how high borrowing cost need to go and how long they should stay there to bring down inflation.
Now, fundamentally the fundamental news sound bullish for USD as we see that first, investor kept their focus on the Federal Reserve's interest rate hiking path after a policymaker said too much of last week's cooler U.S. inflation data. This sentence it's appear that indicate that U.S. Dollar it's entry in demand as investor still watching the Federal Reserve's focus about interest rate hikes in December 2022. Another fundamental news are talking that FED it's seem to starting to slow pace the interest rates hikes, and economist believe that FED may to hike not 75 bps, did you know 50 bps after inflation it's hot and also, it's very necessary to know if U.S. Central Bank will bring down inflation as there're economic data that appoint that Federal Reserve may be less aggressive to hike interest rate and may to change their monetary policy in US.
Now, based in our technical analysis, we see this:
I see an ABCD harmonic pattern what we can to get a nice opportunity to bought USD/CAD. And I draw a fibonacci level, with expection in two important point in 0.382% and 0.618%, What mean that we can to find up targets in one of those zones. And also the MACD it's almost oversold.
Now, in H1 we see in this chart that USD/CAD formed a little symmetric triangle, and seem that they (institutional) move the Dollar to the upside.
So, I put a buy order in $1.3300 CAD, Stop Loss in $1.3250 CAD and take profit $1.3440 CAD. This it's a risk/benefit 1:3. This could be a nice trade in this week.
Good luck!!!

EUR/CAD: Update; break evenEuro/Canadian Dollar rose to the bullish side as in this moment it's in the run toward my target profit that have less 61 pips more.
What in this moment, I will put a break even to protect my earns from now in $1.3546 CAD, in case that EUR/CAD go back to the previously level, I'm protecting with 41 pips earned from by break even. But in my trade, I have 89 pips earned. But EUR/CAD continue up.
Now, it's very important to look this reaction if EUR/CAD may to continue up, in case of any bearish rejection from this reaction, it's a sell signal and obviously, it's necessary to pick up our earns.
At the moment, we're in course lead by fundamental news very well in this trade.
Good luck!!!

EUR/AUD: Review!!!Well ,in this last analsyis of my past week. I made a trade in EUR/AUD, but unfortunately, I loss in this trade 3.76% with my 1.37% in general loss. those it's sum to 5.13% in loss the past week, that in my past week starting in November. What I remember that I was in long position in EUR/AUD and into this bullish setup. So, at the moment, this trade was a little hard as after we had the past week the FED interest rate decision. So, as I enter in November 1 2022 at $1.5424 CAD, that was a bad entry in the higer and it's suppose to entry in the bottom previosuly like $1.5390 CAD levels and then the price go to my direction, at least in the top of this descending line making higher low. But everything it's process of learning edge
So guys, in the past week I had in loss 5.13%. But that this not all, as this week I have 2 trade in positive in Ethereum and EUR/GBP that touch my my full target profit. That those trade I will analyze it more later, and also, I'm still in long in EUR/CAD in profit in this week. I have 2 trade that was excellent and I hope that EUR/CAD go ahead .

EUR/CHF: Review!!!As this week, I traded EUR/CHF into this bullish channel with a bullish perspective from November 6 2022. EUR/CHF goes bullish, and also I had one traded that I entry around $0.9892 CHF, I was in small profit, but I take a better decision before that price make a little drop on November 7 2022 that I was in profit like 22 pips, but I closed up with a small loss of 0.88%. As this was a market manipulation and I was in buy order place later of this movement. But I was in long and my perspective was bullish. But I note that as EUR/CHF moved into this bullish channel, the price make fluctuations between this range. But on Yesterday, I decide to cancel my buy order limit and this trade, as I knew that EURCHF continue up by fundamental news.
But now, I see an interesting movement that gave it, EUR/CHF break up the bullish channel and EMA 200, what if I see like learning edge process a short position in the top if this channel, that if traders see this point, it's a good option to short, but as I was in long, so I was bullish in EUR/CHF, but what I found out an interesting resource it's when we're into this channel, it's necessary to mark the precise point where will be the key reaction that the price will respond me
Marking a resistance line of key reaction like this. this work in your trading experience.
So guys, as I took this trade, it's not bad, it's ok in this trade that I got a small loss like 0.88%. And well, everything it's possible in Forex market and be prepared by experience, make the master.
I will add the follwing link to related idea to read my past analysis on EUR/CHF
