TAOBOT Eyes Further Upside Toward New ATHAfter forming a short-term higher high sequence from the June low, UNISWAP:TAOBOTWETH_8FE920.USD is building bullish momentum.
The next target sits in the equal legs area $0.78–$0.92 zone potentially paving the way for a new all-time high.
Bullishsetup
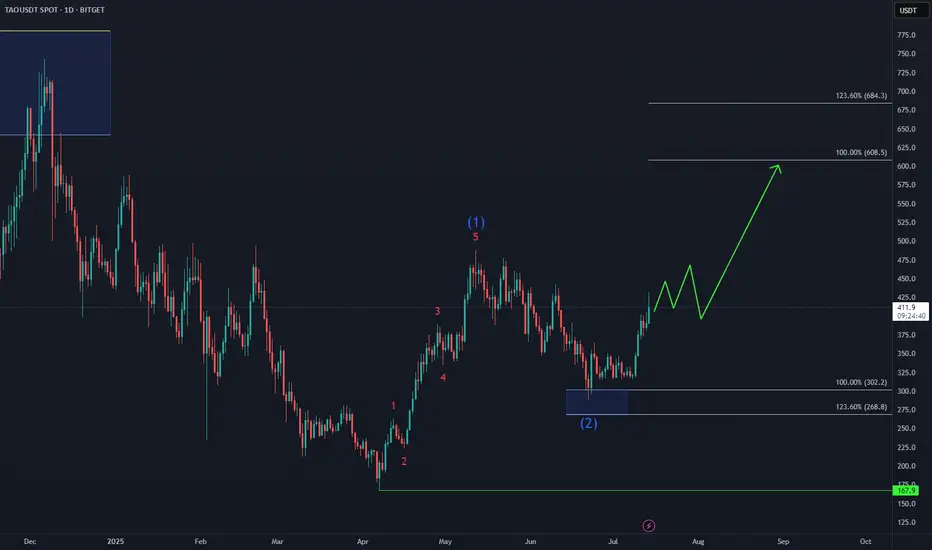
Bittensor TAO Eyes Next Upside Target📈 BINANCE:TAOUSD attracted strong demand in the Blue Box buying zone at $302–$214, triggering the next bullish leg.
Elliott Wave projections now point toward a move into the $608–$684 target area, supported by impulsive structure and rising momentum.
As long as price holds above the recent low, the bullish sequence remains intact.
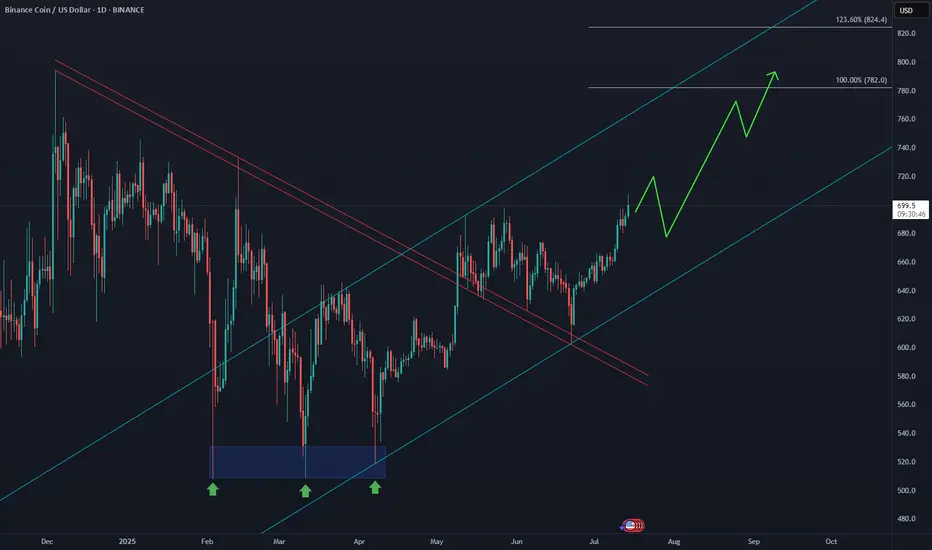
BNB Aiming for New All-Time Highs📈 After breaking above the May peak, CRYPTOCAP:BNB has activated a bullish sequence, with the equal legs target zone projected at $782–$824. This aligns with Elliott Wave extensions and confirms strong momentum from the June lows.
XAUUSD Analysis : Bullish Move Toward Key Resistance + Target🟩 Overview:
Gold is currently showing a clear bullish breakout on the 2-hour timeframe. The market structure has shifted from a downtrend into a bullish phase, with price now approaching a critical Reversal Zone. Let’s break down the key levels, structure shifts, and potential trade opportunities.
🔍 1. Structure Shift – Trendline Break & BOS Signals:
The price previously followed a Blue Ray Descending Trendline, which acted as dynamic resistance and guided the bearish trend.
As highlighted, “Blue Ray Always Continue Trend” – but in this case, we’ve seen a clean Break of Structure (BOS) that invalidated the bearish setup.
A Minor BOS occurred first, which hinted at weakening selling pressure.
Later, a Major BOS confirmed the bullish transition as the price broke above a key resistance level with strong momentum.
This transition was supported by consistent higher lows and a breakout above the descending resistance trendline — a classic reversal signal.
🟩 2. Demand Zone Reaction – Major Support Held Firm:
The Major Support Zone between $3,280 – $3,300 provided a strong base for buyers.
Multiple wick rejections and bullish engulfing patterns near this zone indicated aggressive buyer interest.
This support has now become the foundation for the recent bullish rally.
🎯 3. Next Target & Reversal Zone:
The current price is hovering around $3,358, showing strong bullish momentum.
The next major resistance area is marked between $3,380 – $3,400, identified as the Next Target + Reversal Zone.
This zone is critical — it aligns with a historical supply area and the previous market swing highs.
Traders should be cautious here, as price may react sharply. Reversal patterns (like bearish engulfing, pin bars, or double tops) could signal a potential retracement.
⚠️ 4. Trade Plan:
🟢 Bullish Bias (Short-Term):
If you entered from the support or trendline breakout, continue to hold long positions until price nears the reversal zone.
Trail stop-loss under the most recent higher low to secure profits.
🔴 Bearish Scenario (Near-Term Reversal Play):
Watch for bearish rejection patterns in the $3,380 – $3,400 zone.
If confirmation appears, potential short setups could offer a retracement back to $3,330 – $3,320.
📌 Key Levels Summary:
Major Support Zone: $3,280 – $3,300 ✅
Next Target + Reversal Zone: $3,380 – $3,400 ⚠️
Current Price: $3,358
Major BOS Level: Confirmed
Trendline: Broken with strong bullish pressure
🧠 Final Thoughts:
Gold has officially shifted gears. The bullish breakout is in motion, and the trendline break + BOS combo supports further upside — at least until the reversal zone is tested. However, this is also where the market could exhaust, making it crucial to monitor price action closely.
Stay patient, wait for confirmation, and let the levels guide your next move.

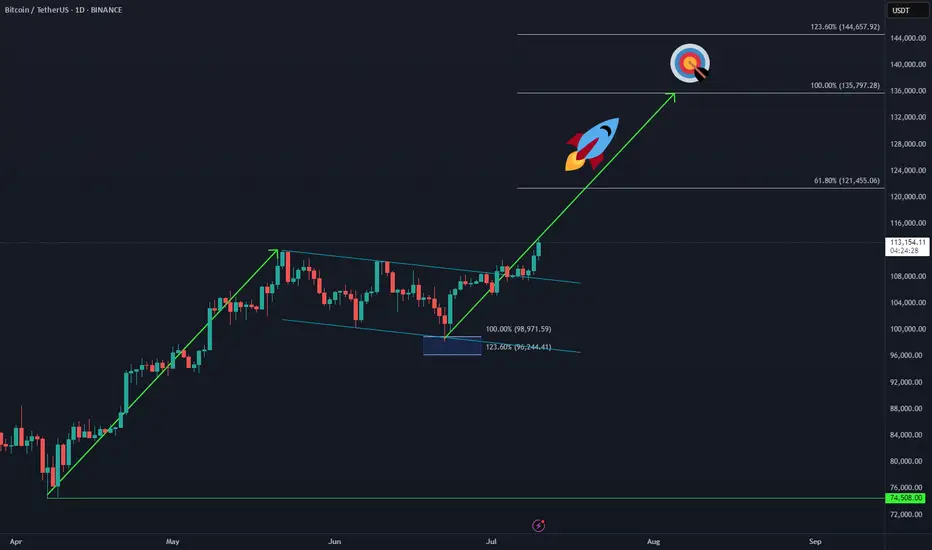
Bitcoin Makes New ATH – Next Sequence in Play 🚀 CRYPTO:BTCUSD has officially broken into new all-time highs, confirming the next bullish sequence is underway.
The upside projection now opens toward the $135K–$144K zone, aligning with long-term Fibonacci extensions and cycle projections.
📌 As always, it won’t be a straight line—expect step-by-step progress, with consolidations and pullbacks along the way. But the structure remains bullish, and the path is unfolding.
Ethereum Breakout Is Imminent!🚀 CRYPTO:ETHUSD is approaching the June peak, and a breakout would confirm a bullish sequence in play.
Upside targets are set at $3,600 – $3,960, aligning with key Fibonacci levels and challenging the 2024 highs.

1INCH ANALYSIS🔮 #1INCH Analysis 🚀🚀
💲💲 #1INCH was trading in a Descending Broadening Wedge Pattern, give a perfect breakout and will retests the levels. If the price of #1INCH sustains the breakout then we will see a bullish move. 📈📈
💸Current Price -- $0.2220
📈Target Price -- $0.2510
⁉️ What to do?
- We have marked crucial levels in the chart . We can trade according to the chart and make some profits. 🚀💸
🏷Remember, the crypto market is dynamic in nature and changes rapidly, so always use stop loss and take proper knowledge before investments.
#1INCH #Cryptocurrency #Breakout #DYOR

SUI Next Upside Target🚀 After holding above the April low and completing a 3-wave pullback in wave (2), CRYPTO:SUIUSD is now advancing in a potential wave (3).
Momentum is building, and the next upside target lies in the equal legs zone at $4.80 – $5.40, which could eventually lead to a new all-time high.

NZDJPY Long Setup: Institutional Flow Signals Upside to 89.690🗓 Seasonal Outlook
- JPY Seasonal Weakness: Historical trends show July and August tend to be bearish months for the Japanese Yen, reinforcing weakness across JPY pairs.
- NZD Seasonal Strength: July typically supports bullish momentum for NZD, while August may present challenges. However, strength in NZD versus relative JPY softness suggests continued upside potential into early August.
💼 Institutional Positioning (COT Analysis)
- JPY: Commercial traders remain net short, suggesting expectations of further depreciation.
- NZD: Also shows commercial net shorts, yet the price structure aligns more with bullish continuation, hinting at speculative flow favoring NZD upside.
🧠 Technical Analysis
- Liquidity Dynamics:
- Price has cleared multiple buy-side liquidity levels near prior swing highs.
- Sell-side zones continue to hold, indicating strong bullish intent and failed bearish follow-through.
- Market Structure:
- Higher lows and sustained bullish reactions post-liquidity sweeps reinforce an upward trajectory.
- Current structure suggests accumulation and breakout patterns toward the proposed target.
🎯 Target Projection: 89.690

SUI may be ready for next moveSUI has been consolidating for last 60 days and has tested the Daily FVG couple of weeks back. It looks like it is ready for trend line BO and should give 35% profit for recent high. But be cautious of low volume in the current move. Only a close above 3.08 with strong volume can confirm this.

GH 3D: breakout forming inside ascending channelThe price of GH continues consolidating within the top of an ascending channel, confirming bullish structure. The rectangular accumulation has lasted for over three months, with price staying above all major EMAs and MAs - a strong trend confirmation. On the last impulse, volume increased, and now the price is compressing again. A breakout with a retest would serve as a valid entry. First target lies near 61.38, second at 73.66, and third at 87.37 - aligned with the upper range of the medium-term Fibonacci extension. Fundamentally, GH remains a promising biotech pick amid sector rotation and potential Fed easing. EMAs and MAs sit below price, and D/A supports the breakout scenario. Waiting for confirmation before entering.

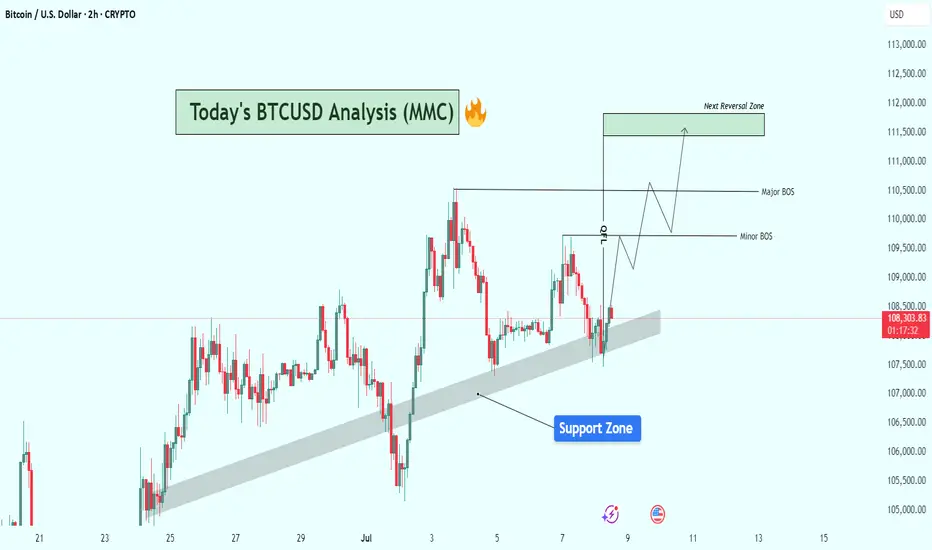
BTCUSD Structure Analysis : Bullish Zone From Support + Target🔍 Current Market Structure Overview:
Bitcoin is currently trading around $108,375, hovering just above a clearly respected rising support zone (shaded area). This dynamic support has held price multiple times and continues to act as a springboard for short-term bullish moves.
The chart illustrates a classic bullish continuation setup forming, with key structural levels marked as Minor BOS (Break of Structure) and Major BOS, indicating potential areas of trend validation and momentum acceleration.
🔹 Key Technical Elements:
✅ Support Zone:
The shaded diagonal support zone has acted as a bullish trendline base, holding up since late June.
BTC recently dipped into this area, found buyers, and is now attempting a reversal from this level.
This reinforces market interest and confirms the accumulation behavior in this zone.
⚠️ Break of Structure (BOS) Levels:
Minor BOS is marked near $109,800, signaling the first key intraday resistance.
A break above this level would signal bullish intent and open the way for price expansion.
Major BOS around $110,600–$110,800 is critical. A clean break here will likely validate a trend continuation toward the next objective.
🟩 Next Reversal Zone (Target Area):
Highlighted around $111,500–$112,000, this green zone represents a potential liquidity grab/reversal area where sellers could re-enter.
This zone aligns with previous price exhaustion levels and may trigger consolidation or a short-term pullback.
📈 Projected Price Path (Wave Schematic):
The chart outlines a wave structure projection, suggesting:
A possible retest of the minor BOS.
Follow-through into the major BOS area.
Final push into the reversal zone before potential rejection or sideways action.
🔧 Bias & Strategy:
Bias: Moderately Bullish as long as BTC respects the support zone.
Invalidation: A decisive breakdown below the trendline support and close under $107,500 would invalidate this bullish setup and shift bias to neutral/bearish short-term.
Trading Plan Ideas:
📥 Buy Opportunity: On minor dips within the support zone, targeting BOS levels.
📤 Sell Watch: Near reversal zone ($111.5K–$112K) if signs of exhaustion or bearish divergence appear.
📌 Final Notes:
BTC appears to be gearing up for a breakout from consolidation, and price action is coiling with higher lows. Market participants should watch closely how BTC reacts at the minor and major BOS zones, as they could define the next leg for either bullish continuation or rejection.
USDJPY Pre-Breakout Setup – Eyes on 145.310 for Bullish EntryThe recent structure on USDJPY (4H chart) shows a bullish shift supported by a strong double bottom formation within a defined demand zone. After a clean impulse from the bottom, price is now consolidating below the key resistance.
🔹 Trade Idea:
I am patiently waiting for the price to break and close above 145.310 to confirm bullish continuation. Entry is valid only above this level to avoid false breakouts.
🔹 Technical Highlights:
- Price rebounded from a strong demand zone with a double bottom.
- A new bullish leg formed, approaching the 0.786 Fibonacci retracement level.
- A clear impulse-correction structure signals potential for further upside if resistance is broken.
🔹 Trade Plan:
- Buy Above: 145.310 (confirmation breakout)
- Stop Loss: 144.40 (below structure and 0.382 Fib)
- Target: 146.900 (aligned with 1.618–2.0 Fibonacci extension)
⚠️ Note: No trade if price fails to break and hold above the entry trigger. Patience is key.

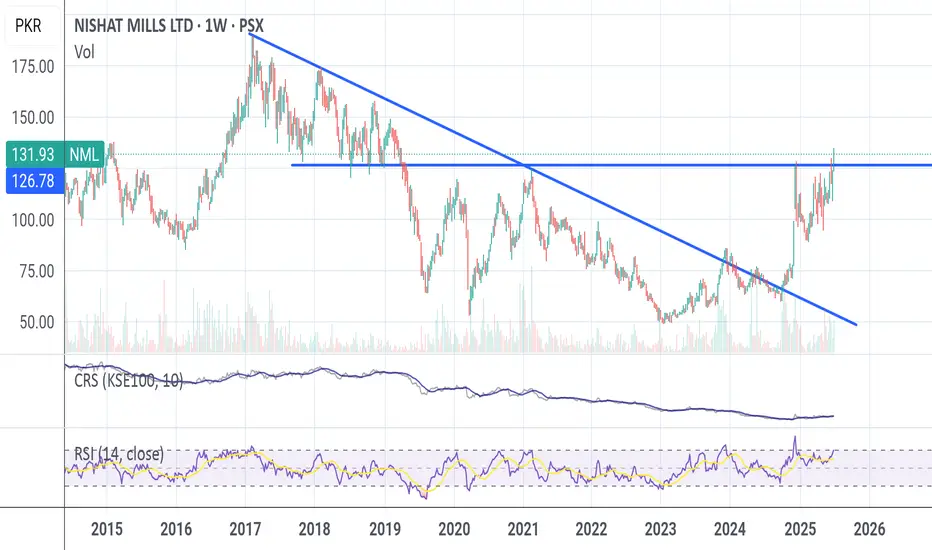
NMLStarting to move high from key polarity zone. Just like other textile companies, this one also looks good.
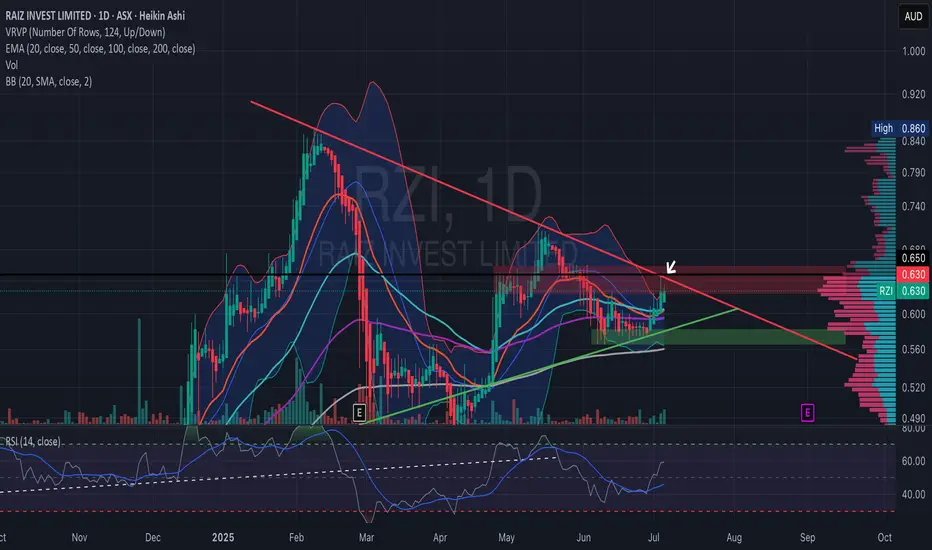
RZI Bullish BreakoutThe price is currently testing resistance around 0.63, after rising from 0.575. The volume profile indicates high activity around 0.58-0.62, showing strong interest.
The EMAs reflect a bullish shift, with the 20 EMA approaching a crossover above the 50 EMA.
After a period of squeeze inside the triangle, the bands are beginning to open.
The RSI is neutral to bullish, trending upward around 50. Overall, the chart suggests a potential breakout. No clear over-bought yet, there is room to run if bulls stay in control.
Key Scenarios
Bullish Breakout: A daily close above the red trendline + A$0.63–0.65 resistance zone would confirm.
First target: A$0.70–0.72 (next volume-profile “valley” and previous swing highs)
Secondary: A$0.80+ (upper Bollinger band confluence from the Feb top)
False Break / Rejection:
Look for a swift pullback into the green ascending line (~A$0.60) or the broader support box around A$0.57–0.58.
Watch EMAs for signs of rolling over (20 EMA crossing back below 50 EMA would turn neutral-to-bearish).
BONK Bullish Reversal in PlayAfter a clean 5-wave advance from the April low, CRYPTO:BONKUSD corrected 55%, then carved out a higher low last month. Now it’s eyeing a breakout above the May peak as the next leg higher begins.

Give me 3 reasons not to be bullish on SolanaSolana’s Total Value Locked (TVL) expanded from $396M on Dec 26, 2022 to $8.69B by July 4, 2025, a 2,094% increase (~22x growth) across 80 weeks . This translates to a weekly geometric growth multiplier of ~1.089, or an 8.9% compound weekly rate .
This rapid TVL expansion reflects capital inflows, increased DeFi participation, and regained trust in Solana’s infrastructure following the FTX collapse.
————————————————
LST Ecosystem Expansion :
Liquid staking derivatives (JitoSOL, mSOL) accounted for a significant share of inflows, as yield-seeking capital returned with Ethereum-style primitives on Solana.
MEV Monetization & Compression Tech :
Validator-side MEV solutions and data compression (via Firedancer and ZK-state) improved scalability and trust in Solana’s low-latency environment.
Resurgence of DeFi-NFT Hybrids :
Protocols like Tensor and HadeSwap blurred lines between DeFi and NFTs, generating sticky liquidity and reinforcing Solana’s unique narrative.
Restored Institutional Confidence :
Post-FTX reforms and a more diversified validator ecosystem helped re-attract institutional capital, supported by enhanced wallet infra (e.g., Backpack, Phantom) and custodianship.
This pattern, paired with the geometric growth trend, suggests Solana’s DeFi ecosystem is entering a new structural bull phase, underpinned by both technical confirmation and fundamental evolution.
Anyways, let me know in the comments 3 reasons not to be bullish on Solana as we speak.
(PS: QC-resistant issues don’t apply only for Solana but for all major crypto assets!)

Ethereum Trading Strategy: 5:1 Risk-to-Reward Ratio"Ethereum Showing Strength on the 4-Hour Chart — A New Bullish Trend Emerging?"
The 4-hour timeframe is starting to show strong bullish momentum. Could this be the beginning of a new uptrend?
A potential 5:1 risk-to-reward setup is forming:
Entry: 2,620
Stop Loss: 2,364
Target: 4,062
Support 2500 must hold!!!

Bullish Flag Pattern.
Bullish Flag Pattern.
Crossing 435 with Heavy volumes will
trigger more positivity & will expose
New Highs targeting 700+
On flip side, breaking 300 now, will
bring more selling pressure.

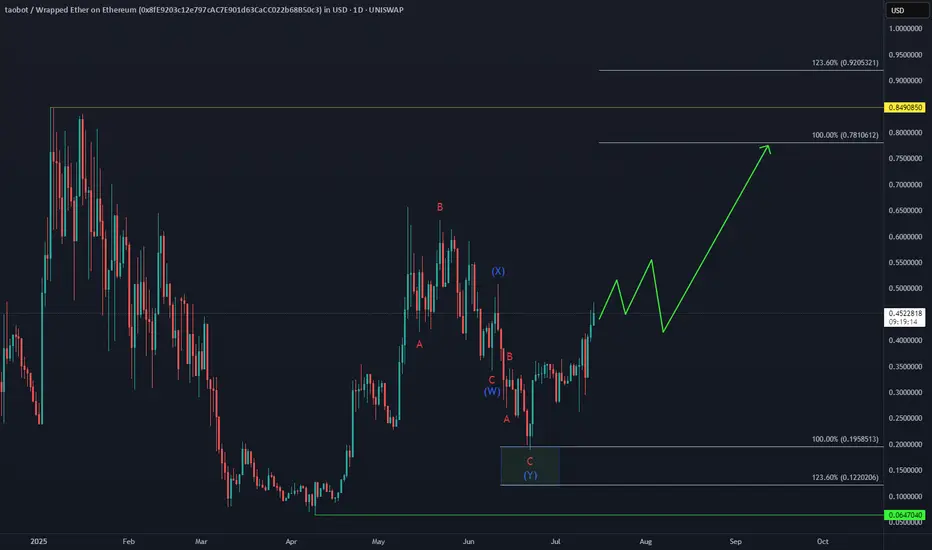
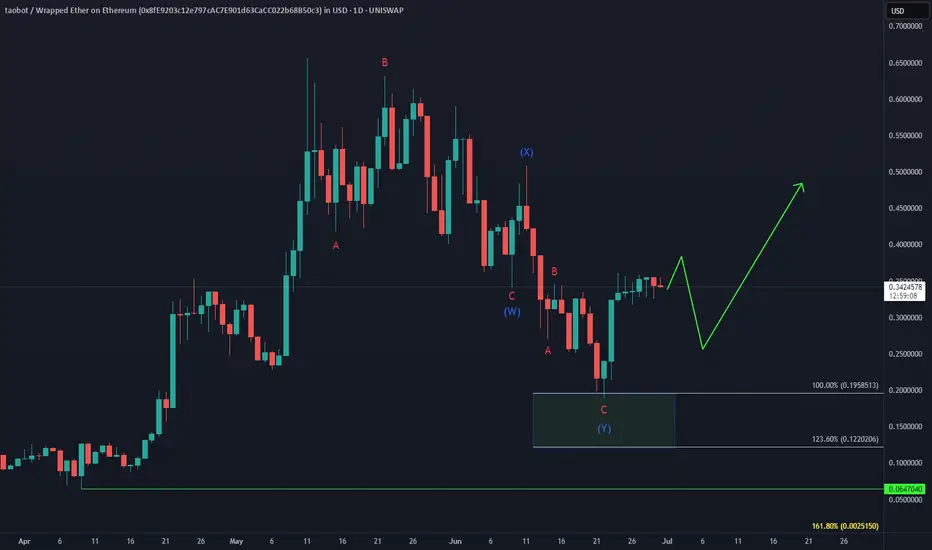
TAOBOT Bullish ReversalWill UNISWAP:TAOBOTWETH_8FE920.USD outperform BINANCE:TAOUSD ?
After the failed early June bounce, price completed a double correction into the $0.195–$0.12 equal legs zone, triggering a sharp 90% reaction higher.
As long as $0.19 holds, the setup favors continuation to the upside, with a break above the May peak in focus.
FARTCOIN Bullish Reversal in Progress
CRYPTO:FARTCOINUSD 3-swing correction from the May peak appears complete, even though price didn’t quite tag the $0.75 entry zone.
Now, the spotlight’s on the bulls — can they deliver an impulsive rally off the lows to invalidate a potential double correction next month?

KAITO gears up for liftoff!CRYPTO:KAITOUSD
The correction from the May peak has wrapped up within wave (2), and price is now pivoting from the June low at $1.22. Holding above that level keeps the bullish roadmap intact—with eyes firmly on the $2.96 target to unlock fresh all-time highs.

Liquity - Setting up for a big move - 113%Looks like a few coins are getting ready to make some killer moves. LQTY looks ready to kick things off over the next several hours for a potential aggressive run.
In the 2H:
-RSI/Stoch & MACD look primed for a bullish flip.
-The short EMAs are supported by 55EMA . We need this to continue and get them to traverse over the Median line of the BB.
-Look for accelerated moves as the candles find support from the 5EMA and, even more aggressive, the upper/outer BB!
I'm estimating it to culminate sometime tomorrow evening.
Let's so what happens!
