BTCUSD Long view on 60 min chartBTCUSD potential buying opportunity for traders with a mini resistance at 35110.82. after a big drop potentially a good buying opportunity.
Bullishsetup

Elliott Wave Analysis: NIKKEI Remains BullishHello traders and investors!
Today we will talk about Japanese Index NIKKEI 225 in which we see very clear bullish pattern.
As you can see, NIKKEI made an A-B-C corrective decline from the highs and the main reason why we think it's a correction within uptrend is because of a triangle within wave B in the middle. We know that triangles cannot occur in wave 2, so it must be wave B as part of an A-B-C correction.
The Next very important evidence that A-B-C correction is completed is recent five waves up from the lows and we know that a five-wave reversal indicates a change in trend, so NIKKEI will probably stay in the uptrend.
However, in EW theory, after every five waves, a three-wave pullback follows, so before we will see a continuation higher, be aware of a corrective slow down with ideal support in the 28800 - 28300 zone. Of course, pullbacks could be even deeper, so count remains valid as long as the price is trading above 27400 May lows.
Be humble and trade smart!
If you like what we do, then please like and share the idea!
Disclosure: Please be informed that information we provide is NOT a trading recommendation or investment advice. All of our work is for educational purposes only.

Long Position: Bitcoin continue up!!!I put a buy order limit exactl at $40,000 USD as Bitcoin break out the resistance, that it's now support in the level of $39,400 USD. My SL will be around of $37,000 USD and my target will be the level of $53,600 USD.
s3.tradingview.com
I see that in H4 timeframe, BItcoin continue up maybe in the next hours.
s3.tradingview.com
And looking in Daily timeframe, we see that Bitcoin it's extremely bullish to $%3,100 USD, for that, the reversal could be valided in the trend.

Alert: Bitcoin break up the simetric triangle!!!At the moment, looking in Hourly timeframes, we see that Bitcoin deciding to continue up, Bitcoin price it's around of $38,800 USD and the price have all chances to make a reversal in the trend, in that case will be bullish. So, I hope that BItcoin make a down around of $38,000-$37,700 USD to entry in this range to long posiition with the SL around of $35,600 USD and target profit $52,000 USD based in the forecast that I put in the anche of this simetric triangle. And also, I see that RSI form a bullish divergence in H8 timeframe, that was a good signal during this day.
s3.tradingview.com
And now, in Daily timeframe, as Bitcoin break out this simetric triangle, there's a lo chances that Bitcoin could to continue bullish and make a reversal of this trend.
So guys, we hope that Bitcoin make a little down in this range what I told in the first paragraph to entry in long position in Bitcoin.

My possible next trade for Ethereum!!!Ethereum show us that form an ascending triangle, a bullish pattern. Now, I analyze from H12 timeframe and I look that Ethereum form this chartist pattern, I don't going to trade Ethereum until make a break out. For that, my main trade will be Bitcoin becase Bitcoin Dominance it's up and altocins are suffer when you compare Altcoins/Bitcoin ratio. My possible predictiion that Etherem could to reach it's the mark of $4,000 USD.
s3.tradingview.com
But if you look the Daily timeframe, Ethereum show us that the trend it's make always lower higher in this key support line from began on 2021 from the price of $1,200 USD approximately. That could be a good news for Ethereum that the next price will be above of $4,000 USD.

My possible next trade for Bitcoin!!!Bitcoin form a simetric triangle in H8 timeframe, but at the moment, we can't to buy Bitcoin, I hope to buy Bitcoin contract above of $37,700 USD.
s3.tradingview.com
Now, if you look the Daily timeframe, there's 2 indicator that show that Bitcoin it's preparing to continue to bullish movement soon. MACD show us good zone to buy, but not confirmed in the price action, for that, I decide to hope until Bitcoin break up the resistance at $37,700 USD. Meanwhile, in the RSI Bitcoin form a bullish diverngece making lower higher in the indicator and the price action maybe a lower low. That could be an indication that bulls are preparing to make a movement volatile soon!!!
At the moment, my idea it's neutral, but the chances could be bullish!!!

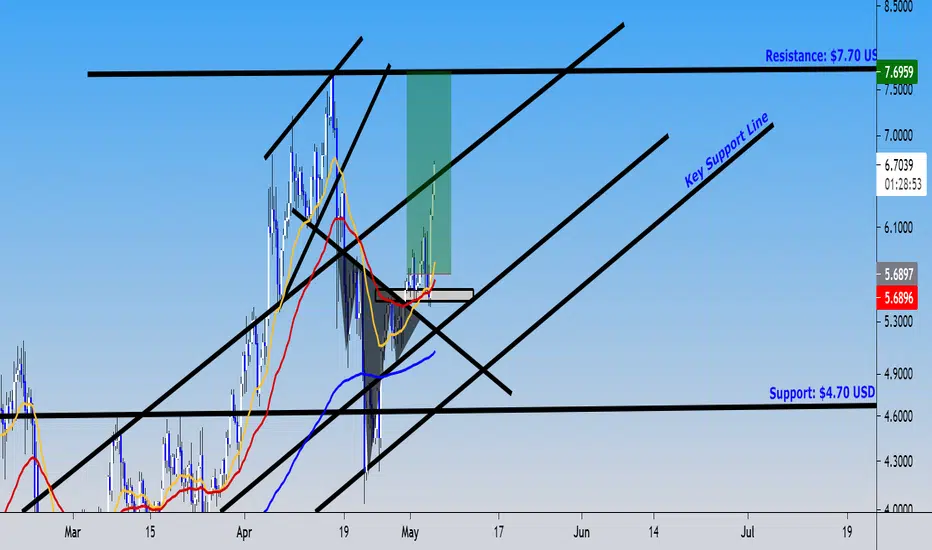
I'm bullish in Tezos!!!Tezos it's so near to break out inminent. I decide to trade Tezos until 2 specific target. You can to get the target until $5.76 USD or keep this position until the $7.70 USD to touch the maximum price. Tezos price it's around of $3.50 USD and I buy 234 Tezos contract in Simple FX using my Cardano account to accumulate it.
Recently, I have accumulae 2,000 Cardano coins in my Simple FX account, that it's sum with 10,000 Cardano coins. But I want to talk about of one Cardano strategy that will be good for you and how you can to accumulate Cardano, and use this Cardano generated by your trading account to invest and hold by long term. This strategy it's called accumulate 1,000 Cardano coins, repeating tis proccess to get 1,000 Cardano coins and withdraw and generated another 1,000 Cardano coins.This it's fabolous for you if you beleive that Cardano it's your best cryptocurrency. MY GOAL IT'S TO REACH 20,000 CARDANO COINS.
s3.tradingview.com
This was the yesterday analsyis of Tezos, we see that Tezos it's look extremely bullish to $7.70 USD.

Cardano entry in the accumulation zone!!!Based in my opinion, I see that Cardano it's into this consolidation, but if you want, you can to hold Cardano, still with this long position (but you will need to hope a large time until Cardano break up the $1.85 USD. But, I thinking to check out the ratios of ADA/BTC or ADA/ETH if it
s the time for Bitcoin.
I learn in this year when Cardano make consolidation, then ADA/BTC loss value. That mean, that Cardano loss value in front of Bitcoin when Bitcoin up and Cardano still in this consolidation. But, I decice to find up another trade in others cryptocurrencies.
Example: If you see the difference the ADA/USD may be consolidated, but if you look the ADA/BTC or ADA/ETH, then Bitcoin or Ethereum could to earn value. This it's very good, because when you sold your ADA to BTC, you conserve your Bitcoin power when ADA loss in front in Bitcoin, and you can to use your Bitcoin power to buy more cheap the ADA/BTC ratio, and included more ADA coins when you comapare the ratios like a professional.
So, at the moment, I decide to closed up my long position in ADA becuase it's look bored when ADA make this consolidation, but I hold Cardano coins. Now, I thinking to check out the Bitcoin and Ethereum ratio to compare with Cardano and look if Bitcoin it's more strong than Cardano when Bitcoin it's so near to break out inminent. Guys, if you found out that this strategy it's sound interesting. Please, get me a hand up, you can to comment below and share this information.

Bitcoin forming a bullish rising wedge!!! At the moment, Bitcoin up from $32,000 USD to $37,000 USD. In the past analyze, we see that Bitcoin formed a shoulder head shoulder (bearsih pattern) and the prediction was very good, I do not entry in this short position becuase I can't to catched this trade in the time.
s3.tradingview.com
This it's the H4 timeframe that we can to look the Shoulder Head Shoulder better.
Now, in the H8 timeframe, if you want to trade Bitcoin, we need to hope a buy above of $39,300 USD if you want to trade Bitcoin to long position. I see that Bitcoin it's look bullish and my next prediction will be that Bitcoin may to up to $49,000 USD in few days.
s3.tradingview.com
Now, lookin the Daily timeframe, we see that Bitcoin it's in formation of this bullish rising wedge, and we see that Bitcoin make a strong support around of $30,900 USD, that mean that bulls are hold Bitcoin above of $30,000 USD. For that, Bitcoin have all chances to go up the trend. And there' we see a bullish divergence, that will be very good for the RSI.

Cardano forming an ascendent triangle; bullish patternYesterday, I sold 10,484 Cardano coins, but today, we see that Cardano down even in the $1.41 USD, but Cardano price it's right now above of $1.57 USD and make a rejection on this bearsih movement that we see. But we could to forming this ascending triangle that show us that our next target will be around of $3 USD. So guys, the time to accumulate Cardano it's now, becuase there's not any signal that Cardano going to down, but what we see in H12 timeframe it's a bullish hammer formation. For that, I will re-open my long position in Cardano until the $3 USD that will be my target, and my SL will be $1.20 USD. It;s a risk/benefit of 1:4
s3.tradingview.com
And looking the Daily timeframe, I want to show you this timeframe because I see that Cardano forming a lower higher in this trend line and I show you 5 green arrow that make lower higher in the chart. And that will be a good signal that Cardano it's going to take a re-surge in this next volatile movement.
Now, I decide to re-buy again my Cardano coins to hold as I sell around of $1.59 USD. Now, I see that this drop was confused as we see that cryptocurrency today down, but some cryptocurrencies like Cardano make rejection, Cardano it's an example.
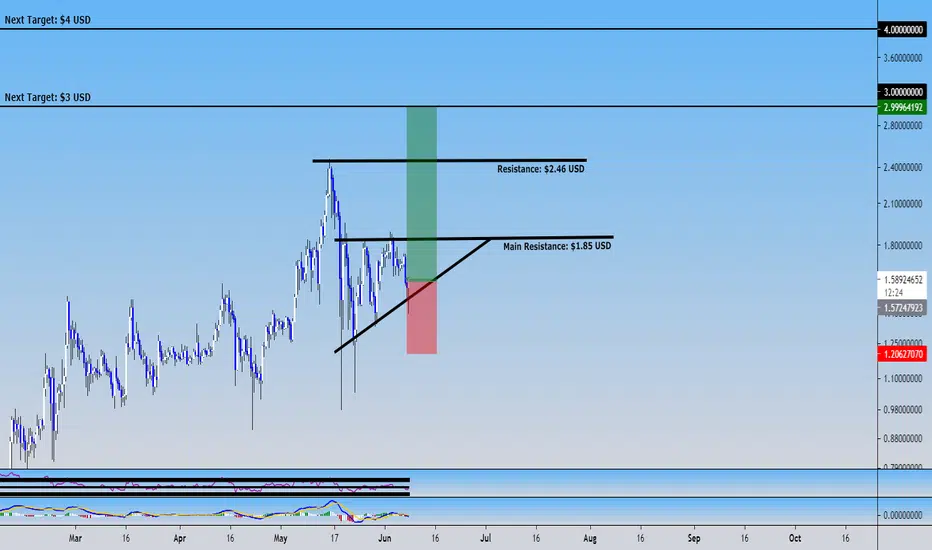

Cardano form a Shoulder Head Shoulder (Inverted)At the moment, looking in short term, Cardano could to go back to $2.46 USD in short term. Today in the morning, I buy again my Cardano coins as I sell at $1.46 USD on yesterday, but today, cryptocurrencies are recovering the trend. I entry in the market price with the SL around of $1.26 USD and my target will be $2.46 USD following this chartist pattern.
s3.tradingview.com
Now, Cardano it''s leading to $3.46 USD to complete the forecast of this ascendent triangle. For that, Cardano it's so near to explode the trend.

Ethereum to $5,000 USD in medium term!!! My plan!!!I see that in Daily timeframe, Ethereum it's preparing to make a massive bullish movement to $5,000 USD. I thinking that Ethereum trade sound very intereresting to trade.
Just I wanna to share this analysis to have a plan!!!

Cardano to $3 dollar!!! Long positionAt the moment, as update, there's an interesting trade in Cardano. You can to entry right now in Daily timeframe becuase I see that Cardano make their little pull back and irhgt now, it's touch the 0.382% of Fibonacci ready to entry in the market price.
You can to entry in the market price with the SL around of $1.32 USD, remember we keep this position by longer as I analyze in Daily timeframe.
Good luck!!!

Ethereum to $4,000 USD very soon!!! This it's bullishIn the morning, I create in my a little analysis of Ethereum in my iphone. Now, in this update, we see that Ethereum continue up to the mark of $4,000 USD. During the past month, I was trade others pars except Ethereum, that I do not touch what I note in it. But right now, I take this position for long. I entry approximately at $3.350 USD and I put a SL at $3,100 USD with a target profit in the $4,000 USD.
s3.tradingview.com
In Daily timeframe, it's look bullish!!!
s3.tradingview.com
Now, I see that Ethereum it's extremely bullish and we're leading to the mark of $4,000 USD, and after of this mark, our next prediciton will be $5,000 USD for Ethereum.
Guys, it's all, for that, in the monring too, I closed up my Bitcoin short position because there would be a lot chances to continue up and for that, I send you a message to close the long position in BItcoin becuase Bitcoin form a double top very well, but looking in 3 Daily chart, it's bullish and maybe, the price could to continue up. For that, I will enfocous in altocins at the moment. And we're in profit in Tezos until the $7.70 USD for who follow my long signal.

Update: Tezos continue up to $7.70 USDWe're in profit in Tezos. Congraluations. My entry was perfect!!!
Now, I put a break even in the entry price that in the second time, we re-entry in Tezos. My entry was around of $5.75 USD. I move the SL at $5.70 USD for just 5 cents. But we're in break even cut the loss.
s3.tradingview.com
Now, in Daily timeframe, Tezos explode!!! For that, we're bullish, we can to consider to entry in the second trade in the support of $7.70 USD. but we hope. At the moment, I'm in Ethereum and in profit both in these trades.
Smart money Distribution on EURGBPWe're likely to see a consolidation on yesterday's low so as to gather accumulation of orders then a short bearish distribution (judas swing) then a clear Impulsive reversal swing (bullish) on the sellstops marked (X).

EW Analysis: EURCAD With Bullish Setup FormationHello traders!
Today we will talk about EURCAD, its price action from technical point of view and wave structure from Elliott Wave perspective. We want to show you what are best setups for trading in real time.
Well, we will focus on a lower time frame, a 4h chart, where we can see nice, clean and impulsive five-wave rise from the lows, which in Elliott Wave theory suggest the bottom, at least a temporary one.
Five-wave cycle has to be labeled with the first higher degree leg A/1 and we know that after every five waves, a three-wave a-b-c corrective pullback follows in wave B/2 which is usually followed by a third leg C or 3.
So, it doesn't matter if we will see a bullish reversal with 1-2-3-4-5 waves up or just a corrective A-B-C movement. In both cases we can expect at least one more push to the upside.
Current three-wave a-b-c corrective decline within wave B/2 looks to be unfinished, but keep an eye on golden 61,8% Fibonacci retracement, where we also see equality measurement of waves a=c, so ideal support would be in 1.4950 - 1.4900 zone. However, it's already at the former wave "iv" support, so in case of an earlier jump up above 1.5100 level, then bulls within wave C/3 would be already in play.
Of course, we may see even even bigger, deeper and more complex correction in B/2, but have in mind that count would be invalited only below 1.4725 previous lows level.
Traders, we hope you liked that article.
Be humble and trade smart!
Disclosure: Please be informed that information we provide is NOT a trading recommendation or investment advice. All of our work is for educational purposes only.

Ethereum could to continue to $3,200 USD in short term!!!At the moment, whole cryptocurrency drop except Ethereum, it's the only cryptocurrency that still stable, but today, we see a nice interesting position in Ethereum. Also, we see that Ethereum make this support trend line in H8 timeframe. I put a buy order limit at $2,230 USD with the SL at $1,900 USD and my target profit will be the $3,200 USD.
s3.tradingview.com
That will be a good signal in Daily timeframe. If Ethereum closed up this candlestick, it's an extremely bullish signal for this cryptocurrency.
s3.tradingview.com
We see in 3 Daily timeframe that Ethereum still bulish and there's not any mnimum idea that Ethereum continue up to $3,000 USD.

Opportunity in Cardano: Buy more cheap!!!At the moment, Cardano price it's around the $1 dollar exactly, the price could to down below of $1 dollar. the price could to leading to $0.75 cents approximately before to continue up, that it's the level of 0.618% of Fibonacci that form this support very important for us. Guys, if you don't buy Cardano, this could be the last opportunity to buy for below of $1 dollar, Becuase later that Cardano touch the $0.75 cents, Cardano it's go back above of $1 dollar and then, go like a skyrocket to $2 dollar
s3.tradingview.com
We can to say that Cardano break out this monthly timeframe that I don't see. MAYBE, Cardano need to make a pull back approximately at $0.75 cents to then, continue up.
I do not going to trade Cardano until reach the $0.75 cents or show any different movement that I do not hope. But, I will going to still away of this par at the moment to be enfocous in others.

XRP show us that support the 0.618%Maybe, I believe that this prediciton was ok in my past anaysis that I link below of thie link to related idea if you're interesting to read. Also, I draw an elliot waves that it's show that we form the correction #4 in this cycle, now XRP it
s support above of $1.26 USD that form the 0.618% of Fibonacci. And we see that this same confluence support in the past bear rally on 2018 when that support like resistance, and right now, XRP make support in this confluence zone in 3 Daily timeframe.
s3.tradingview.com
s3.tradingview.com
Now, in this screenshoot, I believe that XRP have all chances to continue up, and today if XRP closed up with bullish indication, that mean that XRP could to continue explode to over $2 dollar.
That is it. And guys, if you're find up where to trade XRP, I'd reccomend to prove the Bybit platform when you can to trade XRP, Bitcoin, Ethereum and EOS, and futures. And guys, as I have profit in Bybit, I thinking to use this XRP earning to invest in others crypto to divrsify my portoflio. For example: EOS and Tezos are my cryptocurrency in my radar and as these cryptocurrency are undervalued in the market cap, we have time to accumulate and get EOS and Tezos. For that, I thinking to hold my 4,534 XRP and not more, did you know? invest in others cryptocurrency that I recognize their potentail like EOS and Tezos. But, I will going to withdraw my 500 XRP to complete my over 5,000 XRP to complete the mark of 5,000 XRP and not more. But I decide to keep with this quantity with 5,000 XRP, but I will going to be more patience, keep my XRP coins and hold, and trade with XRP to get compount interest to invest in others cryptocurrency, that it's will be a good plan as I know that XRP growing up fast.

SNX/USD: BULLISH SET UPSNX (Synthetix Network) Binance Chart
Ichimoku : The lagging span was blocked by the candle. Price still below the cloud so trend still bearish.
However
Kijun and Tenkan as support
And
Trend line : was broken which shows some signs of reversal. Price now retesting the trend line, could bounce and start an uptrend.
Targets: Fibo extensions on the chart
How to play it?
You could enter now with a stop loss just below the trend line (about 18.40) OR wait for the price to be back above the cloud and the lagging span to break the trend line. With the 2nd option you'll miss a part of the move but the change of trend will be confirmed.
Trade safe

Big Alert: XRP close the March extremely optimistic: Now what?XRP it's so near of 0.60 cents, at the moment in some minutes, I send and say in my recent post in Twitter that cryptucrrencies are exploding, included XRP.
XRP it's a sleeping, but giant cryptocurrencuy that wewould need to take in our radar. Sure, I have some XRP coins and I invite you to don't sell your XRP coins, just hold, becuase big news it's incoming in few months. There's a increment in the volume in XRP that indicate that XRP holder are prepare to explode to $1 dollar in medium term. But that it's so bullish, also, there're a lot you tubes videos that talking about of XRP news that incoming in few weeks as next revolution for enterprise, business and banks that are enfocous to use XRP to transfer all wealth in the world in this cryptocurrency. Guys, remember what Simpson did in the past year that they predict XRP to $589 USD. If Simpson it's get us this prediction and it's true, well, that it's so strange, but becuase in other occasion, I read and see how the Simpson not just predict XRP, this cryptucrrency that Lisa Simpson it's like to use. But in other and past episode, Simpson predict other events that had pass in the world like the drop of the twin towres, the U.S. presidential election on 2016 that Simpson predict exactly that Trump was the winner on this elections, other events it's the coronavirus and much other events that it's sound very strange. Noticed that all prediciton Lisa Simpson come out in that kind of prediciton what Simpson do, the yellow family!!! But well, I like the Simpson from child. And there's another you tube channel that it's talking about XRP that it's told about the news in this cryptocurrency.
Here the link: www.youtube.com
Now, looking the short term, as XRP it's so near o $0.60 cents. Our next resistance will be the $0.76 cents, as I know the market structure using hte monthly timerame that it's bullish, when XRP break out the $0.76 cents, we can to continue up toward the bull trend in this cryptocurrency toward the $1 dollar, and next the historical maximum price in the year o 2017 at $3.50 USD.
In general, XRP it's extremely bullish in long term, for that this cryptocurrency are sleeping, but it's a giant with lot potentail to entry at least into the top 5, this cryptocurrency it's competent, but not much like Cardano, I believe that Cardano it's more competent against XRP. But well, in that case, I choose a goods cryptucrrency what are Cardano and XRP.
