SUI is building momentum!📈 CRYPTO:SUIUSD After a three-swing corrective pullback into the $3.3 - $2.7 buying zone, price is bouncing and setting up for the next upside move.
The structure is in place—let’s see if the breakout confirms!
Bullishsetup

AUDNZD Breakout Alert | Reversal in Play?The AUD/NZD pair is showing strong bullish momentum as price has finally broken above a long-standing bearish trendline. After a period of consolidation within a descending triangle, bulls have managed to push price above the resistance zone, signaling a potential trend reversal.
Key Observations:
🔹 Bearish Trendline Broken – Indicates a shift in momentum from sellers to buyers.
🔹 Resistance Level Target: 1.09216 – This level aligns with previous supply zones and is a key target for bulls.
🔹 Retest in Progress? – Watch for a possible retest of the breakout zone around 1.0780–1.0800. Confirmation here could offer a great long entry.
🔹 Bullish Projection – If the retest holds, price could rally aggressively toward the 1.09200 level in the coming sessions.
Trading Plan:
✅ Buy on retest confirmation of the broken trendline.
🛑 Stop-loss below the breakout zone (around 1.0760).
🎯 Target: 1.09216 (next major resistance).
💬 Let me know in the comments: Are you buying AUD/NZD or waiting for confirmation?
#AUDNZD #ForexTrading #Breakout #TrendReversal #TechnicalAnalysis #PriceAction #TradingView

FLOKI Correction Complete & Ready to Rally!📊 CRYPTO:FLOKIUSD found strong buying interest in the blue box area at $0.000083 - $0.000074, setting the stage for a trend continuation to the upside.
🚀 Will momentum push it toward new highs?

ChainLink LINK gearing up for a move back toward $20CRYPTO:LINKUSD found strong buyers in the $14 - $12 equal legs zone after a three #elliottwave pullback, setting the stage for the next upside push.
Momentum is shifting—are you ready for the breakout?

IRB INFRA: Cup & Consolidation Breakout🔍 Chart Analysis
The stock formed a textbook cup pattern, indicating accumulation after a long downtrend and also given 200 EMA breakout.
After forming the rounded base, it entered a tight consolidation range (highlighted in blue).
Today, the stock broke out of this range with strong bullish momentum and rising volume.
Immediate support lies at ₹49.25, the base of the consolidation box.
Next major hurdle: Strong resistance at ₹60.52, which aligns with a previous swing top.
📈 Why This Setup Looks Promising
Cup and handle patterns often precede major upward moves, especially when breakouts happen with volume.
Breakout from consolidation confirms bullish interest near ₹53 zone.
The stock has already corrected about 47% from its all-time high, offering a potential value opportunity if trend reversal sustains.
🎯 Levels to Watch
Support: ₹49.25
Resistance: ₹60.52
Breakout Confirmation Zone: ₹53.00–₹54.00
⚠️ Disclaimer
This is not investment advice. Please do your own research or consult your financial advisor before taking any position. The market is subject to risk and uncertainty.

SPX6900 - Time to Get Aggressive and Flip SPX🔥 CRYPTO:SPX6USD With a new ATH on the horizon, wave (3) is eyeing $2.4 - $3.1 as the next target. But this is just the start, momentum is building and summer volatility could push prices even higher!

KAITO is setting up for its next 2x move!📈 BINANCE:KAITOUSDT Found strong buying interest in the #BlueBox zone and now it's gearing up for a potential 100% rally.
🚀 Targeting $3.3 - $4.3 as momentum builds.
Did you catch the dip, or are you waiting for confirmation?

Pudgy Penguins PENGU Gearing Up for a +100% Move! 🐧 BINANCE:PENGUUSDT has completed its 5-wave advance from the April low (wave 1) and corrected with a 3-wave Zigzag structure in wave (2), reaching the buying area at equal legs $0.009 - $0.008.
🚀 Now, it's setting up for wave (3) higher, with an initial target at $0.022.
🌊 Are you positioned to catch the next wave higher?

Exploring Bullish Targets for Hyperliquid HYPE🚀 BINANCEUS:HYPEUSD has surged into a new ATH and the most bullish scenario suggests a nest structure forming.
🎯 This setup could lead to an extension beyond the 1.618 Fib level at $66, opening the door for +$100 range in the coming months.
Are you positioned for this breakout? What’s your personal target for this cycle?

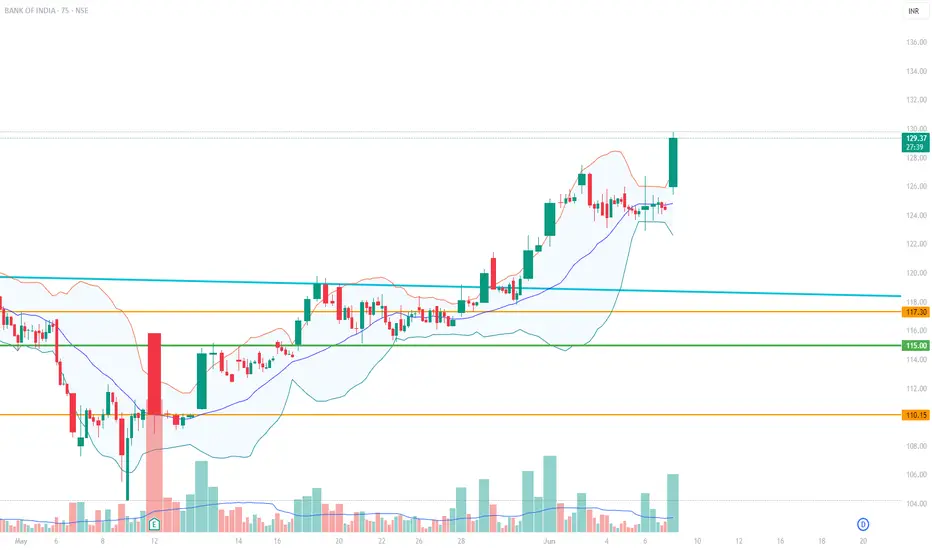
BANKINDIABANKINDIA – STRONG BREAKOUT ALERT!
The stock has given a decisive breakout on both daily and weekly timeframes, backed by strong price action. After a period of tight consolidation on smaller timeframes, BANKINDIA is showing clear signs of resuming its upward trajectory.
🔹 Risk–Reward Setup:
Risk: ~4%
Potential Upside: ~10%
The setup looks promising for momentum traders and positional players.
📌 Disclaimer: All posts are intended purely for educational and study purposes. Please consult your financial advisor before making any investment decisions. ⚠️
Making HH HL.
Closed at 40.45 (04-06-2025)
Making HH HL.
Bearish Divergence played well &
dragged the price from 44 - 45 to around 33.
Printed HL & started moving upside.
If 45 is Crossed & Sustained, we may witness
new Highs around 55 - 57.
However this time, Stoploss should be 33.50
on Closing basis.

ABFRL at Best Support !!This is the Weekly Chart Of ABFRL .
ABFRL having good Law of Polarity at 70 range.
ABFRL having EMA support at 72 range
If this level is sustain , we may see higher price in ABFRL ||
Based on time-wise analysis, our initial expected return is 40–42%, which the stock consistently forms beyond the Law of Polarity (LOP).
Thank You !!

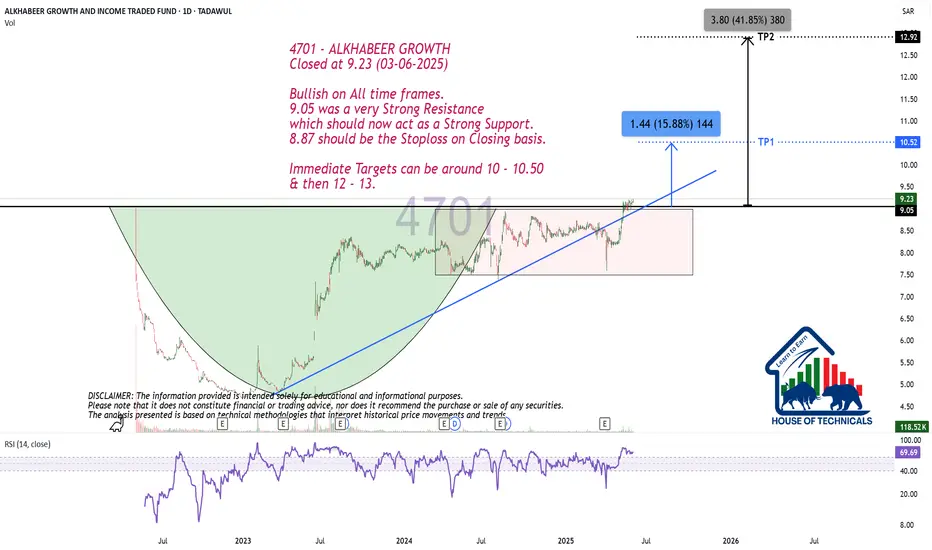
Bullish on All time frames.
Closed at 9.23 (03-06-2025)
Bullish on All time frames.
9.05 was a very Strong Resistance
which should now act as a Strong Support.
8.87 should be the Stoploss on Closing basis.
Immediate Targets can be around 10 - 10.50
& then 12 - 13.
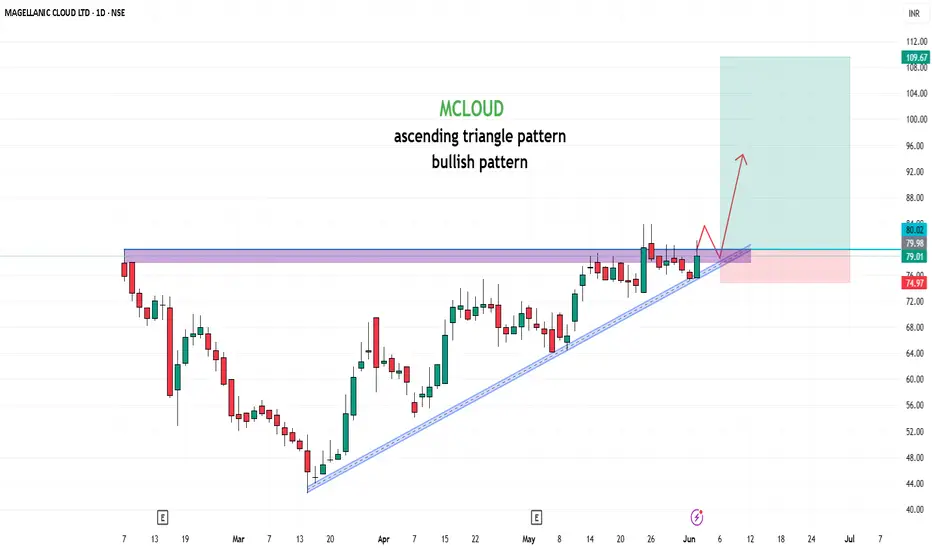
MCLOUD📊 Stock Analysis: MCLOUD
The stock has been consolidating within a ascending triangle pattern and is nearing a critical Buy Above level at ₹80 , signaling a potential breakout. The target is set at ₹179, offering a potential gain of 123.75%. Key insights:
Trend: A breakout above the wedge could indicate renewed bullish momentum.
Support Levels: Strong support around ₹75 , making this a low-risk entry point.
Volume Buzz: The recent increase in volume shows rising investor interest.
🔔 Keep an eye on this setup! Always analyze your risk tolerance before making any decisions.
📢 Disclaimer: This post is for educational purposes and not financial advice. Conduct your research or consult a financial advisor before investing.
What are your thoughts? Share them below! 📝
#StockTrading #TechnicalAnalysis #BreakoutTrading #MCLOUD
RELIANCEi Observed these Levels based on Price Action and Demand & Supply which is my own Concept "PENDAM CONCEPTS"... Please don't take any trades based on this chart/post... Because this chart is for educational purpose only not for Buy or Sell Recommendation... Thank Q

Bullish Trend this is my outlook on gold currently waiting for the four hour candle to close to determine if i will be short term selling with this pullback or the next push to my next level

BTC Analysis, Next Possible move!Btc is still bullish unless it breaks it structure (masked level) upon which I will swing short it. So far Monthly and Weekly still needs to close above previous local top otherwise this can turn into a top for BTC here. Will trade upon confirmation.

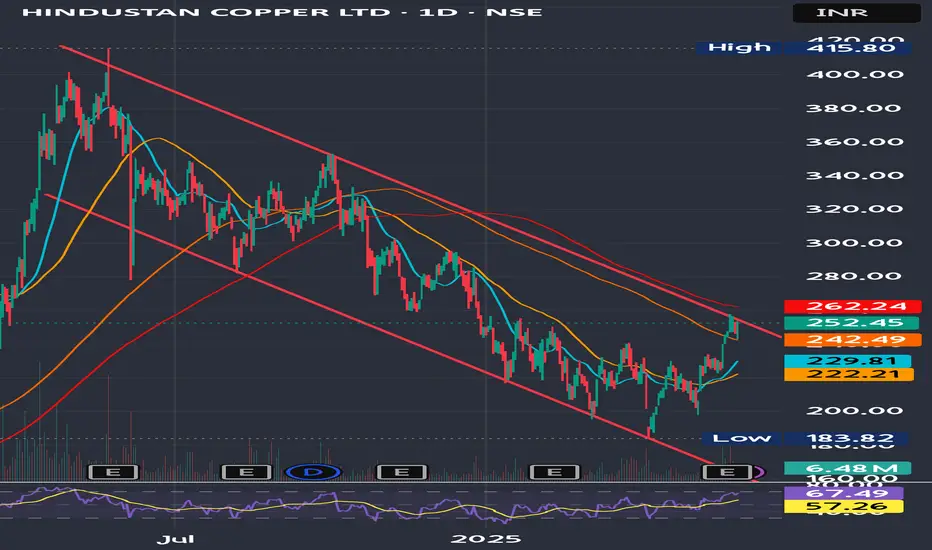
Hindcopper's Channel Breakout DueHindustan Copper Ltd. has recently garnered attention due to its strong financial performance and positive market sentiment.
Stock has broken out above key resistance around ₹240–₹245 with volume support.
Trend: Bullish
Indicators:
RSI ~67 (strong momentum)
MACD positive crossover
Above 50- & 200-DMA
Target Levels (Upside Potential)
Target Level Reason
270 Minor resistance zone (prior supply area)
292–295 Near-term swing high (Feb 2024 levels)
320+ Medium-term breakout target if momentum sustains
Stoploss Levels
Stoploss Type Level
Reason
Tight Stoploss 240 Previous breakout zone
Moderate SL 225 Near 50-day moving average
Positional SL 216 Breakdown confirmation below trend support
Buy on dips strategy around 245 -250 levels
AUDJPY Breakout Setup | Potential Long OpportunityHello Traders!
We're currently watching a textbook breakout setup forming on the AUD/JPY . After a prolonged consolidation phase, price has finally broken out of the descending trendline that has held for weeks.
🔍 Key Observations:
Consolidation Zone: Price moved sideways within a defined range, building up pressure.
Trendline Break: A clean breakout above the downtrend indicates momentum shift.
Resistance Level at 93.86: A crucial level to watch for confirmation.
Target Level: 95.62 – a significant resistance zone from previous highs.
📊 Trade Idea:
Buy above 93.86 once we see a strong retest or bullish confirmation.
Targets: 95.00 and 95.62.
Stop Loss: Below 93.30 (or as per your risk strategy).
⚠ Risk Management is Key! Always use appropriate stop losses and calculate position sizes based on your risk profile.
Let me know your thoughts below ⬇ Will AUD/JPY explode to 95.60? 🚀
#AUDJPY #Forex #BreakoutTrading #TechnicalAnalysis #TradingSetup #PriceAction

Cup and Handle Breakout in THOMAS COOK (INDIA) LTDTHOMAS COOK (INDIA) LTD is showing a classic Cup and Handle breakout pattern on the daily chart.
🔍 Chart Highlight
Breakout from the Cup's rim around ₹169.93 level.
Strong bullish candle with +7.61% gain, backed by higher volume.
Price sustained above the 200 EMA (₹163.85).
Next potential resistance: ₹197.29, a previous swing high.
Levels to Watch:
Support Zone: ₹163.85 – ₹169.93 (200 EMA + breakout retest zone)
Resistance Zone: ₹197.29 (next swing high)
If the price retests and holds above ₹169.93, it could offer a good risk-reward opportunity with ₹197+ as the near-term target. Keep an eye on volume and any pullback toward the breakout zone.
⚠️ Disclaimer:
This idea is for educational purposes only and not financial advice. Please do your own research or consult your financial advisor before making any trading decisions. Markets carry risk — trade wisely!

Fasten your seatbelts - China Southern Airlines to fly higherChina’s recent decision to grant visa-free entry to citizens of four Gulf Cooperation Council (GCC) countries—Saudi Arabia, Oman, Kuwait, and Bahrain—from June 9, 2025, is expected to significantly boost travel demand between China and the Gulf region.
Key benefits for China Southern Airlines:
> Increased passenger traffic from GCC countries for tourism, business, and cultural exchange.
> Opportunity to expand direct flight routes to major Gulf cities, enhancing its international network.
> Stronger hub positioning for cities like Guangzhou and Urumqi as gateways for Middle East–Asia connectivity.
> Improved load factors and revenue from both inbound and outbound travel, especially during peak seasons.
This policy complements earlier agreements with the UAE and Qatar, which already enjoy 30-day visa-free access, effectively making all GCC nations visa-exempt for short-term visits to China
Basis review of monthly chart, price has potential to retest level of 5.70 which is 46% upside from current level of 3.90. Price needs to breach the overhead resistance of 4 and sustain above it for multiple days for the upside momentum to kick in. However, this view is negated if price breaks below 3.20 level.

AADHARHFCi Observed these Levels based on Price Action and Demand & Supply which is my own Concept "PENDAM CONCEPTS"... Please don't take any trades based on this chart/post... Because this chart is for educational purpose only not for Buy or Sell Recommendation... Thank Q

BSOFTi Observed these Levels based on Price Action and Demand & Supply which is my own Concept "PENDAM CONCEPTS"... Please don't take any trades based on this chart/post... Because this chart is for educational purpose only not for Buy or Sell Recommendation... Thank Q
