M&Mi Observed these Levels based on Price Action and Demand & Supply which is my own Concept "PENDAM CONCEPTS"... Please don't take any trades based on this chart/post... Because this chart is for educational purpose only not for Buy or Sell Recommendation... Thank Q
Bullishsetup

render/usdtrender will not surrender lol
either way broke out of the wedge,
plus we got a tripple bottom, with the market starting to turn positive also the fear and greed grid was at extreme fear, time to buy and hold

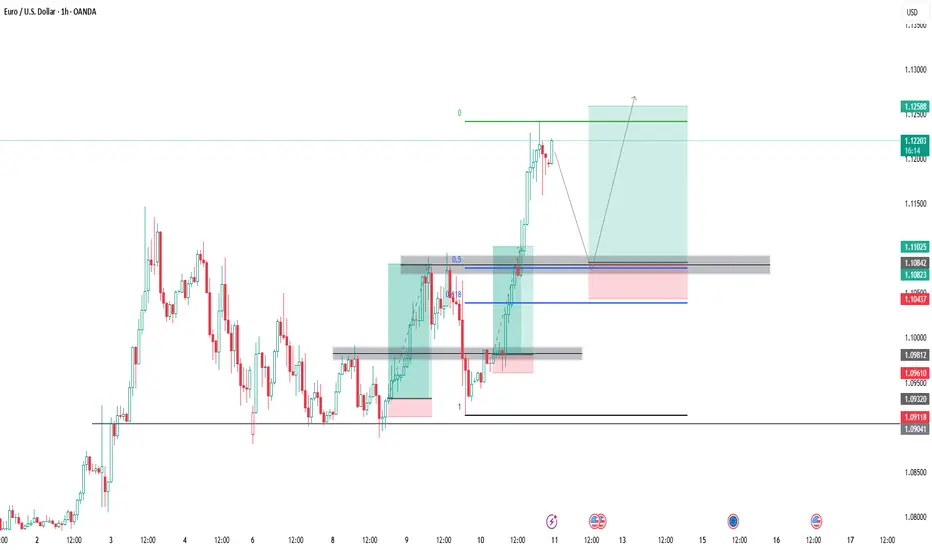
EUR USD Buy Continuation Trade SetupEUR USD has been very bullish so we keep looking for buying opportunities
Here is my idea on EU, bullish structure has been broken now lets wait for a retest then buy along with the trend, the retest level also align with the 0.50 - 0.618 Fib Retracement level
Road to 3200Gold had a strong 4hr timeframe rejection from the 2960-2980 zone.
Also had a triple bottom in the same area.
Showing super strong signs of another bullish run.
Gold is making the strong move up to the 3140 area once 3100 is broke.
Should get a small rejection off the 3140 zone before a strong push up to a new all time high.
Next all time high goal is 3200 🚀
Short Notes:
•Run up to 3140 (Small rejection/load up zone)
•Then Load up zone 3110-3100
•Take Profit area 3200
As always, trade safe during these high volatility times and go crush it!💰

BTC ANALYSIS📊 #BTC Analysis
✅There is a formation of Falling Wedge Pattern on 12 hr chart and currently trading around its major support zone🧐
Pattern signals potential bullish movement incoming after a breakout
👀Current Price: $78,150
🚀 Target Price: $84,900
⚡️What to do ?
👀Keep an eye on #BTC price action and volume. We can trade according to the chart and make some profits⚡️⚡️
#BTC #Cryptocurrency #TechnicalAnalysis #DYOR

BTC/USD Forming Bullish Falling Wedge – Potential Target📐 2. Technical Pattern – Falling Wedge
A falling wedge forms when the price consolidates between two converging downward-sloping trendlines. It suggests diminishing selling pressure and a likely reversal.
Key Characteristics in This Chart:
Upper Resistance Trendline: Formed by connecting the series of lower highs.
Lower Support Trendline: Formed by connecting the lower lows.
The price respects both boundaries, confirming wedge structure.
Volume generally decreases during the wedge (implied but not shown).
✅ Bullish Implication: Once price breaks above the upper resistance, it often triggers a sharp upward move due to the squeeze of supply and the build-up of demand.
🧱 3. Support and Resistance Zones
🔻 Resistance Zone:
Area: ~100,000 to ~108,000 USD
Marked as a wide horizontal band (beige-shaded area).
Previous price peaks and consolidations suggest this zone is strong supply.
Breakout above this zone could trigger momentum towards the higher target.
🔹 Support Zone:
Area: ~72,000 to ~75,000 USD
Historical reaction level where buyers previously stepped in.
Coincides with the lower wedge boundary and recent bounce points.
Repeated tests strengthen this as a reliable accumulation zone.
🎯 4. Trade Setup Strategy
💼 Entry Strategy:
Trigger: A confirmed breakout above the wedge’s upper trendline (black diagonal line).
Confirmation: A strong bullish daily close above the trendline, ideally with volume spike.
The current price (~77,130) is near the lower boundary—offering a potential early entry or low-risk setup with a tight stop.
📌 Stop-Loss Placement:
Level: 70,916 USD
Below the wedge’s lower support and beneath the broader support zone.
Ensures exit if the pattern fails or bears regain control.
🧭 Target Projection:
Target Price: 114,562 USD
Based on the height of the wedge projected from the breakout point, a standard wedge breakout measurement.
Aligns with historical highs and psychological resistance.
🧮 Risk-Reward Ratio: Assuming entry around 77,130:
Risk (Stop-Loss): ~6,200 points
Reward (Target): ~37,432 points
R:R Ratio ≈ 1:6 – Highly favorable
⚙️ 5. Market Psychology & Price Action Insight
The falling wedge pattern suggests exhaustion of sellers.
Buyers are defending the support zone aggressively—creating higher lows within the wedge.
Each bounce is slightly more aggressive, indicating growing bullish sentiment.
A breakout from the wedge could act as a catalyst for rapid price acceleration as sidelined bulls enter and shorts cover.
📊 6. Summary of the Setup
Component Detail
Pattern Falling Wedge (Bullish)
Timeframe 1-Day Chart
Entry Point Breakout above upper trendline
Stop Loss 70,916 USD
Target 114,562 USD
Support Zone 72,000–75,000 USD
Resistance Zone 100,000–108,000 USD
Risk/Reward Approx. 1:6
Bias Bullish
📌 Final Thoughts
This setup provides a technically sound opportunity with clear invalidation (stop loss) and a well-defined profit target. The risk-to-reward ratio is attractive, and the price structure suggests a bullish reversal is likely, pending a confirmed breakout.

Bitcoin Bullish Idea I'll be buying for that point of interest 78544.71 if I see confirmation for reversal. Though H8 zone 79100.20 looks valid too as the price has triggered it and rejects it awesomely.
My projection is this new week is going to be Bullish not just for Bitcoin but some other. Crypto pairs too.
I'm bullish on Eth as well.
Kindly boost if you find this insightful 🫴

Cup & Handle Pattern on EUR/USD – Bullish Breakout Setup🏗️ 1. Pattern Structure Breakdown
🔵 Cup Formation:
The left side of the chart illustrates a steep decline beginning around mid-October 2024, forming the left lip of the cup.
The bottom of the cup was established between late December 2024 and early February 2025, where the market found a strong support level near 1.0220.
A rounded bottom formed, which indicates accumulation and decreasing bearish momentum.
The right side of the cup shows a strong bullish reversal from the support zone, gradually returning to the previous highs around 1.1050–1.1100, completing the cup shape.
⚫ Handle Formation:
A slight pullback or consolidation occurred after reaching the resistance zone, forming the handle between late March and early April 2025.
This handle appears as a small descending channel or flag, which is typical for this pattern.
Price remained above the support trendline, showing strength in the handle without breaking the overall bullish structure.
🔍 2. Key Technical Zones
📌 Resistance Level (Breakout Zone): 1.1050 – 1.1100
Marked by prior price rejection and the top of the cup.
The successful breakout above this zone confirms the cup and handle breakout.
📌 Support Level: 1.0220 – 1.0300
This zone provided a base during the cup’s rounding bottom and serves as a critical demand area.
📌 Stop Loss: 1.07380
Positioned below the recent swing low (handle low), providing a safe buffer.
This placement respects both market structure and risk management.
🎯 3. Target Projection
✅ Price Target: 1.14780
Based on the measured move technique:
Measure the depth of the cup (approx. 1.1100 - 1.0220 = 880 pips).
Project that distance above the breakout point (around 1.1050).
Target = 1.1050 + 0.0880 = 1.1930 (but a conservative target of 1.14780 is used here).
This target aligns with a previous resistance level from mid-2023, adding confluence.
📈 4. Trade Setup Summary
Component Description
Pattern Cup and Handle (Bullish Continuation)
Entry Point Breakout above 1.1050 resistance
Stop Loss Below 1.0738 (recent low)
Target 1.1478 (based on measured move)
Risk/Reward Ratio Approx. 1:2.5 or better
💡 5. Technical Insights and Confluence
Volume Consideration (if available): Typically, volume decreases during the cup and increases during the breakout. Although volume is not shown here, this pattern suggests accumulation.
Handle Behavior: The handle did not breach the mid-point of the cup, maintaining a strong bullish structure.
Market Sentiment: Given the steady incline and the bullish breakout, it suggests buyers are in control.
🏁 Conclusion
This is a textbook Cup and Handle breakout setup on the EUR/USD daily chart. The structure shows a clear transition from bearish to bullish sentiment, accumulation at support, and a confirmed breakout with strong potential upside.
It offers an excellent long opportunity with favorable risk-reward, clear invalidation, and a historically reliable price pattern.

COTI ANALYSIS 📊 #COTI Analysis
✅There is a formation of Descending Channel Pattern in weekly time frame in #COTI.
Also there is a perfect breakout and retest. Now we can expect a bullish move from major support zone. If not the we will see more bearish move and then a reversal in #COTI.
👀Current Price: $0.06390
🎯 Target Price : $0.08660
⚡️What to do ?
👀Keep an eye on #COTI price action and volume. We can trade according to the chart and make some profits⚡️⚡️
#COTI #Cryptocurrency #Breakout #TechnicalAnalysis #DYOR

#LAYERUSDT setup remains active 📉 LONG MEXC:LAYERUSDT.P from $1.5722
🛡 Stop loss: $1.5440
🕒 Timeframe: 1H
✅ Market Overview:
➡️ The coin is showing "its own game" — price action is independent of #BTC and #ETH, reacting to internal volume dynamics.
➡️ Ascending triangle breakout with a confirmed close above the key $1.5440 zone.
➡️ Empty space ahead — no major resistance levels until $1.6060–$1.6210.
➡️ Accumulation is forming between $1.5440–$1.5700 — a breakout may follow.
➡️ Important: candles must close above $1.5440 to confirm the long scenario.
🎯 TP Targets:
💎 TP1: $1.5880
💎 TP2: $1.6060
💎 TP3: $1.6210 (full measured move from triangle pattern)
📢 Recommendations:
If volume MEXC:LAYERUSDT.P increases during a breakout above $1.5722 — expect a rapid move.
If price pulls back — the $1.5254 area could offer a second entry opportunity.
The coin looks strong but slightly overbought — partial take profit at TP1 is advised.
📢 A strong breakout above $1.5700 may lead to a sharp move due to lack of resistance.
📢 Avoid 1H candle close below $1.5440 — scenario invalidation.
📢 If the move occurs on weak volume — watch for a potential reversal near TP1.
🚀 MEXC:LAYERUSDT.P setup remains active — holding the key level could lead to a move toward TP2–TP3!

$OBLG #OBLG BUY ALERT FOAT IS LOCKED, $17.6+ then $60+ INCOMING!NASDAQ:OBLG #OBLG NASDAQ:OBLG My name is Landon Wogalter & this is the next NYSE:GME #GME NYSE:GME / NYSE:HKD #HKD NYSE:HKD type move, I am also the reason that NASDAQ:CHSN #CHSN NASDAQ:CHSN went to $44 that I called & locked the float from <1.80 & called for $30+, & even emailed the company in August 24’ stating that their stock would see $30+.
Oblong price targets are as follows:
17.6+ , 60+, 150+, 2900 past 404< #FLOAT IS #LOCKED THERE IS NO OTHER SET UPS LIKE THIS ON THE MARKET AND NEVER HAS BEEN. #ZERO #DEBT OBLG wants #parabolic (This is not promotion nor/or financial advice😘) I’m your daddy forever & ever.

Cup & Handle Formation!Bearish Divergence on Daily & Weekly TF.
Now Strong Resistance is around 119500.
Cup & Handle Formation appearing at the Top.
Support Levels mentioned.

No Bearish Divergence Yet!Bullish on Monthly TF.
Though HL Confirmed on Bigger TF but Important
to Cross & Sustain 730 & if this level is Crossed with
Good Volumes, we may witness 770 - 775 initially.
On the flip side, 640 - 645 may act as Immediate
Support.
It should not break 608, otherwise we may witness
more Selling Pressure towards 550 - 570.

It's about to explodeThe British Pound looks very strong across the board. Check my post of GPBCHF lines below. Is forming a bullish flag at the monthly resistance to break it up violently. If it pulls back I'll add more. SL triggers is a weekly candles closes under the bottom of the flag but I hardly doubt it. I'm almost all in on the British Pound.

CADJPY Multi-Timeframe Price Analysis: Trade SetupIn this video, we analyse the CADJPY across multiple timeframes (4H, 1H, and 15M) to identify a high-probability long trade setup based on structural price action, momentum shifts, and Fibonacci retracement levels.
🔍 4H Analysis (Momentum High Formed)
The CADJPY has shown a strong bullish recovery on the 4-hour chart, forming a Momentum High — a key signal that often precedes price movement. According to the principle "Momentum Precedes Price," we anticipate a corrective pullback to form a Higher Low (HL). This HL is expected to become a decision point for buyers looking to join the uptrend.
⏱ 1H Analysis (Confirmation of Structure)
On the 1-hour timeframe, price has formed a Higher Market Low (ML), confirming the structural HL observed on the 4H chart. Price has now entered the Fibonacci Buy Zone, providing a high-probability entry area for bullish trades.
📉 15M Analysis (Failure Setup & Entry Trigger)
The 15-minute chart shows a Failure to Make a Lower Low (LL). While a higher low is a positive sign, confirmation comes only after a break above the last Lower High (LH) that failed to produce a new low. We’re watching for a break above 104.128 to confirm this failure setup and trigger our long entry.
🎯 Trade Setup
✅ Entry: Long above 104.128
🛑 Stop Loss: Below London session low at 103.74 ± 5 pips
🎯 Targets:
T1: 106.92
T2: 108.64
💬 Wishing you a successful trading week! Don’t forget to like, comment, and follow for more technical analysis and trade ideas.

10-20% upside possible in fortis health Fortis health chart is too strong.. in daily chart & in weekly chart they creat very bullish patterns.
Buy fortis health at 650-668
Target 727 749 835
Sl 600

Gold (XAU/USD) Bullish Retest SetupMarket Structure & Analysis:
Uptrend Confirmation: Price has been in a strong bullish trend, forming higher highs and higher lows.
Resistance & Retest: The price recently hit a resistance zone around $3,054 and pulled back for a retest.
Support Zone: A key support level is marked at $3,010, which has held multiple times.
Bullish Retest Setup: If the price successfully retests this support level and confirms bullish momentum, we can anticipate a potential move toward the next resistance level.
Target Levels:
First Target: $3,054 (recent high)
Final Target: $3,089 (next major resistance)
Trading Plan:
Buy Setup: Enter after confirmation of bullish price action at the support level ($3,010).
Stop Loss: Below $3,010 to avoid false breakouts.
Take Profit:
TP1: $3,054
TP2: $3,089
Risk Factors:
If the support at $3,010 breaks, price may drop toward the next major support at $2,911, invalidating the bullish setup.
Economic events (such as FOMC meetings, CPI data, or geopolitical risks) may cause unexpected volatility in gold prices.

Ethereum (ETH/USD) Bullish Breakout – Eyes on $2,500+ Target 📈 Chart Overview:
Timeframe: 4H (Ethereum/USDT)
Trend Reversal: Ethereum has broken out of a falling wedge pattern, indicating a shift from bearish to bullish momentum.
Support Level: Around $1,800 - $1,900, where price previously found strong buying interest.
Retest Confirmation: ETH successfully retested the breakout level (~$2,020), confirming a potential bullish continuation.
Resistance Zone: The next key resistance area is around $2,250, followed by a potential move towards the $2,530 - $2,550 target zone.
📊 Trade Setup:
Bullish Bias: Price action suggests an upward move towards $2,250 and potentially $2,530.
Risk Management: A stop-loss can be set below $2,020 to minimize downside risk.
🔥 Conclusion: If Ethereum maintains momentum above the retest zone, it could see a strong rally in the coming days! 🚀

#BERAUSDT shows bullish momentum 📈 Long BYBIT:BERAUSDT.P from $8.080
🛡 Stop loss $7.905
🕒 1H Timeframe
⚡️ Overview:
➡️ The main POC (Point of Control) is at 6.699, indicating the area of highest volume accumulation.
➡️ The 7.905 level acts as the nearest support zone and is a key stop-loss reference point.
➡️ The chart BYBIT:BERAUSDT.P shows a strong bullish breakout with consolidation above previous range, signaling a possible trend continuation.
➡️ Rising volume confirms strength behind the move.
🎯 TP Targets:
💎 TP 1: $8.204
💎 TP 2: $8.320
💎 TP 3: $8.430
📢 Watch key levels closely — better to enter after signal confirmation!
📢 If the price holds above $8.080, the TP targets are likely to be hit.
📢 If stop level is breached, the setup may need reevaluation.
BYBIT:BERAUSDT.P shows bullish momentum — looking for further upside!

Daily bias for Spot gold #xauusd I have spotted an absolute Low so we should definitely see some bullish pressure on gold for the rest of the day
Take a look at my markup as I have marked previous day high and low and from experience determined that the previous days low is an absolute low so we should definitely see some bullish pressure building up as the day goes on.

Trading Setup for CHF/USD – Triple Bottom Breakout Strategy📌 Chart Pattern: Triple Bottom with Trendline Breakout
This CHF/USD chart showcases a triple bottom formation, a bullish reversal pattern that signals a potential uptrend after three consecutive lows at a strong support level. The price action respects this support zone and attempts a trendline breakout, suggesting a shift in momentum from bearish to bullish.
📊 Full Chart Breakdown & Professional Analysis
1️⃣ Key Levels & Structure:
✅ Support Level (1.1300 - 1.1270):
The price has tested this region three times, indicating strong buying interest.
This forms a triple bottom, a reliable reversal pattern in technical analysis.
✅ Resistance Zone (1.1400 - 1.1420):
The price previously reversed from this zone, making it a key short-term resistance level.
✅ Target Level (1.1457):
A breakout above resistance could drive the price toward this measured move target, representing a 1% potential gain.
✅ Stop Loss (1.1269):
Placed below the support zone to minimize risk in case of a breakdown.
2️⃣ Price Action & Trendline Breakout:
📌 Triple Bottom Formation:
Price hits the same support level three times, signaling strong demand.
Each bounce from support indicates a gradual weakening of bearish momentum.
📌 Trendline Breakout:
The price broke a downward-sloping trendline, suggesting a potential bullish move.
A successful retest of the trendline could confirm further upside.
📌 Expected Move:
Scenario 1: Price confirms the breakout, retests, and moves toward resistance.
Scenario 2: If resistance is broken, price targets the next major level at 1.1457.
3️⃣ Trading Strategy – How to Trade This Setup?
🎯 Buy Entry:
Enter long after a confirmed breakout and retest of the trendline.
📉 Stop Loss:
Below 1.1269 (beneath triple bottom support) to limit downside risk.
🎯 Take Profit Targets:
Target 1: 1.1400 (Resistance Area)
Target 2: 1.1457 (Measured Move Projection)
💡 Risk-Reward Ratio:
Favorable risk-reward ratio of 1:3, making it an attractive setup for traders.
4️⃣ Market Psychology Behind This Move:
Bears losing strength: Multiple failed attempts to break support indicate sellers are exhausted.
Bulls gaining momentum: Trendline breakout shows buyers are stepping in with confidence.
Breakout confirmation: If resistance breaks, a strong rally toward 1.1457 is likely.
📌 Summary: Bullish CHF/USD Trade Idea
🔹 Pattern: Triple Bottom + Trendline Breakout
🔹 Entry: Buy on retest confirmation
🔹 Stop Loss: 1.1269
🔹 Target: 1.1400 & 1.1457
🔹 Risk-Reward: Favorable 1:3 setup
🚀 This is a high-probability trade setup with strong technical confirmation, making it a great opportunity for breakout traders! 🚀

#VANAUSDT is forming a confident bounce from key levels📉 LONG BYBIT:VANAUSDT.P from $8.180
🛡 Stop loss $8.000
1H timeframe
❗️Before entering the trade, closely monitor the levels. If the price consolidates above $8.180 with volume, this confirms the entry signal.
✅ Overview BYBIT:VANAUSDT.P :
➡️ On the chart, we can see that after a downward movement, the price formed a local bottom around $8.000, followed by an upward impulse.
➡️ A structure resembling a reversal pattern has appeared: the price broke through a slanted resistance (blue line) and consolidated above $8.180, indicating weakening sellers.
➡️ The price is now moving toward a resistance zone marked as POC (Point of Control) at $8.353, which could be the first target.
➡️ The entry is set at $8.180, aligning with the breakout level, supported by increasing volume and a short-term uptrend.
The volume profile on the left shows a low-liquidity zone above the current price (between $8.345 and $8.590), which may allow the price to quickly reach the TP levels.
🎯 TP Targets:
💎 TP 1: $8.345
💎 TP 2: $8.590
💎 TP 3: $8.775
⚡️ Plan:
➡️ Monitor the price reaction at TP1 ($8.345) — a pullback is possible. It’s recommended to close part of the position.
➡️ Wait for confirmation of the breakout above $8.180 (already happened, price is above).
➡️ Enter LONG after a retest (with volume) — in this case, the retest has already occurred, and the price is moving up.
➡️ Place the stop below the last low — at $8.000.
BYBIT:VANAUSDT.P is forming a confident bounce from key levels, and if it holds above the entry zone, we expect an upward movement!

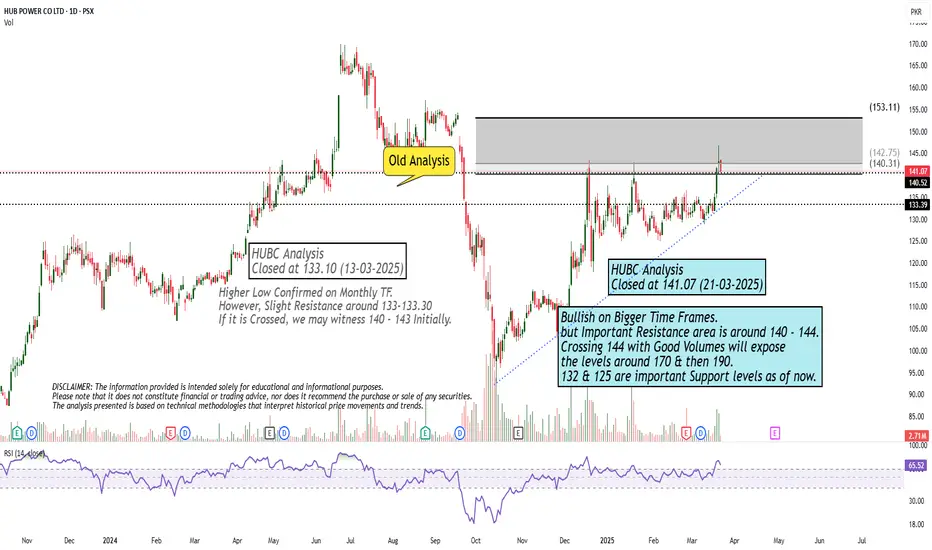
Bullish on Bigger Time Frames.Bullish on Bigger Time Frames.
but Important Resistance area is around 140 - 144.
Crossing 144 with Good Volumes will expose
the levels around 170 & then 190.
132 & 125 are important Support levels as of now.