Sklz bull pendant!?5.60 by weds could be Monday if proper momentum
Let's go paradise and skillz holdinglong been here since 2020 and I. Not FKN leaving sklz to moon weekly chart Goals 156usd per share
Where my longs at! Not financial advice
Bullishtrendpattern

Gold Hits Fibonacci 3.618! What’s Next?GOLD (XAU/USD) Quick Analysis – April 2025
Gold just surged to $3,329/oz, reaching the Fibonacci 3.618 extension around $3,338 🚀
The trend remains strongly bullish, but the price is now extended far above key moving averages – signaling potential exhaustion.
Key Levels:
Support: $2,856 (Fibo 2.618)
Next Resistance: $3,635 (Fibo 4.236)
🧭 Outlook:
As long as price holds above $2,856 → the bullish structure remains intact
🎯 Strategy:
Wait for a healthy pullback → buy the dip near support
Or enter on a breakout-retest above $3,338 for potential continuation

"Bitcoin Breakout Setup: Potential Rally Towards $94K!"Key Observations:
Support Zone: A crucial support level is marked below the broken channel, indicating a potential area for a price reversal.
Bullish Projection: A breakout above this support level could push BTC higher towards the target price of 94,101.24 USD.
Technical Patterns: The price initially showed a strong downtrend, followed by a recovery forming an ascending channel, and now a potential bullish breakout is expected.
Trading Plan:
Bullish Scenario: If BTC holds above the support level, a strong move upwards toward 94,101.24 USD could be expected.
Bearish Scenario: A failure to hold support could result in further downside toward lower key levels.
Conclusion:
Traders might look for buying opportunities near the support zone with a potential upside target of 94,101.24 USD while managing risk in case of further breakdown.
Would you like to refine this further or add specific indicators? 🚀

Bitcoin Breakout | Bullish Momentum Building Towards $98K+Key Observations:
Ascending Channel: BTC has been trading within an upward-sloping structure, confirming bullish momentum.
Retest Level: The price has pulled back to the trendline for a retest, a crucial confirmation point before potential upside continuation.
Target Projection: The expected breakout move suggests a 13.69% increase, targeting $97,467 - $98,630 levels.
Support Levels: Key supports are around $85,335 - $84,474, which could act as a safety zone if price rejects the breakout.
Trading Plan:
Bullish Bias: A successful retest and bullish confirmation could propel BTC to the $97,467 - $98,630 resistance zone.
Invalidation: A drop below the support zone near $84,474 may invalidate this bullish outlook.
Conclusion:
BTC/USD is displaying strong bullish potential, with a well-formed ascending structure and a possible breakout move. Traders should watch for confirmation of the trendline retest before entering long positions.

XAU/USD (Gold Spot / U.S. Dollar) 4-hour analysis,XAU/USD (Gold Spot / U.S. Dollar) 4-hour analysis with various technical indicators:
• Ascending Channel: Price is moving within an upward channel, highlighted in blue.
• Black Dots: Indicate possible resistance or swing high points.
• Blue Dots: Represent potential support levels or swing low points.
• Red Zone: Around 2,883.157, acting as a key support area where price might bounce.
• Entry Zone: Around 2,942.206, where a breakout or rejection could occur.
• Targets:
• 3,001.973
• 3,025.000
• 3,050.210
This chart suggests that gold is trading within a rising channel, moving towards resistance. A breakout above the channel could signal further bullish momentum, while a move downward might test the red zone as a support level.

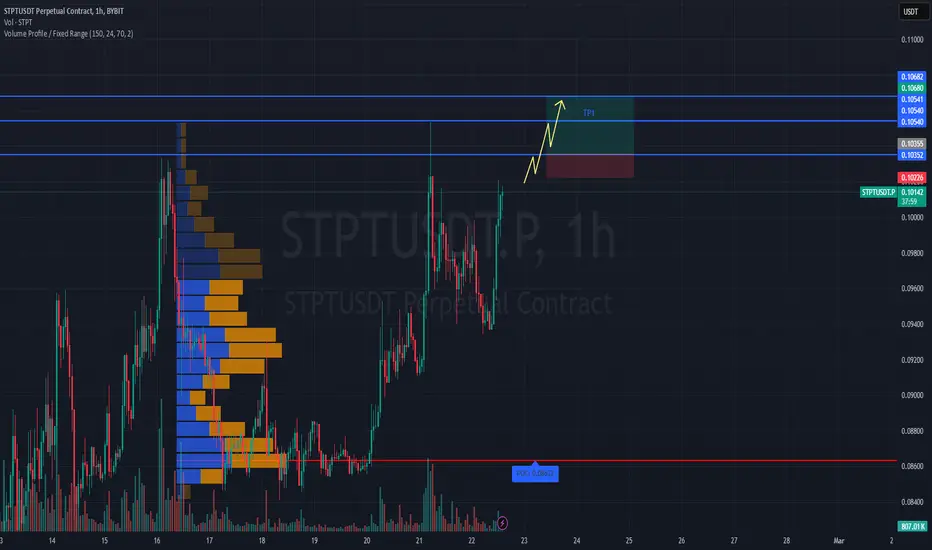
#STPTUSDT maintains bullish momentum📈 LONG BYBIT:STPTUSDT.P from $0.10355
🛡 Stop Loss: $0.10226
⏱ 1H Timeframe
✅ Overview:
➡️ BYBIT:STPTUSDT.P is showing strong bullish momentum after consolidating at lower levels, indicating buyer presence.
➡️ Volume Profile suggests that the main liquidity (POC) is positioned significantly below the current price, confirming demand dominance.
➡️ A breakout above $0.10355 and holding above this level will validate the bullish continuation.
➡️ The nearest resistance zone is between $0.10540 and $0.10680, where partial profit-taking may occur.
⚡ Plan:
➡️ Long entry upon breaking $0.10355, confirming buyer strength.
➡️ Stop-Loss at $0.10226—placed below the nearest support to minimize risk.
➡️ Main target range: $0.10540–$0.10680, where selling pressure might emerge.
🎯 TP Targets:
💎 TP 1: $0.10540
🔥 TP 2: $0.10680
🚀 BYBIT:STPTUSDT.P maintains bullish momentum — expecting further upside!
📢 BYBIT:STPTUSDT.P remains within an uptrend. If the price consolidates above $0.10355, further acceleration is expected.
📢 Volume suggests strong buyer activity, supporting the bullish outlook.
📢 However, the $0.10540–$0.10680 zone could act as a profit-taking level, so monitoring price action and partial profit-taking is advisable.
#POPCATUSDT Expecting further bullish continuation📈 LONG BYBIT:POPCATUSDT.P from $0.2850
🛡 Stop Loss: $0.2760
⏱ 1H Timeframe
✅ Overview:
➡️ BYBIT:POPCATUSDT.P is showing strong bullish movement, breaking above key resistance at $0.2778, confirming buying interest.
➡️ The $0.2778 - $0.2850 zone now acts as a support, and if the price holds above it, further upside is likely.
➡️ The first major resistance level is at $0.2900, followed by $0.2989 and $0.3100 if the momentum continues.
➡️ Volume remains high, indicating strong liquidity and potential for further growth.
⚡ Plan:
➡️ Enter LONG after confirming a breakout above $0.2850, reinforcing bullish momentum.
➡️ Risk management with Stop-Loss at $0.2760, below key support.
➡️ Key upside targets:
🎯 TP Targets:
💎 TP1: $0.2900 — first take-profit level.
🔥 TP2: $0.2989 — potential resistance.
⚡ TP3: $0.3100 — major upside target.
🚀 BYBIT:POPCATUSDT.P - Expecting further bullish continuation!
━━━━━━━━━━━━━━━━━━━━━━
📢 BYBIT:POPCATUSDT.P is maintaining bullish momentum, and a breakout above $0.2850 could confirm further upside movement.
📢 Watch for price action at $0.2900, as this level might act as short-term resistance.
📢 If the price holds above $0.2989, a strong push towards $0.3100 is possible. However, a drop below $0.2760 would invalidate the bullish setup.

XAU/USD Longs from 2,696.000 back upMy analysis for GOLD this week focuses on the continuation of the strong bullish trend. GOLD has shown impulsive movement and reacted perfectly to the demand zone I marked out last week. This reaction led to a break of structure to the upside, further confirming the bullish direction.
Now, with new demand zones formed, I’ll be waiting for the price to retrace back to either the 1-hour or 3-hour demand zone before the next bullish rally. From there, I plan to buy up to the Asian high, which is positioned just above the nearest supply zone.
Confluences for GOLD Buys:
- Price reacted strongly off last week’s demand zone and remains bullish.
- Both the short-term and long-term trends are bullish.
- Price has broken structure to the upside again, confirming direction.
- An Asian high above needs to be taken, providing a clear target.
Note: If the price moves up first, I may consider a quick sell from the 1-hour supply zone. However, I’ll wait for additional confirmations before taking any counter-trend trades.

<0RN - strategic long tradeAs discussed in another idea on TradingView () I expect the corn price to rise. To participate in this rise, one might use this leveraged ETF. The buy order could be placed above the former local high as seen on the chart.

Bullish End of Year?This chart shows the price development of Alphabet (Google). Since reaching its high in July, the stock has been in a downward correction. However, it now appears that this correction may be ending. The price has formed a higher low, which could serve as the right shoulder in an inverse Head & Shoulders pattern.
Additionally, the SMAs are bullishly aligned once again. If the price breaks above the 38.2% Fibonacci level, I anticipate a bullish move toward the end of the year.

USD/JPY - Bullish Trend ContinuationThis morning, the focus is on the Dollar-Yen pair. The bullish trend is evident across all timeframes. Yesterday, we observed a strong break of the reversal structure at 161.269 after reaching a momentum high of 161.95. This break is crucial for the continuation of the bullish trend. Following the break, a bullish pattern has formed, and the price has moved into the Fibonacci buy zones of the initial move. Given this setup, the high probability action is to buy or do nothing above 161.57.
Stop Loss: 161.14
Target 1: 162.35
Always think in probabilities.

EUR/USD Intra Day/Week Play 28/05/2025On the monthly we are currently witnessing the formation of a descending trangle in preparation for a breakout to the upside if we cross 1.13093 or to the downside if we cross 1.04898. This level has been mitigated back in July 2022 taking all buy side liquidity in the process beofre returning to create the new support level to begin a new wyckoff accumilation pattern.
On the weekly we can see that price has been ranging btween 1.10082 (highs) and 1.07237 (lows)
When we head down to the 4 hour we can see that price has mitigated the previous 4hr bearish order block to then form a break out to the downside, it then returned to the break out levels further claiming all the sell side liquidity in the zone and is preparing for a move downward to fill the imbalance @ 1.07953 and tap into either the bullish order block at 1.07876 or 1.07459
This upward movement is also supported by the bearish candle crossing the 20ema to test 100ema with a pisitive reaction to the upside on the 4hr indicating strong buying interest.
In this scenario, we would look for an entry at 1.07856 with a stop loss at 1.07117 and take profits at 1.10107 securing a nice 1:3 Risk to Reward.
Let me know what you guys think.
Hope you have a great week ahead.
Happy Trading.

🚀 #LRC/USDT Ready to Soar! Join the Rally Now! 📈🔥Attention all traders! 🚨 It's time to jump on the #LRC/USDT rocket ship! Loopring is showing impressive potential, and we're in for an exhilarating ride. Don't miss out on this opportunity to join the rally! 📊🚀
Chart Analysis:
Pair: LRC/USDT
Timeframe: Daily
Key Observations:
Bullish Momentum: Loopring (LRC) has been demonstrating significant bullish momentum lately. The price is on the rise, indicating strong market interest. 📈💥
Support Zone: There's a solid support zone in place, suggesting a robust foundation for potential upward movement. 🧱🚀
Technical Breakout: A recent technical breakout is a positive sign, indicating a potential surge. 🚀📊
Trading Plan:
Entry: Consider entering a long position now while the price is on the rise. Look for confirmation of the bullish trend. 📈🔥
Stop Loss: Implement a well-placed stop loss to manage risk effectively. Protect your capital. 🛡️💰
Take Profit Targets: Set profit targets based on your trading strategy and risk tolerance. Be prepared for both short-term and long-term scenarios.
#Loopring #CryptoRally #BullishTrend #LRCAnalysis #Cryptocurrency #TradeSmart #CryptoTrader
Disclaimer: This is not financial advice. Make sure to do your research and consider consulting with a financial advisor before making any trading decisions. Always use proper risk management strategies.
Get ready for an exciting journey with Loopring! Join the conversation in the comments and share this post with your trading buddies. Let's make this analysis go viral! 🚀🔥💹
Note: TradingView posts are for educational and informational purposes only. Remember to conduct your research and employ proper risk management when trading cryptocurrencies. 📚📊

Are we forming a Bull Flag in Carvana?Hi guys! This is a quick analysis on my opinions on a current chart pattern that may be playing out in Carvana (CVNA).
At first glance you can notice the formation of a Bull Flag on the 1 Week CVNA chart.
As you can see we have had our Sharp price move to the Upside, almost resembling a straight line up. This is known as the Flagpole. The Volume spike seen in this move is supportive of this phase.
Followed by a pause or sideways action resembling a parallelogram. Here we see diminishing Volume, which is supportive of this phase as well.
This pause is to consolidate/ take a break from such a massive uptick in price during formation of the flagpole.
Flag patterns are known to be one of the most reliable continuation patterns and are said to rarely lead to Reversal of Trend.
Currently we are in the process, on our current Daily Candle of trying to breakout.
But we are meeting with Serious Resistance, depicted by a MASSIVE Upper Wick. Ideally, i'd like to see a larger body at the close of today's candle.
Could this still lead to a break out? Well one thing to check is the VOLUME.
For a breakout to occur we need to see a Massive Spike in VOLUME.
Which we have not seen yet.
Could be warning for a test back down to the lower rim of the parallelogram. This would also lengthen the time spent in forming this pattern.
Also note that Flag patterns are normally short term patterns and shuold breakout within 1 to 3 weeks, as per theory.
We are currently 8 bars in on the weekly chart indicating 8 weeks of consolidation.
This is Not Textbook. Which has me second guessing if this is a Bull Flag.
We have so much Resistance Above us, and the massive sharp move from $3, didnt create strong market structure. This in my opinion could lead to a collapse of current move with a massive correction.
Continue to monitor this. Remember to trade a Bull Flag:
You must wait for a breakout with CONFIRMATION before you take positions.
I would personally not take a trade inside the pattern. Watch for signs of rejection here as well.
__________________________________________________________________________________
Thank you for taking the time to read my analysis. Hope it helped keep you informed. Please do support my ideas by boosting, following me and commenting. Thanks again.
Stay tuned for more updates on CVNA in the near future.
If you have any questions, do reach out. Thank you again.
DISCLAIMER: This is not financial advice, i am not a financial advisor. The thoughts expressed in the posts are my opinion and for educational purposes. Do not use my ideas for the basis of your trading strategy, make sure to work out your own strategy and when trading always spend majority of your time on risk management strategy.

📉 GALA/USDT Falling Wedge Setup! 📉📈 #GALAUSDT is forming a promising Falling Wedge pattern on the chart, signaling a potential bullish reversal! 🚀
📉 The price has been creating lower highs and lower lows, shaping the falling wedge pattern. This suggests a period of consolidation and diminishing selling pressure.
🧩 Falling wedges often lead to upward breakouts, indicating a potential trend reversal and the start of a new bullish phase.
💡 Watch closely the resistance and support levels within the wedge to gauge the possible breakout direction.
📊 Technical indicators are showing signs of a potential reversal, providing additional support for a bullish scenario.
🔔 Be on the lookout for a breakout above the upper trendline, which could be a signal for the beginning of a bullish trend. Set your targets and stop-loss levels accordingly.
📅 Remember to manage your risk wisely and trade responsibly. Always conduct your own research before making any trading decisions.
🚨 Exciting times ahead for #GALA! 🚨 Let's see how this Falling Wedge unfolds! 🤞
(Note: This post is for informational purposes only and should not be considered as financial advice. Trading involves risks, and past performance is not indicative of future results. Always conduct your due diligence and seek professional advice if needed.)
#CryptoTrading #TechnicalAnalysis #BullishSetup #TradeSmart #DYOR #CryptoMarket #ChartAnalysis #EmbraceTheWedge #BullishTrend 🚀📈💹

Nifty 19800 Inverted Head & Shoulder above 19720Nifty Target 19800
Inverted Head & Shoulder above 19720 active
Fibb Retracement from 50%

Ethereum Short Term Buy IdeaD1 - Bullish trend pattern followed by a correction in the form of double wave down.
Price respected a strong support zone and bounced higher.
Most recent downtrend line breakout.
H4 - Bullish trend pattern.
Currently it looks like a pullback is happening.
Until the two strong support zones hold my short term view remains bullish here.

EURAUD Short Term Buy IdeaH1 - Bullish trend pattern.
Currently it looks like a pullback is happening.
No opposite signs.
Until the two strong support zones hold my short term view remains bullish here.

EURAUD - Looking To Buy Pullbacks In The Short TermH1 - Bullish trend pattern.
Higher highs.
No opposite signs.
Until the two strong support zones hold my short term view remains bullish here and I expect the price to move higher further after pullbacks.

EURCHF - Looking To Buy Pullbacks In The Short TermH1 - Bullish trend pattern.
Higher highs.
Currently it looks like a correction is happening.
Until the two strong support zones hold my short term view remains bullish here.

EURNZD - Looking To Buy Pullbacks In The Short TermH4 - Bullish divergence.
Downtrend line breakout.
Higher highs.
No opposite signs.
H1 - Bullish trend pattern.
Currently it looks like a pullback is happening.
Until the strong support zone holds I expect the price to move higher further after pullbacks.

NZDCAD - Looking To Buy Pullbacks In The Short TermH4 - Bullish trend pattern.
Higher highs.
No opposite signs.
Until the strong support zone holds I expect the price to move higher further after pullbacks.

NZDUSD - Looking To Buy Pullbacks In The Short TermH4 - Price is bouncing higher from a key support zone.
Bullish convergence.
H1 - Bullish trend pattern.
Currently it looks like a pullback is happening.
Until the two strong support zones hold my short term view remains bullish here.
