BTC shoulder head shoulder 12HMonday in a very agitated way, we recommend careful investment at this time.
Bitcoin may have finished its shoulder head shoulder formation with a target projection between 42k, it all depends on holding 46.5k. The LSR is high "2,56",
all indicated for a major.
Buying point that we're going to be interested in is between 44k to 42k with fractional orders,
To invalidate the shoulder head shoulder we need to stay above 48.6k and maintain it.
** What is a OCO (shoulder head shoulder)? **
The market forms a first top and returns the base line which will be called the neck line.
From that point onwards, a rally occurs surpassing the previous top and forming the head, until that moment the market
he the continuation of the rise. Prices, from the head, return once more to the neck line and go back up again,
giving rise to the second shoulder with a size very similar to the first. The OCO is formed.
Bullmarkets

Are we still in a Bull Market or has Bear Market started now?This post is no guarantee. It is purely my opinion based on clear facts and indicators. I will show how the probabilities stand and than in the end you can create your own opinion.
Alright, lets get started:
1/
If 69K was the top it would be the first cycle peak without:
- Price hitting 1 fib curve
- DRSI reaching red area
- StochRSI reaching white zone
- VRI reaching white zone
--> Therefore probabilities are in favor of the Bull Market still being on!
2/
Let's focus on the red circle quickly, because that's where we currently are imo. 2013 & 2021 are pretty similar because both had mid cycle peaks & lows.
For the red circle in both cycles (2013 & 2021) the following is true (so far):
- PA: resistance at .5 fib curve
- DRSI: RSI resistance at middle band
- StochRSI: momentum slowed down
- RVI: Pointed downwards
2.1/
The logical conclusion:
We have Confirmation for Bullish Continuation once:
- PA: 2W closes above .5fib curve
- DRSI: RSI crosses above middle band
- StochRSI: Momentum shifts bullish
- RVI: Points upwards again.
Once all 4 points become reality, chances are high to reach 1fib curve.
If nothing happens Bear Market is likelier.
Big credits to @TechDev_52 !
It's his original work that inspired me to dig deeper!
Hope you enjoyed it!
Make sure to follow me on Twitter as I'm very active there!
Take Care
Valerio

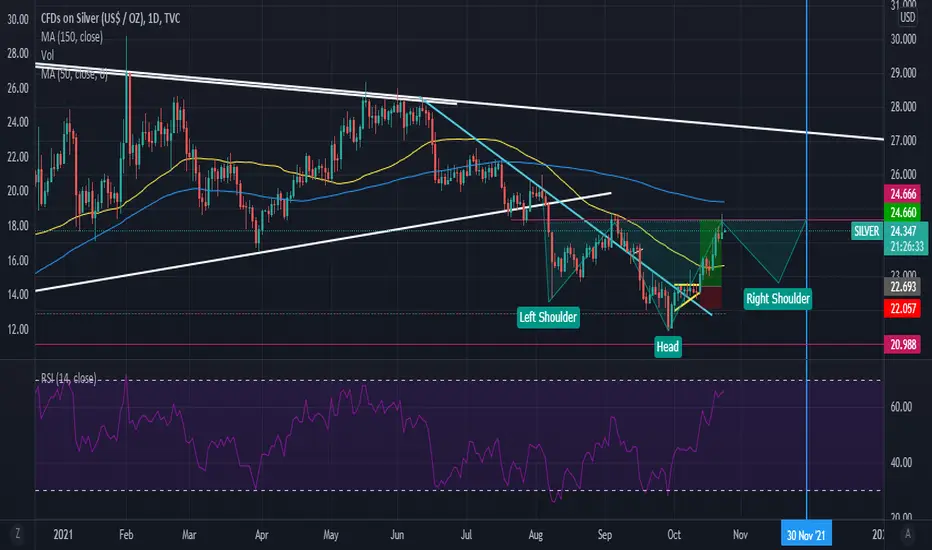
Silver Will have one more leg down before exploding higher
Hey guys, Silver recently broke its big down trend and is starting to look like it will start bulling hard. But If you have looked back in the past 9 years silver seems to have some strong seasonality bulling around the end of November to start of December period so I believe we will see some weakness over the next two weeks build the rest of this possible head and shoulders before the bull run starts. Also backing this is my view on the US100 will fall after earnings and Silver and the US100 track quite well at times and when the Us100 declines silver either leads and is a great signal for shorts or follows I touch on this on my first short against the US100.

My Exit Strategy in BitcoinWhen Bitcoin breakout red line
i think Bitcoin can be more $100k in this bull market.
Bitcoin Investor Tool: 2-Year MA Multiplier : godtrix


SWING TRADE USING SMART MONEY CONCEPT (GODREJ IND)Making money from the markets is easy but keeping that profit with you is the most difficult part in which most people fail. So if someone has an edge over a particular trading setup or has a system then one should stick with it and should focus more on the psychology part.
But if someone is struggling with trading and unable to make profits out of the market and roaming around the indicators then He/She is on the wrong path. Never run around INDICATORS as they all are lagging the price is the only thing that is LEADING rest everything is lagging and often people forget about the price when they run around the indicators.
So every time one must look to combine multiple concepts while building a setup or looking for a trade like combing Price Action, Market Structure, etc together to find the best trade possible
Here I have shared my analysis on GODREJ INDUSTRIES by combining multiple concepts. You can gain a good idea by looking at charts
Hope you enjoy and learn something new from it👍
- Pranesh Sahoo
FOR MORE IDEAS PLEASE SUPPORT BY SHARING THE ANALYSIS AND DO FOLLOW AND LIKE. IF ANY DOUBT ARISES DO COMMENT DOWN BELOW I WOULD LOVE TO HELP YOU.

Loopring Breakout pendingDaily level has been respected, as you can see it has bounced off support multiple times once it has come above it. Ready for breakout on smaller timeframes. Just a matter of time….

AR BreakoutSince 20.08.21 AR has been strong uptrend.
Now have to wait when the stock breakout.
Check also PUMP and REKR

Rune : Support & Resistance - Potential of 1X in 1 W to 10 DRune : Support & Resistance
Potential of 1X in 1 Week to 10 Days

FARM - CHAD COIN Q4 Update As requested, update on the Harvest Finance "FARM"
After my previous analysis, we have seen a prolonged accumulation phase for the FARM token. Moving Averages are compacted. In the short-mid term, we will see a move. TVL is still healthy with a ratio of 0.25. Earing you 30% APY.
I expect to see this coin pump when BTC and ETH have their runs happening RIGHT NOW. (check updates) 2021-10-20
Caution:
As we see more Ecosystems rise on different chains. FARM'S performance is being affected mutually.
There is a good chance we might see a pump in price. However previously we saw dips short after. If you are not planning on holding this coin long-term, taking profit is a good option in this Q4
I appreciate the feedback. This is what will keep me posting analysis of financial & crypto markets and sharing it with my audience. We are now going to be looking at ATHs in the crypto space I would like people to succeed, and will be keeping you posted.
Smogster

ADAUSD is about to start a moveIt takes time for the accumulation phase but nothing comes without patience.
GOOD LUCK!

Is Bitcoin Ready?Simple TA with trend lines and Fibonacci Retracement. Looking for $80k - $125k Target, we can only hope. What does everybody think, bear trap or last bitcoin run for another couple years . . .

FIRO A MILLIONAIRE TRADE!FIRO is a trade for the long term, it went into a bear market in 2018 and has not recovered like all the other projects.
It recently came out of the bear market cycle, it is retracing to the trendline broken as Resistance and ready to claim as Support.
Long term this token could reach $1000.
I will keep you updated on my trade, NFA.
Safe Trading.

LONG $SOLTwo range of interest, dip in sol is a buying chance
Spot long - Targets all time highs
Short term trade - Orange arrow, stop hidden around red arrow, ideally hide it just incase

Ethereum/ USD had a breakout - now we need volume and support.Hello guys. We had a small breakout out of this falling wedge. Now the red trendline is support and will probably get tested soon to get to 4k$. :)
Do your own research / Trade at your own risk
NOT FINANCIAL ADVICE/RECOMMENDATION ( just my toughts about this Crypto) :)

ETH-All eyes on all time highsGood Morning traders.
Todays chart will be basic in nature at the narrative can be easily shown.
If you have been following my forecasts you would have seen that I was calling for an impulsive move as we stacked orders and any pullback from the high would only be short term before a push higher.
We didn't even get a pullback, it was just a push higher. The whales ate the the short liquidity.
The next target is the ATH, this rally has been explosive so a pullback is always possible but with this momentum I can see the ATH being taken in the next 7 days (depending on how BTC reacts)
As always trade safe.
EnvisionEJ

Break of the 99 moving average bullish cycles btc.These cycles I mention in my TA are based on 4H MA (99) support. I've traded the past month based on this MA 4H and I believe its one of the key factors why btc pumped so hard. We have had 2 cycles now, which both touched the MA in a period of 13 1/3 days. Now btc dumped a bit hard, that's why it's difficult to think of another cycle like the other 2. And tbh I expected a bigger pump for btc before the retrace. So now is btc forced to another channel? Or cycle? Im still analyzing btc and planning to long it soon when it touches the moving average.

Chance of Doge 🔥🔥🔥In case of landing, a chance to boost in the second level.
Soon we will see E.Mask again.
Take yr R.management.
Good Luck.

Vertcoin - Next wave?Next wave incoming?
History repeat itself.
If BTC confirm his bullish trend to 100k, vtc is going to follow and follow it's 4y pattern:
- Halving in december
- Taproot activated
- Changelly and ledger on
- Verthash

BITCOIN PRICE VS MACD Fractals Comparison (Past 2 Bullruns)This weekly-chart of BTC represents how previous rallies were followed by deeper corrections all the while comparing them with MACD. We'll notice some similar price movements, fake-outs and then breakouts.
(i) The cycle starts after making an ATH by a big and strong impulse during the bull market, subsequently there's always a major pullback, hence a Bear Market. After this pullback there comes a significant upside move which causes some undeveloped signals leading to FAKEOUTS (in white ellipse) which makes it look like the end of the bear market but only cause potential losses.
(ii) At the same time the MACD signals the "almost" crossovers which aligns with the bullish price action after a pullback leading us to believe a genuine breakout which later turns out as a FAKEOUT but if we look below the baseline (0 value in MACD) at -0.21 whenever there's a bullish crossover it acts as the beginning of next BIG MOVE and an actual BREAKOUT.
(iii) After the BREAKOUT (white diagonal rectangle) there comes the next phase, another big rally with more new market participants, much higher volumes which historically elevates the price in a PARABOLIC way taking prices beyond the previous ATH towards a new ATH (CRAZY MARKETS = CRAZY RETURNS) and eventually to an end of the rampant speculation.
(iv) And so the cycle repeats.
which brings us back to the current scenario that is half-way across the cycle meaning we are nearing the fake-out zone and we must stay awared and avoid getting trapped in the short squeeze or bull trap. Factually, the price should act accordingly; nevertheless, we know how BTC has never ceased to surprise us in the past. Let's just observe for now and not rush getting trades.
P.S - Too much info on the chart, for simple understanding just focus on the MACD crossovers and Price breakouts.
CryptoCuriousOfficial 📥

Breaking to the upside:downtrend since April ATH close to an endIn approximately 80 minutes from now Bitcoin should close above the the trendline(41750$) of the daily chart that has kept prices lower in a mid term downtrend since April 13, 2021 ATH (64.7k)
once the 200 daily SMA(44780$) will have been cleared Bitcoin will light up the engine to fly a new ATH and beyond. a 6 digits is still possible and likely by the end of 2021. if that fails 2022 will almost be a certainty
