At the beginning of the #Altcoin bull run!The reaction rises that started with q4 2024 will turn into a parabolic wave with q1 2025 for #alts
Bullrun
$Route will go to 20 cent before CHRISTMASSSIts gonna be a warm, warm christmas for Route holders!
Broke true resistance.
Great development
Big adoption coming in hot!


Solana - We Will See A New All Time High!Solana ( CRYPTO:SOLUSD ) is preparing for an all time high breakout:
Click chart above to see the detailed analysis👆🏻
After dropping -95% in 2022, Solana then rallied an incredible +2.000% and retested the previous all time high. Then we saw a quite long term but tight consolidation and just two months ago, Solana retested the lower support again. It is just a matter of time until we will see a breakout.
Levels to watch: $120, $210
Keep your long term vision,
Philip (BasicTrading)

$BTC enters 100K radar!#Bitcoin pitchfan continues its parabolic run with support found at 0.618 support level!

Everyone selling GOLD to buy Bitcoin???Hey guys! New trading week is here, and we're entering market with Bitcoin ATH.
Today I want to talk a bit about gold.
And here are some interesting moments. First time since April we finally can see MA cross on a daily chart, and price of Gold is reacting with a big red candle.
Also, as a confirmation, we can see that the volumes are descending and RSI is heading to low edge.
Seems like after BTC ATH some money are flowing from Gold to Bitcoin. The target by Fibo can be zones 0.5 and 0.618.
What you think, guys, is really people starting to reinvest money from real gold to digital gold? Let's discuss
PS. If you're planning to trade the movement, follow the risk ratio, which I marked.

BTC ĆMĘ Gap#BTC CME GAP Analysis
We can clearly see a big CME Gap between $77930 - $80670 which will be filled soon .
So be aware of your open trades, we are gonna see a pullback around $78k.

Bitcoin Wait for a good longThe bullish case is strong, but proper risk management is essential if you're looking to go long. The current market is heavily overleveraged with long positions, causing sharp wicks and rejections, typical of a bull run.
I plan to wait and open a position at $60,750, keeping in mind that the price could drop further to $57,700, where I also plan to enter. However, don’t sleep on that level—it might be the last opportunity to open a long at a good price!
BINANCE:BTCUSD

Doggy Style- I mostly use some specific projects to try to predict the next " Altcoin Rally ".
- I typically use Cardano or Doge because they are older and I can use indicators from earlier times.
- Yes doge is meme, but all altcoins are also Memes until they have a real use case right ?
- so you remember this BTC post i made in 2022 ? ( please check it )
- So this is almost exactly the same but with this graph i use :
- Tenkansen ( Yellow line )
- SenkouSpan ( Green line )
- so now check the compressing descending trend.
- check now both lines ( Yellow and Green ).
- Notice when the yellow line cross down the green, we go bear.
- Notice when the yellow cross up the green, we go bull.
- So what we can deduct? - Altcoins are not yet Bullish.
- But remember Altcoins will go parabolic at one point and you want to be there!
- When? - anyone knows the exact date but you need to understand " The Delay ".
- i will post in comments same chart but i will use BTC with same technic and you will get that BTC is already bullish.
Happy Tr4Ding !

Hey SPYLOVERS ! Enjoy the Bull Ride !!!! Election Week and Interest Rate Cuts Did Not Disappoint Us at All
The truth is, it was a very difficult week to predict price movements. However, out of the two possible scenarios I shared last week, Scenario #1 was the winner, and it was the one I had the most confidence in!
At this moment, the price is in "no man's land," meaning there is no historical price data on the chart where we can find a level for the price to hold or replicate its movement. In this case, I believe that, from here on, the price will move based on upcoming economic news or as we approach the date when President-elect Donald Trump will officially become the President of the United States (POTUS).
Let's enjoy this bull run that is happening—these are important times for the country, and we need to take advantage of those swings!
Best regards, and thank you for supporting my analysis. See you next week!

BNB ATH#BNB Analysis
Finally,
It brokeout the 5 month long resistance in one single green candle and reached $638.
Next target is ATH ($721.80).

BTC - Bullish Phase Confirmed!Hello TradingView Family / Fellow Traders. This is Richard.
🗒 Do you remember this post from 2023?
and this post from last month?
📌 It is confirmed. Pattern 1 Activated after breaking above the red channel and 70k.
❗️N.B. Always remember, nothing moves in a straight line, so we might see a correction (in the form of a higher low) along the way.
Always follow your trading plan regarding entry, risk management, and trade management.
Good luck!
🗒 All strategies are good, if managed properly!
~Rich

$ETH ON FIRE! #Ethereum will move towards the $3,500 and $4,000 targets if it makes daily closes above $2,881, which coincides with both the major resistance and the downtrend breakout.

Bitcoin Long Waiting for 67.6k to 68k where the gap at lower time frame sits.
Striking hard from that region.
Relentless against this structure , lets make it happen.

Bitcoin projection for this bull runLooking for short positions at the upper limit , that is when i usually enter short.
Around the 91k region there is a resistance.
I expect a 25-30% correction from that region. After that bull run will resume its run and stop at around 115k .
It can go higher ,nobody knows how high it can go but this is what trendlines are telling us.

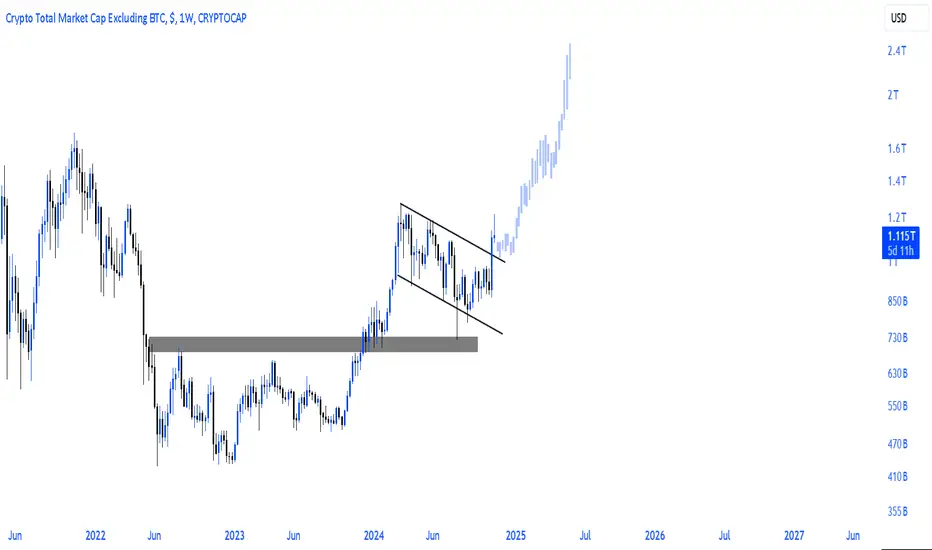
Crypto Bull Run: Unveiling the First StageAfter a year-long bear market, cryptocurrency prices enter a consolidation phase at the bottom, lasting approximately 500-700 days. If the price breaks through this consolidation resistance, it could experience a bullish move of 100%-300%, This pattern occurs once every four years in the crypto market.
Currently, most cryptocurrency prices are breaking out of their consolidation phases and experiencing 100%-300% moves. This marks the first stage of the crypto bull run.
I will share the example charts below.
Regards
Hexa

Dogecoin - Get In Now Before It Hits $10!Dogecoin ( CRYPTO:DOGEUSD ) is about to repeat another bullish cycle:
Click chart above to see the detailed analysis👆🏻
Dogecoin just broke out of the previous bear market triangle pattern and is starting its next major bullrun. Looking at market structure, price action and previous cycles, Dogecoin could even hit two digits after is manages to break above the all time high. You know what's possible.
Levels to watch: $0.1, $0.2, $0.5, $10
Keep your long term vision,
Philip (BasicTrading)

#Altseason loading step by step!Just like in the 2020-2021 period, I feel the #Altcoins run again in my bones in the 2024-2025 period.
#Alts run will melt all faces again and add new millionaires to the community of believers!

BTC POST HALVING History doesn't repeat itself, but it often rhymes...
We're now in the post-halving part of the Bullrun, and we can look back into Bitcoins history to help predict what might happen next.
Typically A bull cycle lasts 1065 days from the low to the high with the halving event in the middle. If we use that same timeframe and apply it to this Bullrun we can expect the peak for BTC to come in early October of 2025.
Now we know that once BTC has had it's top, altcoins regain some of the market dominance in an "Alt season" which is often a manic period of profits from BTC being poured into increasingly risky projects until the whole thing comes crumbling down, which then leads too...
The bear market which historically lasts for a full year from top to bottom. The bear market comes when most people least expect it as they are so used to price going up, complacency and greed can cost you all of the gains made in the last 3+ years. It's also important to note that BTC routinely goes through 25-30% corrections on the way up, and this is where many fall down. Knowing the difference between a correction and a top is the difference between making it and roundtripping everything. Have an exit strategy, take profit at key areas, don't let greed win.
The Fibonacci levels can be very useful when a project goes into price discovery as well as big even levels, your 100, 150, 200's etc. When Fib levels line up with these big evens you can expect resistance and therefor look to protect your capital.
Bitcoin is very close to a breakout from the '21 ATH level, we've been above SWB:69K before but swing failed to hit $56K, I am still a little worried about the GETTEX:52K +VE Orderblock as shown in green, it would make sense to revisit that area at some point however it does depend on this current SWB:69K S/R level.

BITCOIN TREND PIVOT With all the geo-political noise it's easy to get caught up in the low timeframe madness. Zooming out and looking at the High timeframe structure, things get a little simpler...
For me, BTC has been in two different smaller phases within a larger bullflag pattern. Phase one is the bearish part of the bullflag where price prints lower highs and lower lows , this lasted for 150 days with a pivot once price wicked into the bullish OB @ $50K.
From that pivot point the second phase started and it's where we are now. Once we got our first higher low the new bullish trend began, higher lows and higher highs followed and continues on until now.
Now the interesting part is how BTC has broken out of the bigger bullflag pattern and that's shown by the X's and ^'s on the chart. In recent days BTC has broken out of the bigger bullflag pattern as shown by the tick where price rejected off the '21 ATH and retested what was formerly trend resistance and now support after a successful bullish reaction off that level for the first time in 8 months.
Price is now at the highs with the US election around the corner and %16B FTX repayments on the way , can BTC go one step further and make a new ATH? Time will tell but for now the structure is the most important thing. Higher highs and higher lows, that's it.

Ethereum - This Is The Last Buying Opportunity!Ethereum ( BITSTAMP:ETHUSD ) is still super bullish:
Click chart above to see the detailed analysis👆🏻
Despite the correction of about -50% which we saw over the past couple of months on Ethereum, market structure and price action is still overall bullish. Ethereum is currently creating a bullish break and retest with a potential move of +60% towards the upside.
Levels to watch: $2.000, $4.000
Keep your long term vision,
Philip (BasicTrading)

Trump is another name for #bitcoin's parabolic movements!🟢#Trump’s influence, especially in 2016, created a huge shift in the political arena, and this increased people’s interest in alternative financial systems like #Bitcoin.
🟢2016 was a time when Bitcoin started to be noticed by the wider public.
🟢Now, with Trump’s return, there will be a similar wave of excitement in CRYPTOCAP:BTC and the crypto markets.
🟢Interest in assets like #BTC will increase, especially when there is a lack of trust in traditional economic systems or a search for alternative solutions.

ICPUSDT - BUY OPPORTUNITYThis one is a low risk - high reward potential for a long-term, equity growth investment.
Considering the future of Ai within the crypto space & blockchain and in general, market growth of Ai to reach trillions of $$$ in the next few years or sooner, the overall growth and future potential integration of Ai within the ecosystem of ICP can help elevate the overall price of ICP - already its implementing Ai introduction within its blockchain and many more applications to follow through in near future. given the reasons, the potential Ai bull run can be explosive for Ai coins and ICP has the greatest potential to overcome its past performance and gain huge growth from here!
My overall investment in this coin is long term hold to potential STP target - I can see this coin to do exponentially well in near future! I will HODL this coin until Ai bull run fully peaks!!!
Pls DYOR and risk only what you can afford to lose! Crypto is extremely volatile and you can lose your entire capital!
Trade Safe Habibis! Good luck to ICP HODLrs LFG!
