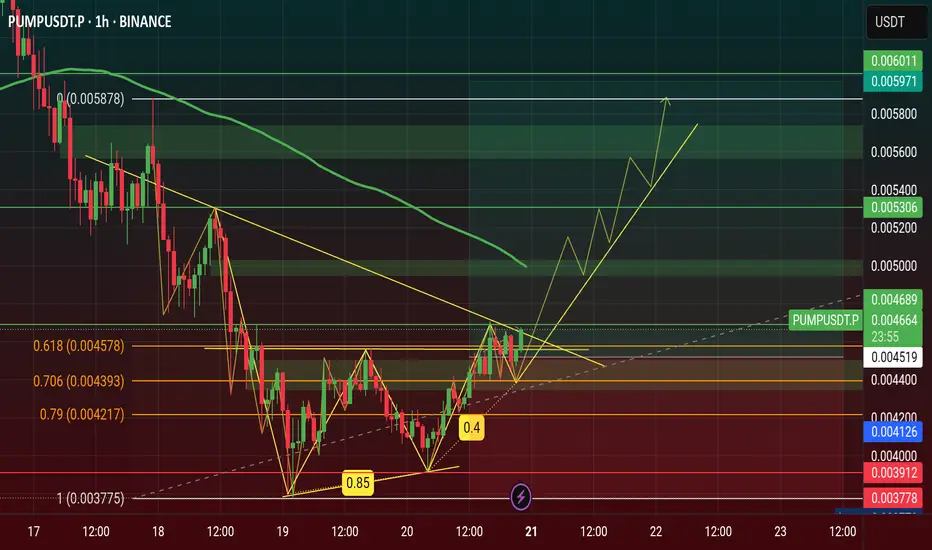
$PUMP Price Will Hit $0.006 this July 2025 see on Chart...🚀 NYSE:PUMP Price Will Hit $0.006 this July 2025, NYSE:PUMP is Showing a Double Bottom Pattern Looking on Chart now.
Double Bottom Pattern is a Reversal Pattern and It's will Manipulation Price of Pump. I'm Find a Three White Shoulders Candle in bottom price area on 4h Chart & It is a Bullish Candle. Now Price Retest and If it's Breakout it will be happened this month.
#Write2Earn #TrendingPredictions #AltcoinSeasonLoading #pump #SUBROOFFICIAL
Disclaimer: This article is for informational purposes only and does not constitute financial advice. Always conduct your own research before making any investment decisions. Digital asset prices are subject to high market risk and price volatility. The value of your investment may go down or up, and you may not get back the amount invested. You are solely responsible for your investment decisions and Binance is not available for any losses you may incur. Past performance is not a reliable predictor of future performance.
Bullruncoming
Golden Fib Level Rejection in BTC.D: What’s Next for Altcoins?After a sharp gain, BTC.D is facing strong rejection around the golden Fibonacci level of 0.618. We anticipate a sharp decline from the current levels, which could pave the way for another leg up in altcoins

Matic is just preparing.Matic is holding resistance zone around 0.94-0.97 area, which means closing candle above is a great opportunity to look for long position. And here is my idea of how it will go. I will be taking profits at those green lines.

Roaring to Profits: Uncover the 8.86% Upside Potential in ARRUSD
Technical Analysis:
1.The red line represents a crucial breakout point that triggers an 8.86% bull run.
2.Set your stop loss based on the demand zone of either 1 or 4-minutes intervals. If you need assistance in creating them, please direct message me.
3.Take profits by closing half of your position when reaching the orange line, and adjust your stop loss to breakeven if I haven't provided an update in the thread.
4.Close an additional 25% of your position at the blue level.
5.Remain patient for confirmation of trend continuation, which will be communicated in the thread.
Your comments and feedback greatly boost my confidence and contribute to my growth. Feel free to share your thoughts if you have a different perspective!
Cheers!!

BTCUSDT - pending Inflation. The expectation of a short- Came to the area I marked in the video
here -https://www.tradingview.com/chart/BTCUSDT/g0HMDQc6-bitcoin-nachalo-bychbego-trenda-2023/
here-
here-
I started longing since January 22
The markets are coming alive because of the injection of money into the economy through military companies that produce weapons and so on. written here
money injection
Now it's more likely to see a correction than an acceleration. A big sign of this: a friend I wrote to 2 months ago who I told to buy crypto and invest in the market. But he only matured today. He says he wants to buy (haha, bitcoin is up against resistance, I am waiting for a pullback price, but he wants to gain a position).
What else to add: Broke through the trending orange.
But there was no test. So we wait for the retest a trendline. If it confirms the breakthrough. Then we will see in the near future 30k prices on the Father *BTC* .
What are your thoughts?

ETH/USDT-WEEK CHART FALL AND TOP OF BULLRUN PROJECTIONSIn this idea I cover what I see in the future for ETH according to the charts. Keep in mind that this is what the chart tells me, but when dealing with the fundamental side they may experience a lot of turmoil. The merge didn't necessarily help them with the FCC looking into a new classification now and the US claiming they have jurisdiction over ETH. Could get messy, but at least the chart is optimistic long term. If you agree throw me a like and follow me for more unique ideas, concepts, and projections that keep you in the gains. Much love to my supporters- ND

Bitcoin 2022 BULLISH SCENARIO | Complete analysisComing into 2022, the sentiment is extremely bearish and of course - it can stay like that for a very long time. The problem is, context doesn't show BTC should be slowing down, so it seems probable BTC reaches extremes of its trend right now. I am also posting bearish scenario separately, but I do think this one is the likeliest outcome of all.
What is crucial for bullish plan to be triggered - is January close above 43,8k. WIthout that, I will switch towards bearish scenario (which is mostly ranging during next 12 months).
IF we handle to close Jan. above 43k, there will be a very quick expansion with an ultimate target of 58-61k - that is utested resistance and will be sooner or later filled anyways. Afterwards, I do not think the expansion could go any further than that in a straight line. So for traders, short 60k is a must - and for holders it will be important ho hedge.
BTC should range for several months afterwars - a lot of people will call for bear market again and we could even reach towards 43,8k again (yeah, very important level). This will be very hard period to handle - but not with shorts from 60k ofc . Just don't get trapped in a range. Stay with the plan.
Because after this range gets finished, there should be another expansion towards bullish targets - technically we should reach 75-85k. I can imagine in extreme even reaching 100k mark.
I do think this will be the cycle top and we should look for our hedge short positions accordingly around these levels - after a structure breakout to the downside.
Stay safe, take care!

huge pump coming ))))after break up the trendline above it can pump so far dont miss that folks
push like and follow for more ideas and giving good energy thx :) BINANCE:MATICUSDT

ETH 15 min chart idea to 900Hello
This is my take on ether climbing to 900 or possibly higher not financial advice please comment and like more input the better four eyes can see more than two and I might of missed picking something up..


Bitcoin heading to extremely bullish targetAs you can see on this daily chart, we have a pretty solid Inverse Head & Shoulders formation, with a very clear neckline that we're actually testing RIGHT NOW. If we calculate a simple target using the distance from the bottom of the head to the neckline and project it upwards, we get a price of $19K approximately. That's huge.
Also notice that the volume is declining, and in the following prices (upside) the volume on the VPVR is pretty low so it might be easy for bitcoin to be totally volatile. Be careful if you're trading this formation in the short term.

BTC - BULL RUN INCOMING - TIME TO INVEST IN (SOLID) ALTSHello, for the first time since 2017 it is time to invest in Altcoins.
As we said, thereis not much to squeeze out of them, downwardly speaking. Indeed, the drop of the 12th of June did not affect the dominance much.
The trend is downward, so BTC is losing dominance against alts. Since they are all very cheap, it is time to create a new diversified portfolio (with majority in BTC of course) for the first time since 2017-2018. Not just random bets on this or that pumping.
Solid or speculative ones, that is your choice. In the channel I indicated my picks (XMR, TEZOS, LINK, ETH, LTC, MCO above all). In some of them I entered, in others I did not yet (LINK) as I am waiting for a better entry (and in case I am wrong and their price drops further)

Bitcoin bull run let's begin (BLX weekly chart)I've spent many days watching the Bitcoin price at many timeframes and I realized this is the best chart with important trendline that shows with a long term perspective investing why the price of Bitcoin is going to be only higher from now on:
This chart should highlight to you the exponential growth trend. As long as this trend line is intact then it will always be bullish.
If the line breaks ... You will have only one thing to do: short the CRAP out of it!
But bear in mind that we are living in an exponential world. Everything economical and technological has grown exponentially. Why wouldn't Bitcoin?
Recently the price just bounced after getting near the trendline. it happened before and the last time was on the first half of 2019 when the price touched its minimum at around 3K. The price never went so low again.
=======
1D ZOOM
MAJOR RESISTANCES
6.500 - 9.700 USD that need to be overcome till halvening to validate the idea
============================
WHAT IS HALVENING IN BITCOIN:
In Bitcoin , halving or halvening is when block rewards for mining are cut in half. Halving happens at regular intervals based on the Bitcoin protocol, specifically it occurs every 210,000 blocks.
Bitcoin rewards that go to the so-called miners that support the coin’s network drop in half in order to prevent inflation from eroding the purchasing power of the coins. In the previous reductions, the price rose about 8,000% in the year after the 2012 decrease and around 2,000% in the 18 months following the 2016 cut, according to data complied by Bloomberg.
When is the next Bitcoin Halving: Assuming no major changes, the mining reward will drop from 12.5 BTC to 6.25 BTC per block in May 2020
============================================
Other considerations about the scarcity of Bitcoins:
Currently 80% of all the Bitcoins that will ever exist has already been mined.
Almost 25% of that current total has already been lost forever
All the rest will be mined in just the next 6 years bringing the total mined to 93.5% by 2024, leaving only 6.5% more left to be mined between the years 2025-2140
So if you find this chart helpful please hit the like button and if you want to stay updated then hit the follow button.

QTUM #QTUM $BTC$QTUM $BAT #HARMONICBAT #QTUMBTC UPDATE
Arkadaslar suan QTUM da Harmonik BAT formasyonu gorunmekte. Mumlari takip ederek update yapa yapa takip edecegiz.


Secret Indicator Shows When To Buy Bitcoin In A Bull TrendHey, guys!
Today, I decided to show you the indicator, that tells us if we are in a bull trend and when to buy the dips inside that trend.
In these charts, we are looking at a longer time frame and weekly price action in order to see the big picture more clearly.
As you can see we are inside our first dip of 2019/20 bull trend. If you compare that to 2016/2017 bull trend you can see we are still at the beginning of the trend.
It is clearly shown by the indicator that we moved from bear to bull (from red to green) and it's been confirmed. There are still some people considering if we are in general bull and if the bear can return!?
I think this graph will clear the picture for all. We are in a bull trend with 95% probability. What else do you need to invest? Probably good price. Well, we are close to the best BUY SPOT also!
The indicator was not made by me so I can not give you access, but you can ask the author.
Unless I show him how many want it and have a word with him about sharing it with others also.
Let me know in the comments if you are interested in it and if enough people respond I will try to talk with him about it.
Hope it will help you stay calm in times of (FUD) dips and enable you to buy when the opportunity is here.
In the end, this is not financial advice, but the idea can help you when doing your own research.
Stay humble, stay strong!

BLX 1W: Watch for consolidation to continue + short term alt run*Not financial advice*
Self-explanatory chart for the most part.
500d SMA / 7d = ~71W SMA
Not sure why this SMA has been so good for trend continuation pivots, but it just is. Pointed out by Dad Shark on his live stream, highly recommend checking him out.
Not sure if same percentage increase for total alt mcap is truly possible (a lot more capital now then back then), but a short term alt run seems likely at the very least.
Nice consolidation here will set the market up very nicely for another bull run, just like back in 2017. Combine this with the upcoming halving, and this scenario seems more and more likely.
