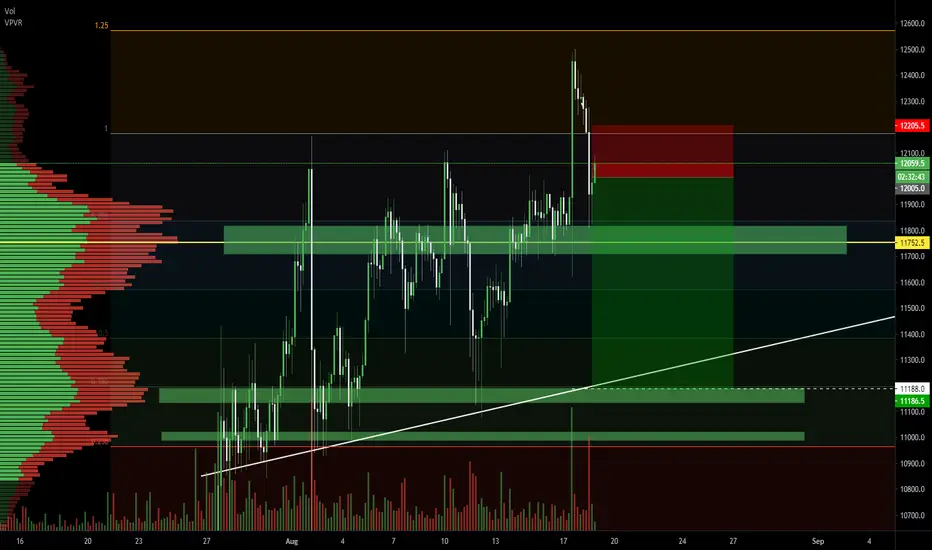
btc flip this diag R/S. a flight is ready to ATH.when everyoune is berish btc is a big puller. break this 1 hr consolidation with big V flip r/s then there is not many stops from ATH no majors. big drop from ATH imo was mainly due to okex withdrawal enabling after a long freeze. dont think other fuds had any impact. so btc has very little reasons not to resume climb. another possibility is a big bul trap. keep you eyes open and ride the trend up or down.
Bulltrap

BTC MASS PSYCHOLOGY IMPENDINGBTC has broken out of the 14k strong resistance with a nice impulse on the LTF view, but on a close analysis on the HTF, we can see that BTC broke this resistance correctively. This might therefore trap a lot of traders for the impending short especially traders who trade based on support and resistance. BTC from a closer look might not break past the present zone and might therefore go down to the 12800 zone. Whatever it does there would determine if it would go lower or retest the present region.
Please I am not a financial advisor. I am just thinking out loud. Feel free to comment and like if it goes accordingly.
Also, remember to check out my previous ideas. Thanks.

Tesla: Stunning Rally Back To Key ResistanceTesla just staged a stunning rally over the past few trading days, and after a brief but notable sell-off down to the 380 level last week, Tesla is now sitting back at long-term resistance (Green trend line). Can the bulls seize this week's liquidity/optimism wave, and break us back above the Green line to maintain the bullish thesis? I say it's not going to happen. What do you guys think?

SPX conditions similar to Feb. 19 Top !! Possible Head & Shoulders pattern on SPX daily, bullish momentum fading, setups similar to Feb. 19 Top. We're two weeks until US election, expect volatility to pick up again.


Suncor - A Tale of Two TrapsFor 20 years, the market has never had anything but dips to buy. Even the 2008 "Financial Crisis" was just a dip to buy. Even the March illusion of a pandemic was just a dip to buy. However, a pendulum always swings from one side to another. What throws people off and makes trading so difficult is that you can know:
Where the market is going
What direction the market is going
But what you don't know is when the market is going to do it. Only the makers know that, and that's why they're rich and retail is not.
But, one thing you should be clear on is that this is the end of the line and the party is over. The world is not in good shape. Trouble is only just beginning, and it won't be a brief flash in the pan this time.
The presence of a huge number of people practicing socialism (Communism) all over North America, and the world, has already shown itself to be a huge problem to the future of this world, and is about to show its economic consequences. After all, the biggest players can trade short and make even more money than they do during bull runs, while everyone's portfolio, 401K, and life savings gets wiped out.
The ultimate purpose is to cause people to capitulate their holdings at the bottom, actualizing huge losses that cannot be regained.
Once you're poor, you're easy to buy off. Once you're poor, people will do anything, including betray their friends, family, and country. In all the other areas of the world where poverty is common, prostitution, arms, and drugs all become booming industries. What else are people going to do when they need to eat?
That is, unfortunately, the endgame for the human race.
But before all good guillotines drop, you must raise the blade high into the air so it can fall in dramatic fashion. That is what our good friend Suncor is about to do, and likely WTI Crude Oil along the way.
So, this is a long trade, but it is a scalp. This isn't for you to pack a bag for your portfolio thinking that you're going to see a new all time high in 12 or 24 months. People are no longer allowed to live like human beings, which means travel has been destroyed, which means the energy industry is in big trouble.
After it is complete, take your profit and stay cash heavy. Consider getting out of the market and buy yourself something nice. Spend some time with your family. Maybe take up meditation or spiritual practice.
When the rivers of blood begin to show themselves in the streets, wait a few months before you start buying.
Every rally will be for suckers and the pullback will be in the 80% range on all asset classes. Perhaps gold and silver will be the only exceptions, in the end.

Channel Play for TSLA SPY looks weak , TSLA in a strong channel.
RISKY PLAY have a tight stop loss and enter lightly.
MACD and RSI indicates the bulls but I think this might be a bull trap. There's a black swan lurking for the next months or so...

TESLA: 329.90 USD TARGETI think this is a bull trap.
Mabye it makes a new high, then drop.
Always wait for a confirmation to sell/buy.
Best Regards.
MorelloFx.-

Bulls Will Rush In This Week, But Don't Be FooledBased on the last projection, Intermediate wave 4 should be over. The losses of the past week did move into my projected bottom. However, it does not appear a full 3 wave (ABC) cycle occurred. It only looks like the A wave is now complete. I have adjusted my model to account for this and the projections of the next movements are below. I expect gains most or all of this week and more declines through mid to the end of next week. The bottom should occur around next Friday or the final Monday in September.
What wave A did:
It lasted 40 trading hours (6 trading days) and dropped 277.64. The rise over run of this was a loss of approximately 6.941 points per hour. Wave A tends to make up 39% on average of the larger wave (Intermediate wave 4 in this instance) it makes up. This means Intermediate wave 4 could last around 101 trading hours. Likewise, wave A tends to move 74.6% of Intermediate wave 4’s total move. This means Intermediate wave 4 could drop 372.17 points from top to bottom. This does not mean a straight drop, which will be further illustrated with this week’s projected gains and wave B.
Wave B Length
In determining how far wave B will move, I have looked at how all B waves for the S&P 500’s Grand Supercycle wave 1 has moved over its 85+ year history. I have used multiple estimations and calculates to narrow down B’s length. B waves tend to last 75% the length of their A counterpart. This means B could last around 30 hours. A waves tend to last 1.32 times the length of B waves. This means B could last around 30.3 hours. Also, A’s makeup of the larger wave is 1.54 times that of wave B. With wave A projected to makeup 39% of the move, this could have wave B last 29.5% of the overall move which equally equates to 29.8 hours. Finally, B waves tend to make up around 25% of the larger wave’s movement. If A is now projected to last around 101 hours. Wave B could last around 25 hours. Based on all of these estimations, I am forecasting Wave B to last around 29-30 hours. This will have it peak around the afternoon on September 17.
Wave B Point Move
B waves tend to retrace about 60% of wave A’s movement. This could see B rise about 166 points. A’s move tends to be 1.635 times larger than wave B. This could see B gain 169 points total. Wave A’s contribution to the overall larger wave’s (Intermediate wave 4) is typically 1.68 times larger than wave B. If A tends to rise 74.6% of this overall movement (currently projected to be 372.17), then B could makeup 44.4% of the larger wave’s movement which means B could rise 165 points . Separately, Wave B tends to makeup 44% of the larger wave’s movement which is very much inline with the last data point. This could see wave B last 163 points. Finally, on average, wave A’s rise over run is roughly equal (1.00000) to that of wave B. This could mean wave B rises 6.941 points per hour over the course of its length. This does not mean it will rise 6.941 points perfectly ever hour without larger gains or losses in between. Due to my projection of wave B lasting around 29.5 hours and considering this rise over run data point, wave B could gain up to 204.7595 points. The range of potential movement for wave B was tight (163-169) before considering the rise over run data point. My projection for wave B’s peak is around 3477.97 (167.5 point gain).
Wave C
I will project wave C’s move and length based off of the finalized wave A data and projected wave B data. Wave B’s full data would be 29.5 hours long and 167.5 point gain. This projection would be a rise over run of 5.678 points per hour. Wave B hypothetically lasted 73.75% of wave A’s length (40 hours) and retraced 60.32% of wave A’s movement (277.64).
Wave C Length
Wave C tends to last 37.02% of the larger wave length. If the larger wave is projected to last 101 hours, wave C would make up around 37 of those hours. Wave C tends to last 107% of wave A’s length. Wave C could last 42.8 hours. A tends to last 1.24 longer than wave C. Wave C could last 32 hours. A’s percentage of the larger wave’s length tends to be around 0.86 of that of C. If A is around 39% of the total length, C would be around 45.34% or last 45.8 hours. Wave B’s length is typically 0.62 times the length of wave C. Wave C could last 47.5 hours. B’s retracement of A’s length is 0.53 times that of C. This could mean wave C extends 139.15% of wave A’s length or last 55.7 hours. B’s portion of the larger wave is typically 0.53 times the size of C’s contribution. This means wave C could make up 54.71% of the larger wave or last 55.3 hours. Considering all of these data points. I currently forecast wave C last approximately 44.5 hours to end around the morning of September 28, 2020.
Wave C Point Move
Wave C tends to makeup 68% of the larger wave’s movement. If the larger wave meets the forecast of 372.17, wave C could drop 253 points. Wave C typically extends Wave A’s movement by 138.2% (ironically a key Fibonacci number) which would be a 383 point drop. Wave A tends to move 0.85 times that of wave C equating to a 326.635 point drop. Wave A’s portion of the larger wave tends to be 0.92 of C which would make C 81.08% of the larger wave’s move equaling 301.75 points. Wave B tends to move 0.47 that of wave C which would be a wave C drop of 356.38 points. B’s retracement of wave A in relation to C’s extension of wave A is 0.33. This could see C extend 182.79% of wave A’s move or a drop of 507.5 points. Wave B’s move % of the larger wave is typically 0.51 times that of wave C. This could mean wave C makes up 86.27% of the Intermediate wave 4 drop or a wave C contribution of 321.07 points. Wave A’s rise/run is 0.91 times that of wave C. C’s rise/run could be 7.6274 point loss per hour. At 44.5 hours, wave C could drop 335.61 points. Wave B’s rise/run is 1.05 times that of C. C’s rise/run could be 5.4076 points lost per hour equating to a total drop of 243.68 points. The chance of calculating total wave C point loss before the conclusion of wave B is a very rough estimation. This projection will likely be much more refined when I write next weekend. For now, I project C to drop around 350-383 points which is around 3110.
Conclusion
All told, I have provided windows and estimates for tops and bottoms for waves B and C. I am bullish until early 2022 and still foresee a steady 4-6 month drop beginning around the end of October early November. I would assess this has something to do with the U.S. election results or lack thereof due to ‘vote counting complications.’

Watch out for a good old fashion bull trap.If BTC rally continues maybe we might break new heights soon but I tend to think we need to be careful especially if BTC takes a correction soon.

I am financially ruined. SELL CHAINLINK BEFORE IT IS TOO LATE!oh linkies!
the conference today revealed to the world the fat russian that runs this scam.
price has already tanked ten percent.
once it breaks through the five dollar resistance the panic will begin and small holders and speculators will begin to offload, with the whales already long gone.
once it shoots through the 2.5 mark, unabated fear will ripe through all linkies, with all those who dumped their current accounts into this scam twitching their fingers continuously while refreshing binance.
the 0.5 mark will be met, the largest panic in history will ensue.
the final deluded nodes will begin to go offline, and wagecuckers with their engineering salaries loaded up in link will be left with it stuck in their wallet, unable to move it to binance to salvage some self-respect.
the price will tank at this point to sub 0.5, and most probably sub i.c.o. levels.
from that day forward the stinky linkie wagecucking nerds who bought this coin thinking it had fundamentals will go back to their jobs, with no money in their current accounts, to be made redundant by the next wave of pajeets arriving to undercut their wages.
stinky linkies will hold bags forever, with no job, no money, and no crypto.
i warned you linkies. there’s still time to get out. sell now. don’t be stinky, don’t be a linkie.
www.youtube.com

BTC/USD - STRONG BULLTRAP FRACTAL SIGNAL | WEAK VOLUME / FAKEOUTBitcoin Is Showing Many Similarities Compared To Behaviour In Late 2018:
Price consolidation for over 70 Days
RSI consolidation for over 70 Days
Weak/Low volume pump up for a few days
Followed by a deep crash by over 50%
Bitcoin Here In Mid-2020 Is Showing Very Similar Behaviour:
Price consolidation for over 70 Days
RSI consolidation for over 70 Days
Weak/Low volume pump up for a few days
If this fractal were too playout, a deep crash is expected very soon, confirming the play-out of a bull-trap.
Price has yet to make a higher-high, ~$10,500, and this may be another weak, unsuccessful attempt at doing so.
Late 2018:
Mid 2020:
VERDICT: Based on the vast array of similarities of the current price behaviour compared to late 2018's behaviour, I believe the recent price pump is a bull-trap and I expect a deep crash very soon.

Maket Makers Set A Bitcoin Trap?
A sudden 2% pump in price for BTCUSD is exciting... it suggests we may finally see the market start to rise.
However:
On closer inspection we have cause to be cautious...
Until we see a breakout or a swell of momentum and volume on higher time-frames, Team Sparkster is skeptical.
The problem is that Market Makers (whales and institutions) can easily take advantage of the liquidity available above and below resistance levels.
By pumping the price just a little bit during times of relatively low volume and thin order books, a whale can trigger stop losses causing a cascade of orders, even liquidations, allowing the whale to scoop up that liquidity and then sell it back to the market leading to a drop in price.
Notice on the chart circled in green the long wick that extends beyond recent high.
That move almost certainly triggered stop losses for short positions held above $9340.
If the bulls do not quickly follow through with momentum up, then sure enough we could see another decline in price with many traders left in negative positions.
And looking at the current candle we see resistance starting to set in.
This is why lower time-frame trading can be so risky, cause money to be lost, and why Team Sparkster advocates a diligent approach to historical backtesting of particular trading strategies.
Specifically, the 2-week chart for bitcoin shows a lot of pressure to the downside. Sudden 2-hour burst rallies may not be sustained market moves.
Remember, most people eventually lose money attempting to trade on the financial markets. If you really want to play in the major leagues for sustainable profit, you need the tools and techniques to help you do so.

Short Bitcoin, be patients as volatility is deadThis - 7200 breakout - has not been retested since the breakout.
Any demand at 8700 or support is simply a bull trap for retailers, and is coming on weekends.
This pattern suggests that scammy exchanges pump it to wick buy stops.
It looks like a slow grind downwards but price is coming there with
Stop Loss - 9363
1.first stop at 8500, R:R - 2.31
2 second stop at 8200, R:R - 3.3
3. Third stop at 7800 R:R. - 4.8
4. Final at 7200, R:R. - 7.31
If you have liquidity, put it and go to sleep,
else, like me get out at stops,
and get back in after the relief pumps - which will always come
My entry is from 9070

It was all hype. executives allready sold 98M shares.Sell now! Top executives allready sold out. Abandon ship. Sold the knews and the roni vacine hype. Desapointing vaccine test results! Now game over. Skipped the all important animal testing stage and went directly to human testing. No corona virus in vaccine-only mRNA from a sars strand. NIH/MRNA contract for the PATEND of the said vaccine type. Royalties in the hundred of thousands per year to NIH scientists if patend is granted (goverment and your tax dollars to lure in investors to pump the stock up to 600%). This is the next ZYNERBA PHARMACEUTICALS INC. Crash imminent and very soon back to $10 a share.
Watch an important RT utube video (www.youtube.com)!
Sell Sell Sell Sell near the Nasdaq all time highs in 10 years.

Head & shoulder on FB.FB broke the up trend, Recovered on low volume with negative divergences. Could be setting up a bull trap.

DOW30 Idea: Bull Trap scenario? End Of Day Analysis Just another Idea on DOW30, signaled a small break up but not enough momentum to push through the secondary resistance. Trend down after hours, fell below my EMA on the hourly. Possible bull trap watching volume oscillation

FSLY | Divergence | 1 Hour | Short OpprotunityFSLY broke a new high on Friday of around $88.
Indicators are showing bearish divergence in the 1 hour time frames, meaning the price has reached a new high, but the relative strength is getting weaker.
This also means that there were more sellers than buyers, and the price is being manipulated.

BTCUSD: Inverse Head & Shoulders Fracta - Deadcat to $9.4K?Bitcoin is starting to form the previous inverse head & shoulders pattern on a smaller scale, potentially creating the continuation pattern of a bear trap followed by dead cat bounce to $9,400 support turned resistance, before moving back below $9K for lower lows after the monthly (as well as quarterly and bi-annual candle) closes. Based on larger time-frames, $8.8-$8.95K should act as strong volume support.
RSI & CMF are diverging with the similar setup. RSI oversold double bottom currently testing neutral zone within right shoulder, CMF bearish selling pressure divergence from left shoulder to head flips to buying pressure and re-tests the neutral zone in the right shoulder. Below $8,637 (50 Week MA), price could fall fast if bears follow through with sufficient volume.
It's the perfect setup for a bear trap, followed by the obvious bull trap into strong resistance.
Candle closing metrics based on current price:
Monthly gain/loss: -4.28% (bearish)
Quarterly gain/loss: +40.95% (bullish)
Bi-annual gain/loss: +23.23% (bullish)
4hr view continued: A few possible scenarios
Daily view: Hash Ribbons Buy Signals 2016-2020 Extrapolation
Weekly view: Logarithmic Curve & Network Growth : $100K in 2021?

BTCUSD | Bull Trap| Resistance Cluster| Apex| Low Volume Evening Traders,
Toady’s Analysis – BTCUSD – establishing a bull trap, now trading back into its apex where a breakout is probable
Points to consider,
- Strong resistance cluster (Bull trap)
- Support and resistances converging (Apex)
- RSI and Stochastics showing weakness
- Volume declining
BTCUSD has had a sharp sell off at resistance cluster, trapping long buyers. The significance of this resistance cluster has now been solidified three times.
The local support and resistance are converging; a price break in either direction will be imminent.
The RSI and stochastics are both below 50, showing immediate weakness in the market.
Volume is clearly declining, indication of an influx being imminent, this will coincide with the possible breakout.
Overall, in my opinion, a break in either direction is imminent; the probability down is greater due to the recent impulse sell. The break needs to be backed with increasing volume to avoid any fake outs.
What are your thoughts?
Please leave a like and comment,
And remember,
“People normally describe this kind of internal mental shift as an “ah, ha” experience, or the moment when the light goes on. Everyone has had these kinds of experiences, and there are some common qualities associated with them. First, we usually feel different. The world even seems different, as if it had suddenly changed. Typically, we might say at the moment of the breakthrough something like, “Why didn’t you tell me this before?” or, “It was right in front of me the whole time, but I just didn’t see it” ― Mark Douglas

Don't Get Trapped Muhh Bois We could easily fall out of the channel now, but i suspect we will have one more swing up above 10.5k to trap in longs before heading back to the 6k region.
I plan on re-entering around the mid point of this Gann Fan to ride an oversold bounce, then plan on loading in more in the green zone into the new years 2-5k price range incoming in my opinion.
feel free to post ideas of your own in the comments if you see it differently than myself, i always like seeing differing opinion.
Good luck and safe trading my friends.

AMERICA RIOTS/PROTESTS TO TRIGGER NEXT MARKET CRASH?
Riots & Protests = Social Gatherings
Social Gatherings = Spreading Of Coronavirus
Spreading Of Coronavirus = Restricted Economy
Restricted Economy = Market Crash
Whilst this logic may not fully constitute to a market crash, it just needs to be a catalyst. A trigger.
Just as the virus was the catalyst for an over-valued market back at the highs, the riots & protests may also be the catalyst for the currently over-valued market and bull trap we are in right now.
VERDICT: Since we are clearly already in one of the biggest bull traps ever seen, the conflict in America may trigger the long overdue market crash.
