PNEPCB possible markupThe distribution phase might be not complete yet.
However, there are opportunities here.
Entry now and cut loss if RSI close below 39 levels.
Bursamalaysia

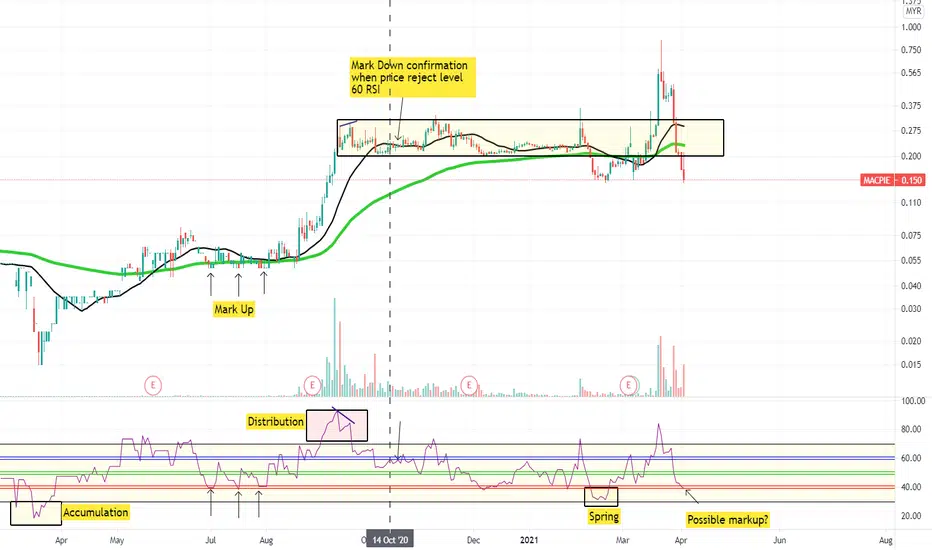
MACPIE Possible mark up?The first time RSI hit 40 levels after the previous spring.
Cut loss if RSI Close below the level.
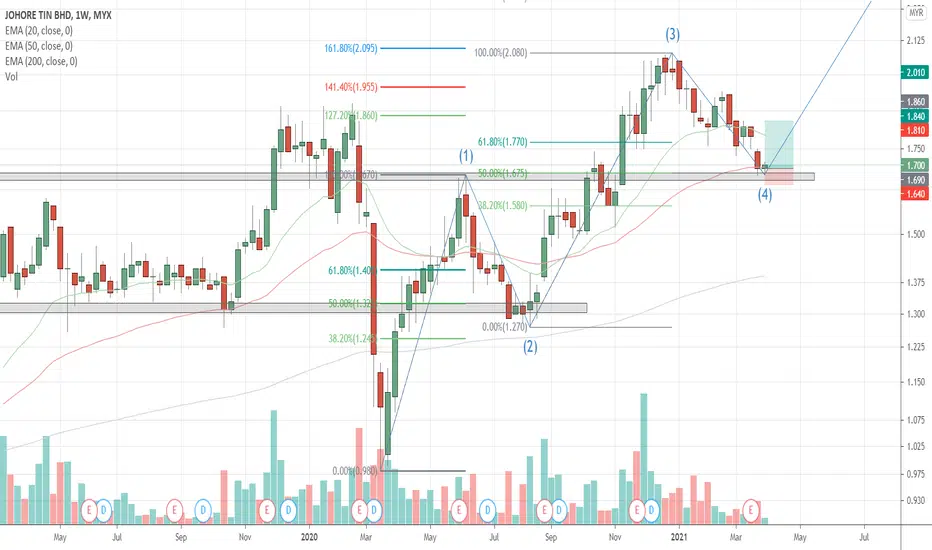
TR 361.Johotin, weekly in uptrend. EMA 20>EMA50>EMA 200. Now in Wave 4 where expected reversal is at 0.5 Fibonacci level (previous retracement also at 0.5) and RBS area.
2. H4 reversal candlestick formed (bullish candle larger than previous candles.
3. From Isaham, profit and revenue increased, PE 13.4, WAFV RM1.85
BIOHLDG Make as your WatchlistDaily TF :
1. We see accumulation.
2. Price close above EMA6.
1H TF :
3. MidBB Cross EMA50
4. Price testing MidBB+EMA.
Why not enter yet?
Because there is still now bullish divergence. Wait until the market shows the way.


TR 351. DOMINAN weekly starting to make an uptrend. EMA 20 and 50 almost crosses.
2. Daily in wave 4 where reversal expected to be 0.382 Fibonacci level also a RBS (previous Wave 2 at 0.382). Doji fomed an break with bullish candle. Price action above EMA 200.
3. From Isaham, Profit and Revenue increasing, PE 12 and WAFV RM1.16.

DOMINAN reach fibo retracement 61.81. Fibo retracement 61.8
2. Mid BB
3. Support
4. Stoch oversold
5. Bullish Divergence

Entering uptrend band?Since ENGTEX broke out from Flat Bottom, it likely to form an uptrend wave.
0.705 still a resistance, if ENGTEX is strong, it will break Flat Top.
Today gap up, although close lower, but traded with low volume. Good sign.
Let see the coming days.

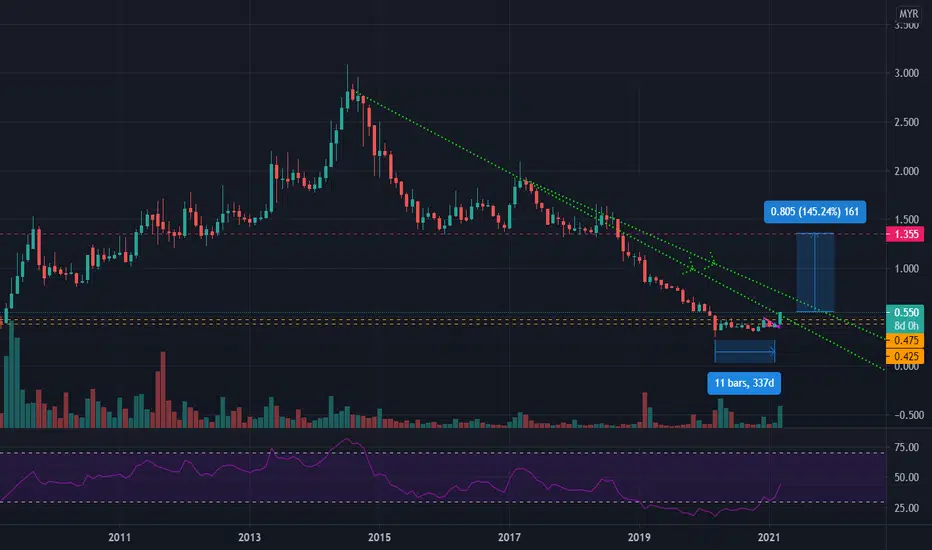
Time to awake?There are several reasons why picking this stock.
Fundamental analyzing it, I dont think this is the best in property sector, but if the worst is over, then this is the undervalued company.
As this stock in in property sector, it is a sector not to be missed, although it grows pretty slow.
Moreover, this stock has been sideways for 337days. Which I think the lowest price has come to limit.
It has 2 green gradient to beat, the first steepest gradient is successfully break, following by 2nd one.
Once these gradients are broken, hoola. Bottom Flat breakout.
This stock may not skyrocketing, but the risk is far lower, just that it takes much more time to have the trend changed.
Flat Bottom BreakoutFlat Bottom has a few criteria, lower volumes by days, traded price is getting a few ticks.
1 week is given to watch this stock closely either breakout gradient or going down.
It will be pretty rough when going down until 0.390 to the Support.

AYS - Reversal signalAYS support had already well form at 0.335. It is looking forward to challenge 0.495 in short term time.

Bullish Symmetrical Triangle BO for EvergreenNice chart pattern formed over the duration of 3 months. Possible bullish breakout for this counter not far from the apex. And uptrending and super bullish stock where EMA20 is above EMA50 and its price closed above EMA20.
Support at 380 and resistances at 440, 475, 530. Today it couldn’t break the 440 resistance.
Disclaimer: Trade at your own risk.

VS to attempt New High again?Short term reversal confirmed after few bullish candles. Another bullish candle is needed to break Fibo line at 2.905 to continue with the bullish momentum or it will pull back slightly to 2.765.
Overall still a super bullish stock for long term holding.
Intermediate support at 2.765 and strong support around 2.540~2.625 region. Resistances to break at 2.990 and 3.130.
Disclaimer: Trade at your own risk.

EURO’s Tightening ContractionsVery nice chart pattern formed with a slightly-biased ascending triangle and VCP with -39.12%, -27.13%, -13.49% contractions.
Fibo support at 4.560 and resistance at 5.015. Strong banker presence at more than 75%.
Disclaimer: Trade at your own risk.

TOYOVEN Retrace at 61.8 LevelNo one is gonna know..
How they want to know???
After price momentum..there should be another 2nd attempt at least until the last high...

TR 341. Muda weekly in uptrend. EMA 10>30>200. Now in Wave 4 where expected reversal to be at 0.5 Fibonacci level (previous Wave 2 also at 0.5).
2. Hammer formed in H4 and broken with a bullish candle. Also at SBR level.
3. From isaham profit and revenue in uptrend, PE 9.5, WAFV RM2.62.

Ajiya with VCP Pattern to BOVCP pattern formed over 3 months period with decreasing volume with 1st, 2nd, 3rd contractions: 20.54%, 9.37%, 5.03%. Confirmed BO if it manages to close above 590.
Supports at 560, 540 and resistances at 590, 605, 635.
Note: This is a low volume counter.
Disclaimer: Trade at your own risk.

Esceram’s Pending Rounding Bottom BO?Finally broke through the former heavy resistance of 770~800 and managed to close at 810. Need to close above 845 to complete the rounding bottom pattern perfectly for possible further breakout.
Support at 770, resistances at 845, 890.
Disclaimer: Trade at your own risk.

TOPGLV 7113 MYX 1 Hour Momentum Breakout Study...based upon Volume Price Spread Analysis and Momentum
TOPGLV has shown breakout in Momentum in 1 Hour Timeframe
With Second Interim Dividend Ex-date (23 March) nearing, seems to indicate that funds are collecting.
Close: 5.38
EP: 5.27 - 5.48
SL: 4.73
TP: 5.83/6.11/6.50
Disclaimer: This study does not constitutes Buy/Sell per say. Please consult your financial advisor before making any trading/investing decision

PADINI 7052 MYX 18/3/21Study...based upon Volume Price Spread Analysis and Momentum
Padini has shown both Breakout and Momentum.
Close: 3.14
EP: 3.07 - 3.20
SL: 2.76
TP: 3.38 / 3.69/3.89
Disclaimer: This study does not constitutes Buy/Sell per say. Please consult your financial advisor before making any trading/investing decision

FKLI - Range bound and going to retest 1700 again?FKLI have been trading in range-bound since early 2021. With the current stability in public health (COVID-19 numbers reducing) and politics, will the retest and breach through 1,700 this time?

Global Oriental Berhad (GOB) Buy now for early bird.Sign of Strenght
Daily TF
1. Massive accumulation.
2. Stochastic Divergence.
3. Momentum buy when price close outside BB.
4. Break resistance.
1H TF
5. MidBB above EMA50.
6. Bullish divergence
Now is good time to entry at RBS + MidBB + Stoch oversold = area 0.375.

TEKSENG Buyers on the moveThere are many indications that show strong buyers in the market.
1. Accumulation period
2. Daily price close above EMA6
3. Price close above EMA50 and retest mid bb
4. Stoch oversold
5. Continuation bullish divergence.
