FKLI hourly has potential for a rebound after breakout to upsideFKLI1! has some potential for a counter-trend reversal to the upside if it manages to break above the 1524 level or if it stays stead above this area.
Targeting 1,544.5 in the short term.
Bursamalaysia

BURSA Short Term View. Maybe double bottom. 21/9/21BURSA price near to previous low at major demand zone. Probably forming a double bottom ...

BURSA Long Term View. 21/9/21BURSA probably now moving up to wave b (green) of the running flat (a)(b)(c)(yellow) pattern. Whereby wave b (green) could reach at around RM20.00 on upper trend line of a parallel channel (Cyan/Blue)...

FKLI hourly breaking support?The FKLI1! Index futures are looking to break its immediate 1543 support on the hourly timeframe to head lower targeting a low of 1525.
Drop a comment if you agree.

AIRASIA set for a rebound?Currently having some form of resistance around the RM0.98 region, having able to surpass this, I believe MYX:AIRASIA has much room to move higher.
Targeting an initial area of RM1.50, then RM2.12 and further RM2.63 (lesser probability) IF the initial RM0.98 resistance area is broken.
These are just my views and in no way represent any buy/sell call or recommendation. Information shared are meant for educational purposes.

IPMUDA: Targeting 1.62 for starts, higher after thatMYX:IPMUDA may have the potential to hit its initial target of RM1.62 before surging further IF it manages to break above the RM1.51 trigger.
Good luck.

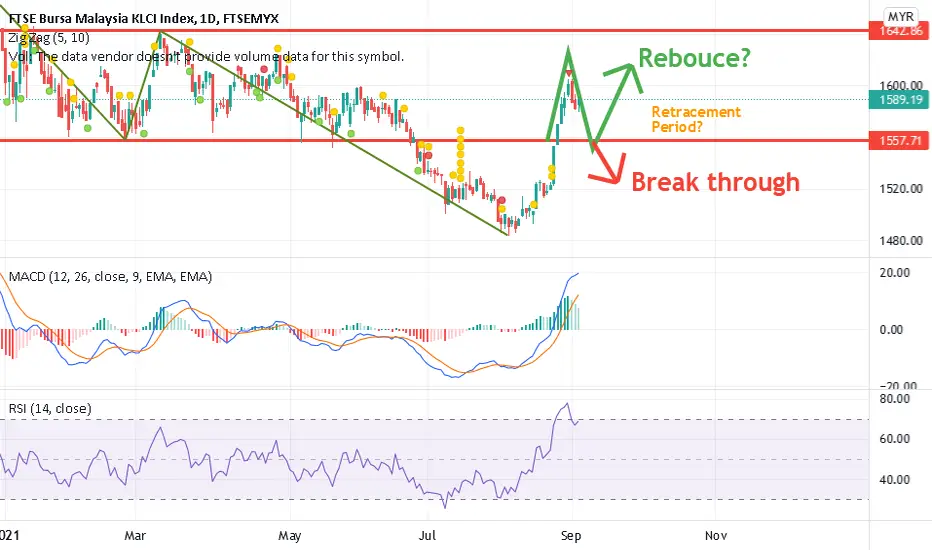
FTSE Bursa Malaysia Trend Prediction for 20 to 24 September
Greetings, since the trend break through the bottom resistance 1557, now the new test of resistance will be 1527.
The MACD and RSI show the down trend and i feel that it is meaningless to show the indicator, so i use other indicator to show the how the trend is going.
As you see, the trend is down trend now, and the down trend would probably continue at next week 20 - 24 September. Only when the cloud turn into green, and the candle shows up light blue or green colour, then the trend might be rebounce again. When the candle go below the EMA , the EMA will turn into red colour, when it backs to above, the colour will turn green.
Other reason we predict the trend will keep going down is because the week trend and month trend are going weak.
If only the trend does not break through 1527 resistance line and keep above it, then the rebounce may come again.
Again, All the prediction above just assumption, and it is not an advise to purchase or sell the share, please be responsible to your own trade behaviour.
Hope all of you may earn more money and be a rich man/woman.

Game over? #SUPERMXIncreasing downside pressure for MYX:SUPERMX with last line of defense around the RM3-RM3.05 area.
Breaking this level could bring a sharp decline for this name. Good luck.

TOPGLOV - Follow up, further downside expectedFollowing up from my Nov 22, 2020 post, prices have trended significantly lower from then RM7.29 to close at RM3.72 today.
While prices seem to be temporary supported at the RM3.68 area, it is good to note that if this area gets broken on the downside, steep slide will be expected.
Good luck. Next area of support RM2.30.

Wong Engineering _retracement before bounce backWong expected to retrace in the short term before continue LONG journey. Fundamental BUY.
Note: This is not a Financial advise.

FTSE for next week 06 September to 10 SeptemberThe rising of the ftse has ended this weekend, therefore next week may enter into Retracement period. It may take one week or with two week to complete the retracement, then might rise again.
The reason of the prediction is because if we look into week trend, the new higher point is just about to start. This give us credible basis to believe that the trend will rise further in the future.
If next week break through 1557, the trend may drop further but small probability . If rebounce, may look forward to 1642 as the new high point for next two week.
Therefore the suggestion is, observe the trend until it reach 1557, then wait for the rebouce or break through. But, there is more chance to rise in the future if you refer to the week trend of FTSE.
All the prediction above just assumption, and it is not an advise to purchase or sell the share, please be responsible to your own trade behaviour.
Hope all of you may earn more money and be a rich man/woman.
Idea of the FTSE trend for 30/08 - 03/09We have a nice week at 23/08 to 27/08, however we have to prepare for the retracement in future. It might be a big retracement day before National Day, after that might start to drop. Simple analysis as my main analysis is Hang Seng Index, but the whole week may be a bearish trend

FCPO 27 August 2021 : Inside Bar1. yesterday's price breakout the resistance.
2. Today price retests the support again.
3. 5min have formed INSIDE BAR near yesterday resistance.
4. EMA uptrend
How to trade?
1. Buy at the low inside bar
2. Wait for a breakout for either side for entry.

MYX: VELESTO. Time to upclimbing?Fundamentally,
1. on August 25, 2021 QR was released with Net profit 207% (YoY) & 127% (QoQ)
2. Institutional purchase of shares on August 17, 2021.
3. Current crude oil trending.
Technically,
1. inside uptrend channel, wave b just completed and expected to hit wave c till 23sen.
As always, TAYOR !
regards
Abenoor
Disclaimer: No trading strategy provided here. Our content is intended to be used and must be used for technical analysis & education purposes only.

Bursa Technology Index predicts to Rally if able to break ATHBursa Tech Index shown a good example of compliance to Fibo Extension.
2nd High/ATH is at Fibo extension of 1.618 and retrace to Lower High. this HL is well supported (2x double bottom)
If the index break 93.9 (ATH) - Technology Index and its counters should rally together with Bursa Index.
Observer the STO cross, which shows an early rally indicator.

MYX: HIAPTEK - Uptrend Continues ?This is purely technical analysis. Repeating wave pattern is in progress. Wave E may last at 93sen. TAYOR.
Abenoor


FCPO 23 August 2021 : False Breakout1. False breakout when price opens below previous day support and immediately close back inside the range without rejection.
2. Entry when price close inside the zone.
3. Or entry during pullback rejection.
4. Usually fake breakouts produce large movements. the daily range for FCPO almost 100~130 ticks.

FBMKLCI In a Downward ChannelFBMKLCI in a downward channel. With the formation of new government, will it be able to improve the sentiment against Malaysian stock market ?

Mobilia Re-entry BUY After the breakout, price pullback for entry.
Simple SnR rule.
For entry - wait for 1Day CS close bull, entry on the next day CS.
For exit stoploss - close position if price closes below the bull candle.
Target profit - opening price CS @ fibo 1.618

FCPO 19 August 2021 : In rangeTrend bias to downtrend.
Consolidation phase..
1. Yesterday's price failed to break the support.
2. Today price failed to break resistance.
3. 15min rejection + 5min CS confirmation false breakout.
Trade in the range..

FCPO 18 August 202115min chart price break previous day low indicates a downtrend.
New day price is open inside the range.

GLOTEC Pullback Entry1. Retest RbS
2. Stoch oversold
3. Retest EMA50
4.Fibo retracement 0.5~0.618.
5. Making series of HH and HL for an uptrend.
1st TP 20%
2nd TP 40%
Risk 20%
