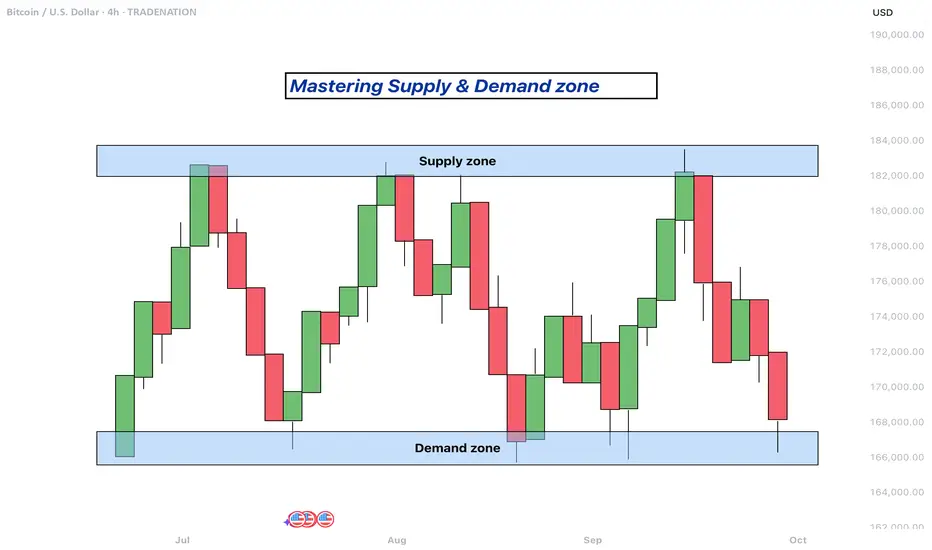
Mastering supply and demand zones - how to use it in trading?Supply and demand zones are key concepts in technical analysis used by traders to identify potential price reversal areas on a chart. They are based on the idea that prices move due to an imbalance between buyers (demand) and sellers (supply).
-------------------------
What will be discussed?
- What are supply and demand zones?
- How to detect supply and demand zones?
- Examples from supply and demand zones?
- How to trade using supply and demand zones?
-------------------------
What are supply and demand zones?
Supply and demand zones are areas on a price chart where the forces of buying and selling are strongly concentrated, causing significant movements in price. In simple terms, a supply zone is an area where selling pressure exceeds buying pressure, often leading to a drop in price. It usually forms when price moves upward into a region where sellers begin to outnumber buyers, pushing the price back down. On the other hand, a demand zone is a region where buying pressure exceeds selling pressure, typically resulting in a rise in price. This occurs when price moves downward into a region where buyers see value and begin to outnumber sellers, causing the price to increase again.
These zones reflect areas of imbalance in the market. In a supply zone, sellers are more eager to sell than buyers are to buy, often due to overbought conditions, news, or fundamental changes. In a demand zone, buyers are more eager to buy than sellers are to sell, often because the price has become attractive or undervalued. Traders look for these zones because they provide clues about where price may reverse or stall, offering potential entries or exits for trades.
-------------------------
How to detect supply and demand zones?
Identifying supply and demand zones involves analyzing price action on a chart, typically using candlestick patterns. A common way to detect a supply zone is to look for a sharp upward move followed by a sudden reversal or strong drop in price. The area where the price stalled before falling sharply is likely to be a supply zone. This zone includes the highest candle body or wick before the drop, and a few candles before it that mark where the selling pressure began.
To identify a demand zone, you would look for a sharp drop in price followed by a strong rally upward. The area where the price paused before rising significantly can be considered a demand zone. Like with supply zones, the demand zone includes the lowest candle before the price reversed and a few candles leading up to it.
These zones are not exact price levels but rather ranges. Price does not have to touch an exact line to react; it often moves within the general area. For more accuracy, traders often refine their zones by identifying them on higher time frames such as the 4-hour or daily chart, then adjusting them slightly on lower time frames like the 1-hour or 15-minute chart.
-------------------------
Examples from supply and demand zones:
-------------------------
How to trade using supply and demand zones?
Trading supply and demand zones involves anticipating how price is likely to behave when it returns to one of these key areas. A common method is to wait for price to enter a zone and then watch for confirmation that it is going to reverse. For example, if price rises into a supply zone, you might look for signs like a bearish candlestick pattern, a drop in volume, or a rejection wick to signal that sellers are stepping in again. This would be an opportunity to enter a short trade with the expectation that price will fall.
Conversely, if price falls into a demand zone, you would wait for bullish signals—such as a strong bullish candle, a double bottom pattern, or clear rejection of lower prices—to confirm that buyers are returning. This would be a potential setup for a long trade, expecting the price to move up from the zone.
Traders often place stop losses just beyond the zone to limit risk in case the level fails. For a supply zone, the stop loss would go just above the zone, while for a demand zone, it would go just below. Targets can be set at recent support or resistance levels, or by using risk-reward ratios like 1:2 or 1:3 depending on the trader’s strategy.
Patience and discipline are important when trading these zones. Not every zone will lead to a reversal, and false breakouts can occur. Therefore, combining supply and demand analysis with other tools such as trendlines, moving averages, or indicators can improve the chances of a successful trade.
In summary, supply and demand zones help traders understand where large buying or selling forces are likely to influence price. By learning to identify these zones and waiting for confirmation signals, traders can enter high-probability trades with clear risk and reward levels.
-------------------------
Disclosure: I am part of Trade Nation's Influencer program and receive a monthly fee for using their TradingView charts in my analysis.
Thanks for your support. If you enjoyed this analysis, make sure to follow me so you don't miss the next one. And if you found it helpful, feel free to drop a like and leave a comment, I’d love to hear your thoughts!
BTCUSD trade ideas
Major Coins and Crypto Stocks Pump — Thank Landmark GENIUS BillBitcoin BITSTAMP:BTCUSD making ATHs? Old news. But Coinbase NASDAQ:COIN and Robinhood NASDAQ:HOOD hitting those record-high notes? And XRP BITSTAMP:XRPUSD dangerously close to eclipsing its own peak, while Ethereum keeps chugging along toward $4,000? Now we’re talking.
In a market-friendly twist, President Trump signed the GENIUS Act into law on Friday — a sweeping legislative win for crypto. Short for Guiding and Establishing National Innovation for US Stablecoins, the GENIUS Act marks the first major federal framework for digital assets and, more importantly for traders, triggered a firestorm of price action across the space.
Flanked by crypto executives, Republican lawmakers, and a few NFT bros in suits, Trump called the stablecoin-focused bill “perhaps the greatest revolution in financial technology since the birth of the internet.” Bold claim. But judging by what the market’s doing — he might actually be onto something.
The bill, passed 308 to 122 in the House, lays the groundwork for US banks to issue their own stablecoins and create a regulatory moat that finally separates innovation from legal whack-a-mole.
But wait, that’s not all. The House also passed the CLARITY Act and the Anti-CBDC Surveillance State Act. The first one will help determine if cryptos will be considered securities and the second one bans the Federal Reserve from issuing its own coin.
🚀 Crypto Market Cap Hits $4 Trillion
As the bill cleared Congress and Trump picked up the pen, the entire crypto market cap exploded past $4 trillion for the first time in history with the orange coin holding more than 60% of the market .
It wasn’t just Bitcoin BITSTAMP:BTCUSD making noise (although it did quietly retest $120,000 boasting a $2.4 trillion valuation, or more than that of Google parent Alphabet NASDAQ:GOOGL ).
The real momentum was coming from the stocks and altcoins — especially those with exposure to the suddenly green-lit US regulatory scene.
📈 Coinbase: To the Moon and Beyond
Let’s talk about Coinbase, ticker symbol NASDAQ:COIN , and now also, apparently, ticker symbol 🚀.
Shares surged over 8% on Friday to hit a new record session high of $445, giving the US-based exchange a market cap of over $100 billion. Not bad for a company that spent most of 2022 playing dodgeball with the SEC.
The GENIUS Act (and its siblings) cleared a path for institutional crypto adoption — and no one stands to gain more than Coinbase. It’s the go-to exchange for institutional custody and compliance. And now, with banks dipping their toes into stablecoin waters, guess who gets to facilitate those flows? Exactly.
Coinbase has now rallied over 63% year-to-date, putting it back into market darling territory — and giving early bulls a solid reason to post their PnLs again.
📊 Robinhood: Meme Stock No More?
Wait, what’s that clamor? It’s the “HOOD to $100” crowd dusting off their 2021 hats.
Robinhood NASDAQ:HOOD also saw a serious lift from the legislative push — hitting an all-time session high of $113 on Friday. The shares are up 180% in 2025 alone.
While most remember Robinhood for its meme stock legacy, the app has quietly built a towering crypto trading platform in the US. And now, with Congress cracking open the stablecoin lane and clearing legal fog, it’s suddenly a real contender in the digital asset arms race.
Add to that Trump’s pledge to dismantle crypto-hostile policies from the previous administration (many of which affected Robinhood’s crypto operations), and it’s no wonder the stock is flying.
💰 Stablecoins: Boring Coins Are Now Big Biz
You’d be forgiven for snoozing through most stablecoin headlines. After all, they don’t moonshot or do anything but sit idle.
But make no mistake — this is where the real money’s watching. JPMorgan CEO Jamie Dimon, not known for casual crypto endorsements, said last week his bank will now be “involved in both JPMorgan deposit coin and stablecoins.”
That’s a seismic shift. For years, traditional banks sat on the sidelines while Circle CRYPTOCAP:USDC and Tether CRYPTOCAP:USDT built billion-dollar stablecoin empires. Now, thanks to the GENIUS Act, the door is open for regulated banks to issue digital dollars backed by FDIC-level trust — and potentially eat into the DeFi-native players’ lunch.
Boring’s about to get very profitable.
💥 XRP: Return of the Ripple?
You know it’s a bull market when XRP BITSTAMP:XRPUSD shows up uninvited and still gets the VIP booth.
The one-time courtroom drama token surged over 60% in the past two weeks, hitting $3.50 and inching dangerously close to its all-time high. Ripple’s comeback arc may finally be getting its payoff.
With legal pressure fading and Congress setting new guardrails for digital assets, XRP’s regulatory risks just got a lot less scary. Plus, institutions looking for faster cross-border rails may find XRP’s network a bit more attractive when Washington’s no longer breathing down its neck.
🐂 Ethereum: Quietly Eyeing $4,000
Ethereum BITSTAMP:ETHUSD might not be making headlines like Bitcoin or XRP, but don't let the quiet confidence fool you.
ETH has been rising steadily, gaining almost 50% in the last two weeks, and Monday morning was trading just shy of $3,800. With regulatory uncertainty waning, and the market treating Ether more like an investment than a utility token, it’s slowly reclaiming its 2025 highs.
Factor in the growing number of ETH-based ETFs , tokenized real-world assets (hello, Treasury bills onchain), and the boom in stablecoins running on Ethereum rails… and you’ve got a slow-burn bull case building brick by brick.
🦅 Washington, WAGMI?
So, what’s the takeaway?
For the first time, Congress passed crypto legislation that didn’t come with a hidden poison pill. The GENIUS Act, along with the CLARITY Act, have made more legislative progress in a week than years of courtroom wrangling and ETF lobbying combined.
Trump, with his pro-crypto stance and deep industry ties (after all, he did launch his own coin not too long ago), just turned crypto into a political weapon — and a market darling. Is 2025 shaping up to be the year Washington went full Web3?
Let’s hear it from you : Drop your thoughts in the comments and let’s spin up the discussion.

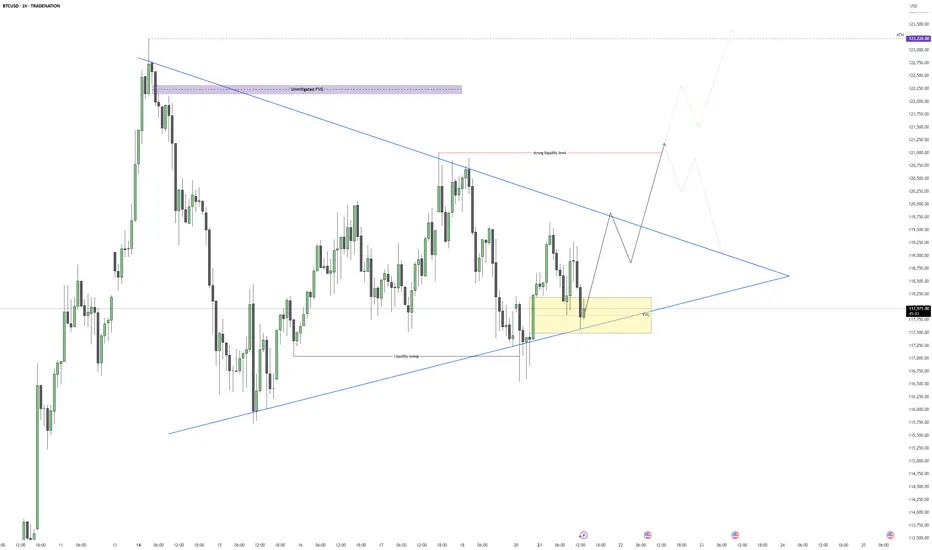
Bitcoin – Breakout Coming, But May Be a TrapBitcoin is trading within a well-defined bullish pennant structure on the 1H chart, with clear compression between a rising support and descending resistance. This pattern typically signals a continuation of the prior trend, but given the surrounding liquidity and recent FVG formation, the setup looks more nuanced. After a liquidity sweep earlier this session, price has rebounded and is currently respecting a newly formed 1H fair value gap within the pennant range.
Pennant Structure and Price Reaction
The consolidation is tight and clean, with buyers stepping in off the ascending trendline support. This area overlaps with a small FVG that has so far held as intraday support, suggesting active demand. Until this gap is violated, the structure remains intact and favors a breakout play to the upside. However, with a larger unmitigated FVG sitting just under 121,000 and a previous swing high forming a strong liquidity pool, the upside might be limited.
Buy Side Liquidity and Reversal Area
If price can push above the descending trendline, the next logical target is the buy side liquidity sitting around 120,800 to 121,200. That zone is also where sellers may step in, given it aligns with prior inefficiency and a probable stop hunt level. This makes it a high-probability reversal area. I expect price to take out that buy side before we get a meaningful shift lower again.
Displacement and FVG Reactions
Any clean displacement toward the upside, particularly into the 121k range, will be key to watch for rejection signs. Should we see rejection or an SFP at the liquidity zone, that would likely confirm the short-term top. At that point, I’d expect a return into the pennant or even a sweep of the trendline support again, setting up a deeper retracement.
Short-Term Expectations
In the immediate term, as long as price holds above the current FVG and trendline confluence, I expect Bitcoin to slowly grind higher and break out of the pennant. The objective is the liquidity above 120,800. Once that’s taken, I’ll be watching closely for signs of exhaustion or reversal patterns to get positioned short again.
Conclusion
Bitcoin is compressing within a bullish pennant and currently holding a fair value gap, suggesting bullish continuation in the short term. However, the real play may come after a sweep of the buy side liquidity near 121k, where I expect a bearish rejection and opportunity for downside positioning. The market structure remains neutral to bullish until that liquidity is tagged.
Disclosure: I am part of Trade Nation's Influencer program and receive a monthly fee for using their TradingView charts in my analysis.
___________________________________
Thanks for your support!
If you found this idea helpful or learned something new, drop a like 👍 and leave a comment, I’d love to hear your thoughts! 🚀
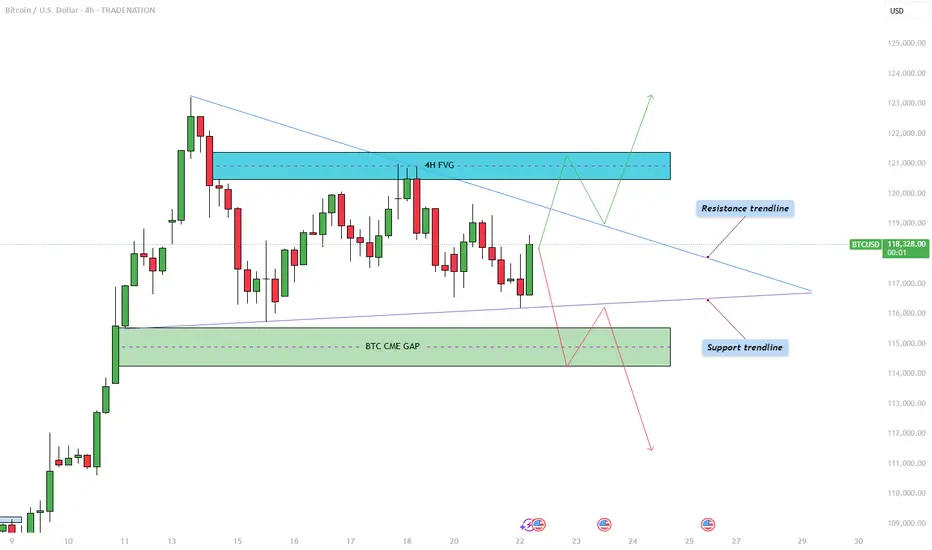
Bitcoin - Triangle pattern consolidation!The Bitcoin price action is currently coiling within a symmetrical triangle pattern on the 4-hour chart, as illustrated in the chart provided. After a significant bullish move earlier this month, BTC has now entered a phase of consolidation, marked by a series of lower highs and higher lows. This has formed a triangle pattern, suggesting an imminent breakout as price nears the apex. The upper boundary of the triangle acts as dynamic resistance, while the rising lower trendline provides firm support. Given the preceding upward momentum leading into this consolidation, the bias slightly favors a breakout to the upside, though the market can always surprise.
Bullish Scenario
In the bullish case, Bitcoin would need to break convincingly above the descending resistance trendline. Should that occur, the next key level to watch lies within the 4-hour bearish Fair Value Gap (FVG) between $120,500 and $121,400. This region represents an area of inefficiency where price moved rapidly in the past, and it is likely to attract selling pressure again. Bulls would ideally aim to reclaim this zone with strong momentum and potentially use it as support in a retest scenario. A successful retest of the triangle’s upper boundary could also trigger a liquidity grab above recent highs, particularly above the all-time high levels.
Bearish Scenario
On the flip side, a bearish breakout would involve BTC breaking below the ascending support trendline. If this happens, the most probable downside target would be the CME gap left behind from two weekends ago, located between $114,300 and $115,500. This price gap occurred due to the discrepancy between Friday’s closing price and Sunday’s opening price on the Chicago Mercantile Exchange, often a magnet for price reversion. After this gap is filled, it is possible that BTC sees a short-term bounce to retest the triangle from below, before potentially continuing lower to address further imbalances in price action.
How to Confirm a Valid Breakout
Trading triangle patterns can be deceptive, as BTC often exhibits false breakouts designed to trap traders on the wrong side. To confirm a valid breakout, it's crucial to observe at least a few 4-hour candles closing decisively above or below the triangle boundaries. Additionally, breakout strength should be accompanied by a noticeable increase in volume. A breakout without volume confirmation is often a sign of a fake move, and entering trades under such conditions can be highly risky.
Final Thoughts
BTC is currently consolidating within this symmetrical triangle formation, signaling a period of indecision and potential volatility ahead. While both bullish and bearish scenarios are plausible, it is essential to wait for clear confirmation before committing to a position. Patience and discipline are key, especially when navigating patterns prone to fake-outs. For now, remaining on the sidelines until a confirmed breakout occurs may be the most prudent strategy.
--------------------------
Disclosure: I am part of Trade Nation's Influencer program and receive a monthly fee for using their TradingView charts in my analysis.
Thanks for your support. If you enjoyed this analysis, make sure to follow me so you don't miss the next one. And if you found it helpful, feel free to drop a like and leave a comment, I’d love to hear your thoughts!
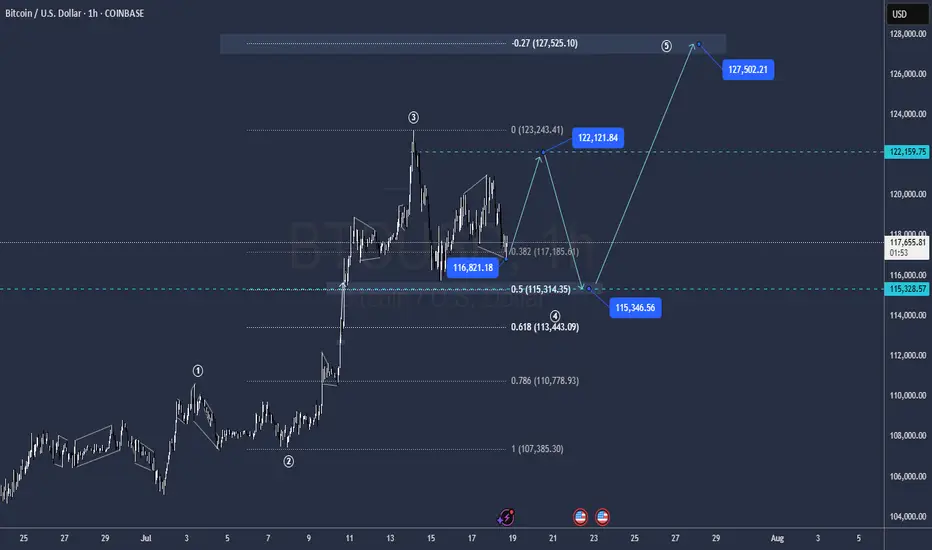
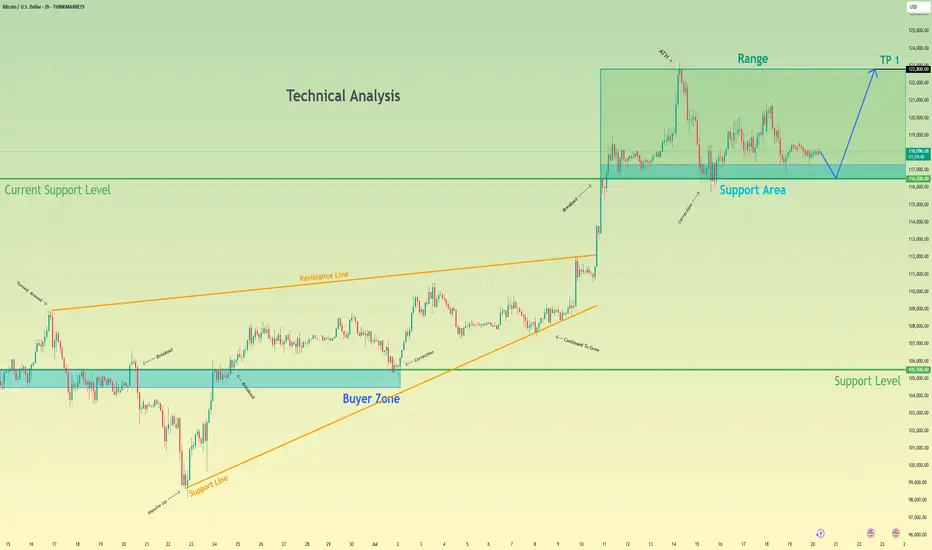
Bitcoin may bounce up from support area to 122800 pointsHello traders, I want share with you my opinion about Bitcoin. Analyzing the broader market context on the BTC chart, the past price action has carved out two significant technical structures: a wide trading range and a larger upward wedge pattern. The formation of this wedge indicates a generally positive market sentiment, though the narrowing price swings suggest a decrease in upward momentum. The foundation of the current structure was established around the buyer zone of 105500 - 104500, a level that has historically proven to be a robust floor. This historical behavior provides a critical reference for our hypothesis. Currently, we are observing bitcoin's price action closely, interacting with the current support area, located between 116500 and 117300. The character of the movement here is largely corrective and consolidative, pointing to a state of temporary equilibrium. This consolidation near the lower boundary of the wedge is a pivotal point. My thinking is that a final, brief dip to thoroughly test the 116500 - 117300 support area is a high-probability scenario. Such a move would effectively absorb remaining sell-side liquidity before a reversal. We can then anticipate an impulsive move upwards across the range. Therefore, the logical take-profit for this long position is set at 122800 points, as this level marks the upper resistance of the range and a natural target. Please share this idea with your friends and click Boost 🚀
Disclaimer: As part of ThinkMarkets’ Influencer Program, I am sponsored to share and publish their charts in my analysis.
BITCOIN Entering Cyclical Profit Zone. Risk should be limited.Bitcoin (BTCUSD) has just entered the first level of the Logarithmic Growth Curve (LGC) Resistance Zone, which is the light pink band. The Top of the previous Cycle was priced at the top of the band just above this.
In fact every BTC Cycle had this as the 'Profit taking Zone'. The market marginally touched that also within December 2024 - January 2025 but got rejected, almost in similar fashion as January 2021, which was a Double Top approach of the peak formation during the previous Cycle.
This Cycle Top is expected to be within October - November 2025, so we call this the 'Profit Taking Zone' for a reason. Risk exposure from now on should be getting more and more limited. Peak range (depending of the nature of aggression of potential Rate Cuts in September) could be anywhere within $140 - 200k.
Do you think this is the time to start limiting BTC exposure, perhaps moving some of the huge profits to alts? Feel free to let us know in the comments section below!
-------------------------------------------------------------------------------
** Please LIKE 👍, FOLLOW ✅, SHARE 🙌 and COMMENT ✍ if you enjoy this idea! Also share your ideas and charts in the comments section below! This is best way to keep it relevant, support us, keep the content here free and allow the idea to reach as many people as possible. **
-------------------------------------------------------------------------------
💸💸💸💸💸💸
👇 👇 👇 👇 👇 👇

Bitcoin: 130K AREA Upon Triangle Break Out.Bitcoin consolidating in a sub wave 4 and poised to break out (see triangle formation on chart). This breakout would be the sub wave 5 which can take price as high as the 133K to 134K area. In my opinion, this can be the completion of the broadest impulse wave (5th of the 5th). Wave counts aside, this is EXTREMELY important to recognize because it highlights significant price vulnerability and implies very high risk for longs (especially for investors). Of course, these price moves do not play out unless accompanied by a specific catalyst. We have the catalysts in place to drive price higher, but what can lead to a broad corrective structure? Who knows.
There are numerous drivers in play at the moment: the weakening dollar, tariffs, favorable legal environment, etc. And all the talk, videos and other propaganda all point to the continuation of this trend. The broader markets, metals, Ethereum, whatever asset it is, it is continuously going higher with little to no variance. The recipe for total complacency while risk is increasing. Back in April, before the pullback, things looked similar, and then the unexpected reaction to the tariff news at the time. No one saw that coming, and when it came, NO ONE saw or expected that we would be pushing all time highs across EVERYTHING in just a matter of months. When the top is in, the correction will likely be similar or worse. The market is be driven by a declining dollar, not a growing economy.
For the next leg higher into the 130's, what for swing trade or day trade setups. The trend is pretty clear, so it is all a matter of confirming mini pullbacks and continuation or reversal patterns on smaller time frames. Risk can be managed using reference levels on smaller time frames like 4H or 1H for swing trades. The Trade Scanner Pro also provides precise confirmations along with risk and profit objectives. There is plenty of opportunity and ways to play this, without having to get caught as an investor.
The scenario on the chart that illustrates price going to the 130K area assumes a break out occurring this week. IF the market chooses otherwise, like it breaks the low of the triangle instead, then it lowers the probability of the bullish scenario playing out. It's up to the market to choose, all I can do is map out scenarios based on the structure that is in play at the moment.
Either way, it is important to always accept that markets are mostly random. Price action is shaped by the perceptions of the future which can change on a whim. There is no need to feel like you are missing out because when things look their greatest, that is often the worst time to buy and vice versa.
Thank you for considering my analysis and perspective.

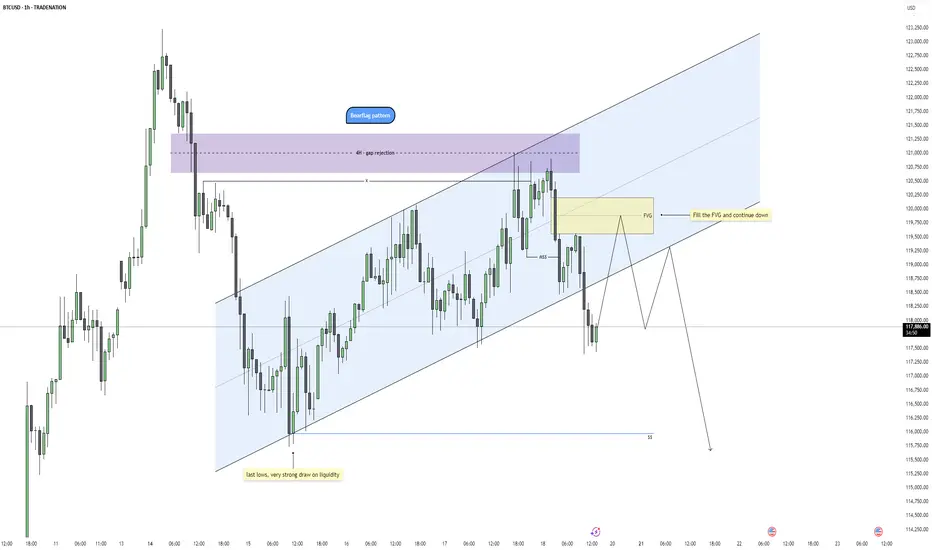
Bitcoin - Bearflag Structure Taking ShapeBitcoin is showing signs of weakness after a clean rejection from a 4H fair value gap, where price also swept the previous swing high. This aligns well with a broader bearish context as the market failed to sustain above the upper bounds of the trend channel, indicating potential exhaustion of the bullish correction.
Rejection Zone and Fair Value Gap
The rejection took place precisely within a 4H imbalance, adding confluence to the idea that this was a premium retracement in a bearish leg. The high formed inside that zone has now been swept, setting up conditions for distribution. A smaller 1H fair value gap was also left behind during the displacement move down, creating a clean area for price to return to and potentially react from.
Channel Structure and Bearflag Formation
Structurally, price has been climbing in a rising channel that resembles a bearflag pattern. The recent market structure shift broke the channel low, confirming that the rising structure is likely corrective. The rejection from the top of the flag and the subsequent breakdown align with a typical bearflag setup, suggesting a continuation move to the downside.
Short-Term Retracement Expectation
Before the next leg down, price may retrace to fill the unmitigated fair value gap while possibly sweeping the minor swing high that caused the current drop. This retracement would offer a premium shorting opportunity in alignment with the bearish bias, especially if internal structure remains weak on the lower timeframes during the return to the FVG.
Draw on Liquidity and Price Objective
The main objective for this setup is a sweep of the last equal lows near 115950, which represents a strong draw on liquidity. If the bearflag setup plays out fully, this area is highly vulnerable and could be the next significant target once the FVG is filled and lower timeframe distribution confirms.
Conclusion
Price has rejected from a 4H imbalance and swept liquidity to the upside, forming a clean bearflag structure. As long as price remains below the recent high and fills the 1H FVG without invalidating the shift, the path of least resistance looks to be down toward the liquidity resting below 115950. I’ll be watching for signs of weakness during the return to the FVG for a potential short trigger.
Disclosure: I am part of Trade Nation's Influencer program and receive a monthly fee for using their TradingView charts in my analysis.
___________________________________
Thanks for your support!
If you found this idea helpful or learned something new, drop a like 👍 and leave a comment, I’d love to hear your thoughts! 🚀
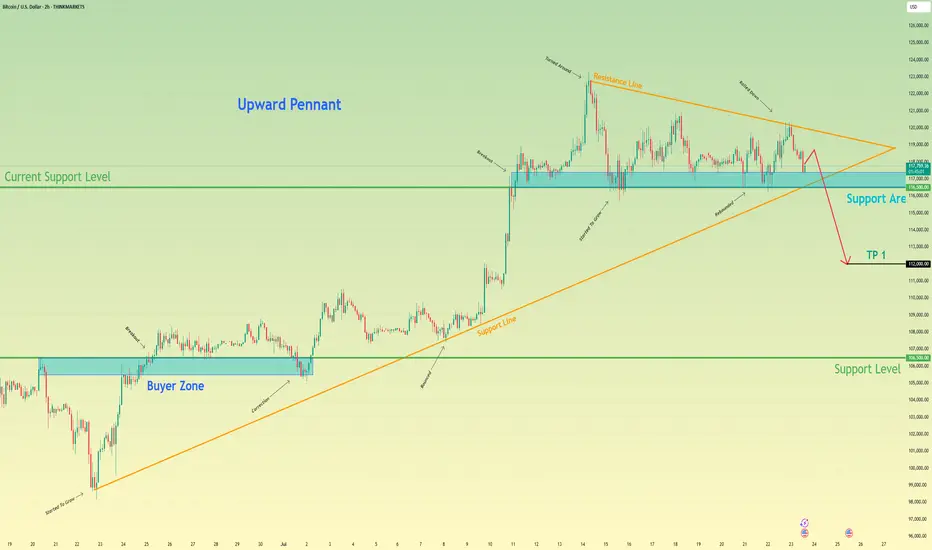
Bitcoin can start to decline and break support levelHello traders, I want share with you my opinion about Bitcoin. After completing a powerful upward impulse that originated from the buyer zone near 106500, the price action for BTC has transitioned into a corrective market phase. This consolidation has taken the form of an upward pennant, characterised by a narrowing trading range that suggests a significant directional move is forthcoming. Currently, the asset is undergoing a sequence of downward corrections within the pennant, exerting repeated pressure on the critical demand zone between 116500 and 117400. The importance of this zone is amplified by its confluence with the lower trend line of the formation itself. The primary working hypothesis is a bearish resolution, anticipating that persistent selling pressure will culminate in a decisive breakdown of this support. This event would act as a bearish breakout from the pennant, providing strong confirmation for the continuation of the downward impulsive momentum and shifting the local market structure. Therefore, the take-profit level is logically positioned at the 112000 mark. Please share this idea with your friends and click Boost 🚀
Disclaimer: As part of ThinkMarkets’ Influencer Program, I am sponsored to share and publish their charts in my analysis.
BITCOIN - Price can bounce up from support line to $125000Hi guys, this is my overview for BTCUSD, feel free to check it and write your feedback in comments👊
For a long time, the price was trading sideways inside a wide flat range between the $99000 support area and the $112000 resistance level.
After accumulating volume, bitcoin made a strong upward impulse and performed a breakout, pushing above the top of the flat.
Following this movement, the price action began to form a rising wedge pattern, moving between its clear support and resistance lines.
Recently, price tested the resistance line of the wedge and then started a predictable correction back down towards support.
Now, BTC is approaching the support line of the wedge, which aligns with the important horizontal support area around $112000-$113500.
I expect that the price can test this support line and then bounce up to the $125000 resistance line of the wedge.
If this post is useful to you, you can support me with like/boost and advice in comments❤️
Disclaimer: As part of ThinkMarkets’ Influencer Program, I am sponsored to share and publish their charts in my analysis.

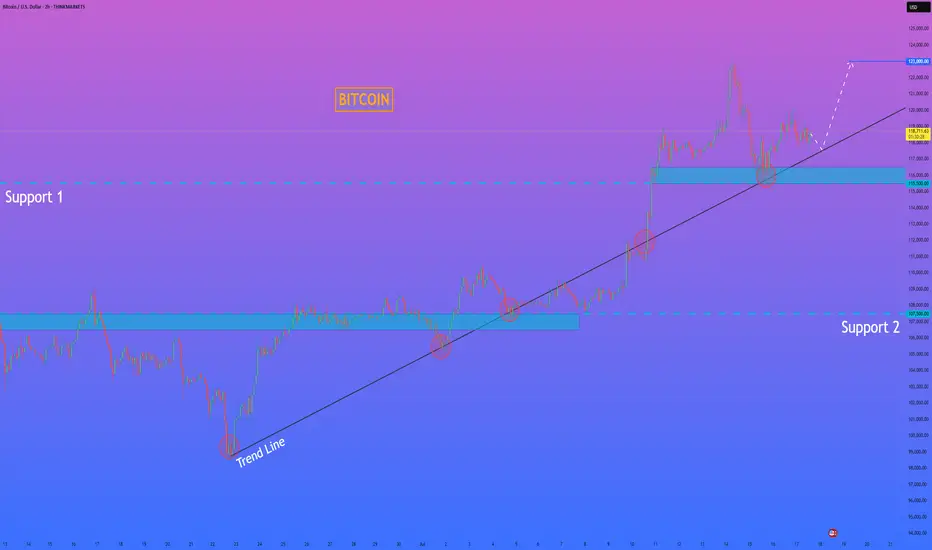
HelenP. I Bitcoin will correct to trend line and then start riseHi folks today I'm prepared for you Bitcoin analytics. The price has been trading in a strong bullish structure, clearly respecting the ascending trend line since the rebound from the 107500 level. Each time the price touched the trend line, it formed a higher low and continued the upward movement. After breaking through the important Support 1 zone (115500–116500), BTC made a strong impulse upward and reached a local high above 122000 points. Currently, the price is making a pullback and moving closer to the trend line again. This area has previously acted as a major point of interest for buyers, and now it's expected to play a key role once more. The support zone and trend line are converging, which makes this level critical for the next move. I believe BTCUSD will bounce from this area and continue its bullish momentum. My goal is set at 123000 points. Given the market structure, higher lows, and strong reaction from the support zones, I remain bullish and expect further growth from current levels. If you like my analytics you may support me with your like/comment ❤️
Disclaimer: As part of ThinkMarkets’ Influencer Program, I am sponsored to share and publish their charts in my analysis.
BITCOIN Accumulation Phase almost completed. Higher from here?Bitcoin (BTCUSD) is making a strong rebound on the bottom of its 1-month Channel Up and this analysis is in direct response to the one we published last week (July 15, see chart below), where we called this one-week consolidation:
We won't be going into too much detail then, as you can see the price made the Accumulation 2 Phase, after an identical +25.9% Bullish Leg, same as April's and by breaking below the 4H MA50 (blue trend-line), it hit the 0.236 Fibonacci retracement level.
As per the May 05 fractal hit, as long as the 4H MA100 (green trend-line) supports this Channel Up, the market should start Bullish Leg 3 towards Accumulation Phase 3 and eventually peak at around +43% from its start at $140000.
Do you think the pattern will continue to be repeated in the exact same order? Feel free to let us know in the comments section below!
-------------------------------------------------------------------------------
** Please LIKE 👍, FOLLOW ✅, SHARE 🙌 and COMMENT ✍ if you enjoy this idea! Also share your ideas and charts in the comments section below! This is best way to keep it relevant, support us, keep the content here free and allow the idea to reach as many people as possible. **
-------------------------------------------------------------------------------
💸💸💸💸💸💸
👇 👇 👇 👇 👇 👇

Bitcoin- 175-200k by year's endEvery major Bitcoin move over the last decade — whether a jaw-dropping bull run or a brutal crash — has shared one silent macro trigger.
It’s not the halving.
It’s not ETF hype.
It’s not Twitter sentiment or TikTok FOMO.
👉 It’s global liquidity.
And right now, this powerful force is expanding fast — the same setup that previously drove Bitcoin from $5K to $70K in under a year.
But here’s the twist: as of today, Bitcoin is already trading near $120,000, not $20K or 30k.
That means the engine is already roaring — and if this macro thesis holds, the next stop might just be $175,000-200.000 by year's end.
________________________________________
🧠 What Is Global Liquidity, Really?
Global liquidity = the total money sloshing around the financial system.
It’s often measured through M2 money supply, combining:
• Cash
• Checking/savings deposits
• Easily accessible liquid assets
The most comprehensive view comes from Global M2, which aggregates liquidity from 20 of the world’s largest central banks.
Right now, Global M2 is not just rising — it’s breaking to all-time highs.
And if history repeats itself, Bitcoin tends to follow this wave closely.
________________________________________
📅 Past Performance: Bitcoin and Liquidity Walk Hand in Hand
Let’s break it down:
• 2016–2017: Liquidity surges → BTC +5,000%
• 2020–2021: Post-COVID easing → BTC $5K to $69K
• 2018 & 2022: Liquidity dries up → BTC crashes ~70%
It’s a recurring pattern:
Liquidity drives the crypto cycle.
________________________________________
💡 Why Liquidity Moves: Interest Rates and Central Banks
Central banks control the tap.
• 🟢 Cut rates → Easier credit → More lending → More liquidity
• 🔴 Raise rates → Tighter credit → Less spending → Liquidity contraction
In 2022, the Fed tightened hard.
🧊 U.S. money supply shrank.
📉 Bitcoin fell from $70K to $15K.
But starting August 2023, the Fed paused, then pivoted.
Since then:
• 🟢 The U.S. M2 supply rebounded
• 🟢 Global M2 began expanding again
• 🟢 Over 64 global rate cuts were made in just six months — one of the fastest global easing cycles in history
The last time we saw this much cutting? 2020.
And we all know what happened to Bitcoin then.
U.S M2
________________________________________
🟢 Today’s Setup: The Engine Is Already Running
Fast forward to mid-July 2025:
Bitcoin is no longer at $30K — it’s already testing $120K.
Intraday highs have touched $123K, with a current consolidation zone between $117K–$120K.
This isn’t a "recovery rally" — we’re already in price discovery territory.
The question now becomes:
Is $150K and above next… or are we topping out?
________________________________________
📈 Charting the Path: Bitcoin vs Global M2
When we overlay Bitcoin price over global liquidity trends, one thing becomes crystal clear:
📊 Bitcoin tracks liquidity direction.
• When money supply expands, Bitcoin rallies.
• When money dries up, Bitcoin tanks.
Given that global M2 is at record highs, and liquidity conditions are easing globally, the chart suggests there’s still plenty of fuel in the tank.
And if we follow the same growth, Bitcoin could realistically reach $175,000 before 2026 kicks in.
________________________________________
Technically:
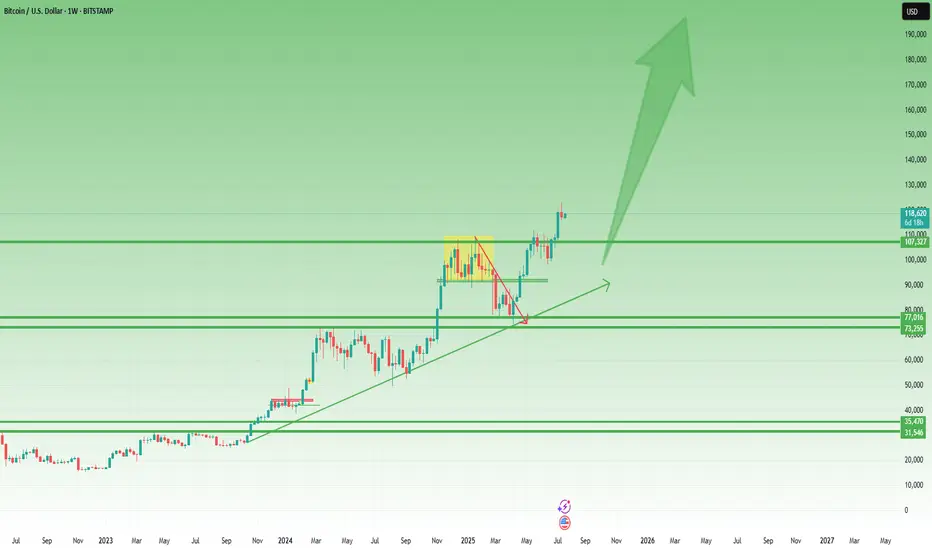
As we can clearly see from the posted weekly chart, you don’t need to be an expert to recognize the strength of the current uptrend.
While last week printed a small bearish Pin Bar, this alone shouldn’t raise major concerns — especially considering the presence of multiple key support levels, starting from the 110K zone.
In the context of a strong and well-established trend, such candles often reflect normal short-term profit-taking, not a reversal.
🎯 Conclusion – Don’t Fight the Tide
This isn’t about hopium.
It’s not moon talk.
It’s about macro flows and monetary velocity.
Ignore the noise.
Watch what the central banks are doing.
Because Bitcoin moves not on wishful thinking, but on waves of liquidity — and the tide right now is rising fast.
Whether $175K comes by year-end, one thing is clear:
We are in the middle of a liquidity-driven expansion phase, and Bitcoin is already responding.
Stay focused, manage your risk, and don’t chase — ride the wave. 🌊
BITCOIN Isn't even overbought yet!Bitcoin (BTCUSD) has been rising strongly within a structured Channel Up pattern but even this consistent and steady uptrend since the April 07 2025 rebound on the 1W MA50 (blue trend-line) hasn't been enough to touch the Pi Cycle's overbought trend-line (red).
Throughout BTC's historic Cycles, all Tops have been priced after the overbought level was breached, which currently sits around $180000 (and rising). Given that the 4-year Cycle Theory won't change, even a repeat of the 'weaker' +136.49% last rally of the previous Cycle (Jun-Nov 2021), would take us to $180k exactly but still will be below the overbought trend-line. This just shows the immense upside potential of the market even at the current stages.
So do you think we will get that kind of rally? Feel free to let us know in the comments section below!
-------------------------------------------------------------------------------
** Please LIKE 👍, FOLLOW ✅, SHARE 🙌 and COMMENT ✍ if you enjoy this idea! Also share your ideas and charts in the comments section below! This is best way to keep it relevant, support us, keep the content here free and allow the idea to reach as many people as possible. **
-------------------------------------------------------------------------------
💸💸💸💸💸💸
👇 👇 👇 👇 👇 👇

HelenP. I Bitcoin will rebound from trend line and rise to $123KHi folks today I'm prepared for you Bitcoin analytics. If we look at the chart, we can see a very clear and long-term bullish structure. The entire uptrend is supported by a major ascending trend line that has acted as a reliable foundation for the price for a significant amount of time. Currently, the price is consolidating above this crucial trend line and is interacting with the key support zone between 117500 and 116700 points. I believe that the most probable scenario here is a brief corrective move downwards for the price to properly retest the main ascending trend line. This type of retest is often a healthy sign in a strong trend, as it allows for the confirmation of support and gathers momentum for the next leg up. A strong rebound from this trend line would serve as a powerful signal that the buyers are still in control. Therefore, once the price confirms its bounce from this dynamic support, the path should be clear for a continuation of the uptrend. For this reason, my primary goal for this trade idea is set at the 123000 points. If you like my analytics you may support me with your like/comment ❤️
Disclaimer: As part of ThinkMarkets’ Influencer Program, I am sponsored to share and publish their charts in my analysis.

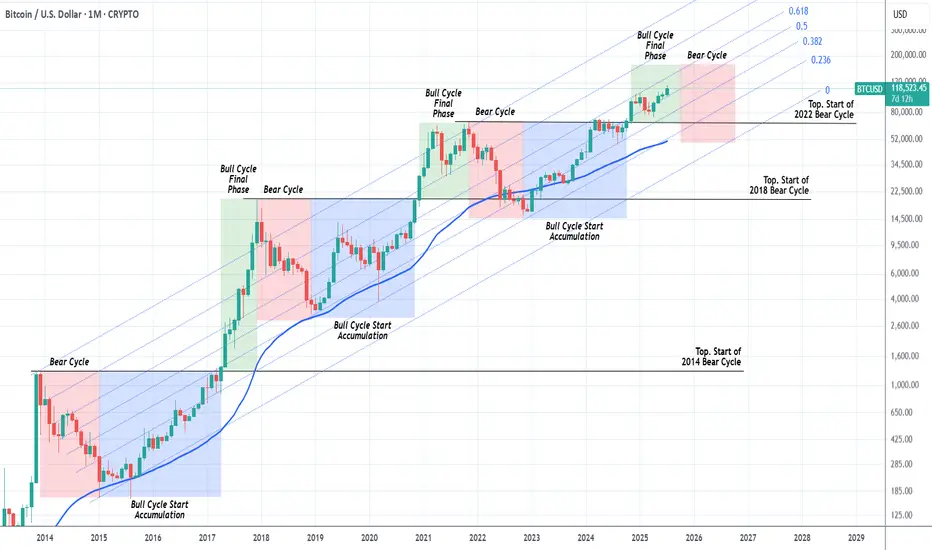
BITCOIN Should we start thinking about the next Bear Cycle yet?Bitcoin (BTCUSD) has had extremely symmetric (time-wise) Cycles in the past +10 years and this is a subject we've analyzed extensively many times. We've spent the last months projecting potential Targets for each stage of the bull run and only the last few are left.
This is exactly why we thought today's chart would be very fitting. The current Bull Cycle isn't over yet but also, based on the 4-year Cycle Theory, isn't far of either. By October 2025, that model suggests that all profit should have been taken.
As you can see, we are in the green zone, the Bull Cycle's Final Phase and since this Cycle has been trading entirely within the 0.236 - 0.618 Fibonacci Channel range, by October the price shouldn't be much higher than $160k.
In any event, this is a good guide, presented to you in a good time, to keep your mindset inside a long-term perspective and prepare you for not only the upcoming Top but also the next (1 year) Bear Cycle, which could again push the price below the 1M MA50 (blue trend-line), which would be a solid level for long-term buy positions again.
So do you think the Top is closer than it looks? Feel free to let us know in the comments section below!
-------------------------------------------------------------------------------
** Please LIKE 👍, FOLLOW ✅, SHARE 🙌 and COMMENT ✍ if you enjoy this idea! Also share your ideas and charts in the comments section below! This is best way to keep it relevant, support us, keep the content here free and allow the idea to reach as many people as possible. **
-------------------------------------------------------------------------------
💸💸💸💸💸💸
👇 👇 👇 👇 👇 👇
BITCOIN Former Resistance turned Support!Bitcoin (BTCUSD) is consolidating right above the December 17 2024 Pivot trend-line, a level that started off as a massive Resistance delivering two strong rejections but has now been turned into Support, holding this consolidation.
The 1D MA50 (blue trend-line) will soon cross this Pivot trend-line and will confirm it as a Support with the price technically looking for a new Bullish Leg towards the 1.5 Fibonacci extension at least ($138000), similar to the April - May uptrend, which also consisted of an Accumulation Phase much like the current.
Can the Pivot trend-line provide the necessary support for such a rebound? Feel free to let us know in the comments section below!
-------------------------------------------------------------------------------
** Please LIKE 👍, FOLLOW ✅, SHARE 🙌 and COMMENT ✍ if you enjoy this idea! Also share your ideas and charts in the comments section below! This is best way to keep it relevant, support us, keep the content here free and allow the idea to reach as many people as possible. **
-------------------------------------------------------------------------------
💸💸💸💸💸💸
👇 👇 👇 👇 👇 👇

TheKing Cycles- Nothing can be perfect in Life or in Trading, but you can always brighten up your day.
- Remember "Cycles are Cycles"
- Everything is in graph
- You can follow bears, predicting 10 years of recession, but we are in a big recession and for a long time already.
- You can fall in the deep and predict the darkness.
- i like to see the sunshine in the morning and i will always radiate warmth.
- Follow Hope, and always believe in your own judgement.
- Be Bold and do the opposite of what commons peoples think.
Happy Tr4Ding !

BTCUSD Outlook – Probabilistic Trade Setup in AI Liquidity Cycle
📈 BTCUSD Outlook – Probabilistic Trade Setup in AI Liquidity Cycle
🧠 WaverVanir DSS | VolanX Protocol | SMC x Institutional Forecast Alignment
We are now entering a pivotal BTC phase. Multiple timeframes and AI-backed forecasts converge on a low-volatility accumulation breakout, with price structure aligning for a leg toward $127K–134K. However, short-term model dispersion requires precise risk management.
🧠 Technical Confluence (SMC + Fib):
Clean BOS + CHoCH confirms bullish structure
Retest of equilibrium zone around $116.8K–$117.2K
Institutional FVG demand sits at $115.4K
Fibonacci extensions align with:
🎯 Target 1: $127,065
🎯 Target 2: $133,182
🎯 Max Extension: $134,397
🌐 Macro + Fundamental Catalysts:
Spot BTC ETF inflows remain net positive
AI liquidity theme continues to push institutional demand into BTC and ETH as non-correlated inflation hedges
Fed pivot odds increasing toward Q4 → expected risk-on environment
U.S. CPI cooling, potential for weaker dollar = BTC bullish
Bitcoin dominance holding near highs
🔐 Risk Metrics (WaverVanir DSS):
Metric Value
Forecast 30D Return +3.4% ($122,072.54)
Confidence Interval $105K – $125K
Model Agreement 2/9 Bullish
Prediction Volatility 14.45%
Sharpe Ratio 1.29
Max Drawdown (forecast) 32.9%
Direction Confidence 72.3%
🎯 Trade Setup (VolanX DSS Model + SMC Confluence):
Parameter Level
Entry $118,000–$117,200
Stop Loss $112,528 (4.7%)
Target 1 $120,443
Target 2 $122,072
Target 3 $127,065 (extended)
Target 4 $133,182–$134,397 (macro projection)
Position Size 25% of capital
Time Horizon 7–30 Days (Scalp + Swing Tiered Model)
📊 Probabilistic Scenarios (Next 30 Days):
Scenario Target Range Probability Notes
🔼 Continuation (DSS Base Case) $122K–$127K 60% Model + SMC aligned
⏸ Accumulation Zone $116K–$119K 25% Rangebound/Equilibrium trap
🔽 Breakdown <$112.5K 15% Triggered by macro shock or liquidity flush
📌 This setup is front-tested using the WaverVanir DSS system, institutional ensemble models, and real-time SMC structure. Not financial advice – for educational and strategic insight purposes only.
#WaverVanir #VolanXProtocol #BTCUSD #BitcoinForecast #CryptoStrategy #SmartMoneyConcepts #FibonacciTargets #AITrading #InstitutionalCrypto #MacroAnalysis #TechnicalSetup #RiskManagement #TradingSignals #QuantitativeModels #Bitcoin

Why Risk Management Is Your Only Real Superpower in TradingMany traders obsess over entries, indicators, or finding the “perfect” strategy…
But the real longevity in this game comes from how you manage risk — not how often you’re right. Obviously it all starts with using stop loss. I hope you already know it. We all learned lessons in trying to enter the top / bottom and it was really not the top/ bottom yet.
✅ Always use Stop Loss.
Interestingly more then 50% failed prop challenges are because traders dont use a stop loss.
Now your stop loss should always be adjusted to the market structure. Not always same lot size
Obviously some short-term scalping can be done with the fixed SL and TP distance. But most of strategies needs to adjust SL to the current structure. And here come the problem. Many traders use still same lot size even when the stop loss distance is different and thats the problem.
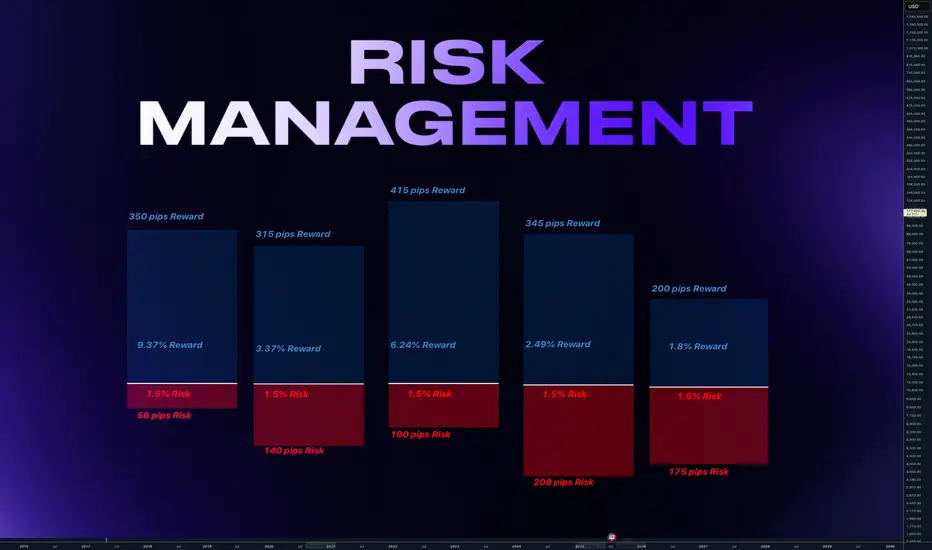
Let me just show you on 2 examples of series of trades.
We count with 5 identical trade setups
Let's assume we had 5 trades 1 winner and 4 losses.
📌 1) Using always same position size on 10K account
- Outcome of trades is various
- 1 win with fixed lot was small. Instead of fixed lot we could use higher lot size as the SL distance was small. This trade didnt covered other losses.
- Losses of other trades are various
- psychological affect - uncertainty increasing fear of loss
- total result after is -273 pips
- minus 2.7% and - $273
📌 2) Calculated risk 1.5% for each trade
- we risk 1.5% for each trade by adjusting lot size
- You always know how much you loose if you loose.
- You can maximize profits on high RR trades.
- Every trade will have same % value in your series of trades. This makes your statistics working
- first trade has made huge profit - other 4 losses were 1.5% each
- first trade covered losses and even made gains
- we again ended in minus 273 pips
BUT +$337 IN MONEY / AND + 3.37% PROFIT
📌 Final Conclusion
Although we modeled 5 completely same trading setups in first example we ended up loosing in pips and money. While in the second example with the completely identical setups we ended in profit and more stability of on our account but also with psychological preservation.
And this is power of risk management and it has much bigger impact especially to our trading psychology which is 80% of success.
🧠 Psychological Importance of Risk Management:
🧪 Reduces emotional pressure
When your capital is protected, you stop making desperate, fear-based decisions.
🧪 Builds confidence in your strategy
Knowing you’re safe even if a trade fails allows you to focus on execution, not outcome.
🧪 Eliminates fear of losing
Small, controlled losses become part of the process — not something to avoid or fear.
🧪Improves consistency and discipline
Following rules forces you to act like a professional, not a gambler.
🧪 Prevents burnout and mental fatigue
Managing risk = managing stress. Overexposure to loss drains your mental capital, not just your account.
📌 Final tip
There is no strategy on the world which is only winning. Losses are normal. Same like restaurant owner has a cost with rent and salaries for employees. We as a trader has cost of the doing the business in losses. You cant avoid them.
One loss out of 4 trades is nothing. But what if you get in to a loosing streak like me in the may? How did I survive?
Many people would start doubting the strategy , doing the changes, switching to trading different markets etc.. But NO, if you know your statistical data and stick with the your risk management it will keeps you going. You know that even 75% win rate doesnt guarantee that you cant get in to a loosing streak.
75% winning ratio means that out of 100 trades you will win 75. But still there is 25 looters. And you never know what would be distribution of wins and losses. So you keep going and its only possible if you calculate risk per trade and know how much is your max loss per trade not by using same lot size for random stop loss distance.
“Adapt what is useful. Reject whats useless and add whats is specifically yours.”
David Perk aka Dave FX Hunter
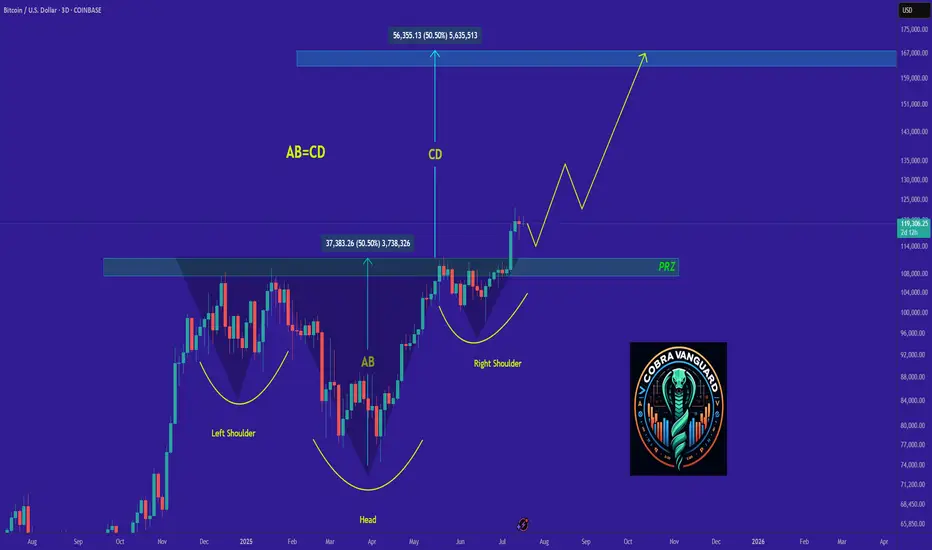
Bitcoin is bullish now & many Traders don't see it !!!I might be wrong and this might never happen, but it might come true From a technical perspective!!!
Remmember
Stay Awesome , CobraVanguard.
Bitcoin (BTC/USD) 4H CHART - BULLISH PENNANT PATTERN 📊 Bitcoin (BTC/USD) 4-Hour Chart – Bullish Pennant Formation
Bitcoin (BTC) forming a bullish pennant pattern on the 4-hour timeframe.
A bullish pennant often appears after a strong upward move, followed by a period of consolidation, and usually signals a continuation to the upside.
🔍 Key Highlights:
Pattern: Bullish Pennant – a continuation pattern that forms after a strong rally (flagpole), followed by a tightening price range.
Resistance Trendline: The upper black line showing lower highs — where price has repeatedly faced selling pressure.
Support Trendline: The lower black line showing higher lows — where buyers have been stepping in.
Breakout Zone: Price is nearing the apex of the pennant. A breakout above the resistance line would likely confirm the bullish move.
Target Projection: If the breakout is successful, the target is around $123,960, based on the height of the flagpole.
Breakout and Retest: The chart also shows a possible retest of the trendline after breakout, which is common and can offer a second entry point for traders.
Volume Watch: A valid breakout usually comes with increased volume. Monitoring this can help confirm the move.
📉 Downside Possibility:
If the price fails to break out and falls below the support trendline, it could invalidate the pattern and lead to a bearish move — possibly retesting the $110,000 area.
---
The market is at a decision point. If BTC breaks above the resistance and retests successfully, it could push toward $123K. However, traders should watch for both breakout confirmation and false moves.

Bitcoin Weekend ForecastIts in the middel of wave 4 correction, impulses are tradeable
Levels Highlighted in the chart