Butterfly

BinaryX (BNX) formed a bullish Butterfly for upto 84% rallyHi dear friends, hope you are well and welcome to the new update on Neblio BinaryX (BNX) token with US Dollar pair.
On a 4-hr time frame, BNX has formed a bullish Butterfly move.
Note: Above idea is for educational purpose only. It is advised to diversify and strictly follow the stop loss, and don't get stuck with trade

S&P 500 Inverse Head and Shoulders at PCZ of Bullish ButterflyThe S&P 500 has formed an Inverse Head and Shoulders pattern at the 800 EMA after bouncing from the Potential 1.414 PCZ of a Bullish Butterfly and filling the gap below. Now the SPX is looking to breakout Bullishly and Target the .618 Retrace to fill the Gap above and perhaps go even further beyond.

BUTTERFLY BULLISHNZDCAD has formed an advance harmonics pattern butterfly on on its hourly chart.
The price is trading above the EL: 0.83618.
Targets:
61% AD: 0.84192
79% AD: 0.84370

#THEUSDT $THE #THE THERE ARE TWO NICE PATTERNSYou will see nice price turning and also there are Libra and Harmonic Butterfly pattern.
Lets see what will happens

$GC $GOLD $XAUUSD 3 order entry 1824.60 (filled) , 1824, 1823 (order at 23 23 is 3x size ) stop below 1.414 ext, needs a bit of room imo in $GOLD/

GBPAUD BEARISH BUTTERFLY PATTERN !!GBPAUD has formed a bearish butterfly pattern.
This is a good trade opportunity to take.
Trade with care.
I will update at here if the trade opportunity is given.
Do follow and boost if you found this idea helps.

My EURUSD Buy Opportunity.FX:EURUSD
With the direction of EU on D1 Timeframe, EURUSD should come to 0.05/0.046 only then will I look for a BUY opportunities since the flow of the river is to the upside.

Perfect automated detection of BlackSwan & Butterfly PRZ - ShortA bearish-type big BlackSwan pattern occurred.
If the price rises to 22.300, a bearish-type Butterfly pattern could occur.
Short after seeing the rebound.
*Harmonic patterns are automatically detected using the indicators below.
- Harmonic auto-detect PRO

WHOOSH - the time is now.The Gartley harmonic patterns speak for themselves.
R/r nice.
Not a financial advice.

LONDON AJ BUTTERFLY/EXT LIMIT ON ATRIdea did not post, in line with JPY weakness, short term money has been grabbed and butterfly harmonic has been painted. Let's see if market follows through on what could be a big RR trade

Fractal Harmonic Patterns on FLOWUSDTBeautiful setup. I'ma be buying half of my planned size now. There might be a drop to 2.8$ but not lower. if that happens, I buy more cheaper. Stop is very tight there and at least a bounce is almost guaranteed. But, iIf it starts growing without any retrace, I'll buy the remaining size when it closes 4H or bigger candle body above 3.3$. Because that would confirm price got into the "fast and furious mode growth".


ASIA UJ BUTTERFLY LIMIT ATRHarmonic pattern recognized and taken as a limit sell order on USDJPY, with SL of 13 pips for a minimum 1:2 RR
Probability of success: 50%

USD/JPY Short Term BUY....
Hello Traders, here is the full analysis for this pair,
let me know in the comment section below if you have any questions,
the entry will be taken only if all rules of the strategies will be
satisfied. I suggest you keep this pair on your watch list and see if
the rules of your strategy are satisfied.
Dear Traders,
If you like this idea, do not forget to support with a like and follow.
PLZ! LIKE COMMAND AND SUBSCRIBE.

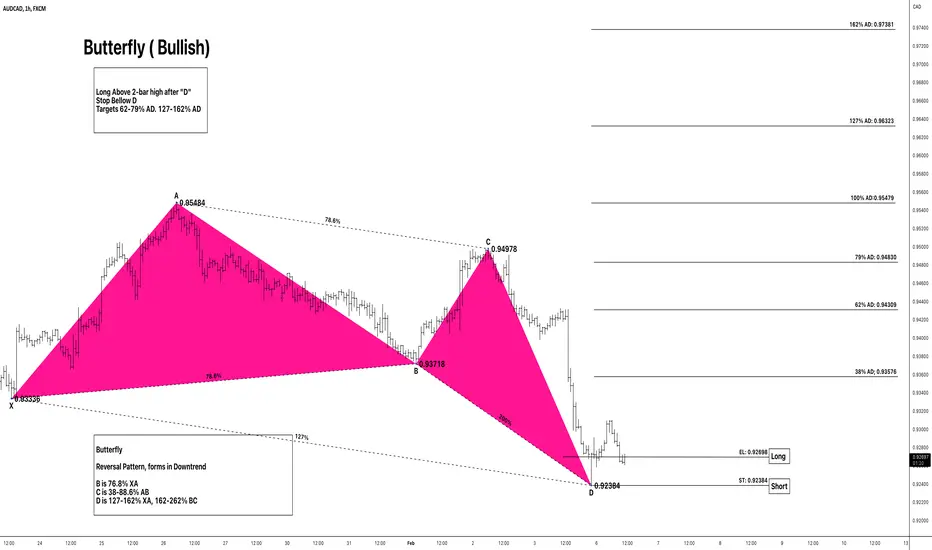
BUTTERFLY BULLISHAUDCAD has formed an advance harmonics pattern on its hourly chart (Butterfly)
The price is trading the EL: 0.92698.
ST: 0.92384
Target1:
62% AD: 0.94309
100% AD:0.95479
BUTTERFLY BULLISHEURCAD has formed an advance harmonics pattern on its hourly chart Butterfly bullish.
The price is trading above EL: 1.43789.
ST: 1.43529
Target1:
62% AD: 1.45311
79% AD: 1.45795
Target2:
127% AD: 1.47196
162% AD: 1.48193

BUTTERFLY BEARISH GBPCAD has formed an advance harmonics pattern (butterfly) on its hourly chart.
The price is trading a PCZ price completion zone.
Aprox EL: 1.62790.
ST: 1.63030
Target1:
62% AD: 1.61598
79% AD: 1.61239
Target2:
127% AD:1.60208
162% AD: 1.59481

Buy and sellimport backtrader as bt
class MovingAverageCrossover(bt.Strategy):
params = (
("fast_window", 20),
("slow_window", 50),
("order_percentage", 0.95),
("take_profit_percentage", 0.03),
("stop_loss_percentage", 0.02),
)
def __init__(self):
self.fast_average = bt.indicators.SimpleMovingAverage(
self.data.close, period=self.params.fast_window
)
self.slow_average = bt.indicators.SimpleMovingAverage(
self.data.close, period=self.params.slow_window
)
def next(self):
if self.position:
if self.data.close >= self.sell_price:
self.sell()
elif self.data.close < self.stop_loss:
self.sell()
else:
if self.data.close > self.fast_average :
self.buy_price = self.data.close * (1 + self.params.take_profit_percentage)
self.stop_loss = self.data.close * (1 - self.params.stop_loss_percentage)
size = self.params.order_percentage * self.broker.cash
self.buy(size=size)
if __name__ == "__main__":
cerebro = bt.Cerebro()
data = bt.feeds.YahooFinanceData(dataname="AAPL", fromdate="2020-01-01", todate="2021-12-31")
cerebro.adddata(data)
cerebro.addstrategy(MovingAverageCrossover)
cerebro.run()

EUR/GBP Need To Buy Contamination .....
AronnoFX will not accept any liability for loss or damage as a result of
reliance on the information contained within this channel including
data, quotes, charts and buy/sell signals.
If you like this idea, do not forget to support with a like and follow.
Traders, if you like this idea or have your own opinion about it,
write in the comments. I will be glad.

SHEMAROO: Bullish Butterfly pattern on DTFSHEMAROO: Bullish Butterfly pattern on DTF
PRZ 1: 119.80
PRZ 2: 125.50
Next buy level: 110.60
Note: Created for testing pattern..

Mangalore Chemical: Bullish Butterfly pattern on DTFMangalore Chemical: Bullish Butterfly pattern on DTF
PRZ 1: 73.25
PRZ 2: 74.05
PRZ 3: 72.30
Note: Created for testing pattern..

USDJPY BUTTERFLY BULLISHPattern Recognition is a trader/investor asset to identify possibles trades setups.
The markets demonstrate repetitive patterns where prices oscillate between one set of price ratios to another making price projections possible.
Market trends can be defined by geometric relationships as they exhibit harmonic relationships between the price and time swings.
Many traders use "cycles" and "harmonic" relationships to project future swing price/times.
These Harmonic price movements produce symmetric rallies and declines to give traders an advantage to determine the key turning points.
USD JPY Hourly chart We can identify a Pattern Structure ( Butterfly Bullish).
The concept of Harmonic Patterns was established by H.M. Gartley in 1932. Gartley wrote about a 5-point pattern (known as Gartley) in his book Profits in the Stock Market. Larry Pesavento has improved this pattern with Fibonacci ratios and established rules on how to trade the “Gartley” pattern in his book Fibonacci Ratios with Pattern Recognition.
There are few other authors who have worked on this pattern theory, but the best work to my knowledge is done by Scott Carney in his books of “Harmonic Trading.” Scott Carney also invented patterns like “Crab,” “Bat,” “Shark” and “5-0” and added real depth of knowledge for their trading rules, validity and risk/money management.
USDJPY Bullish Butterfly
EL: 128.476
ST: 128.111
Wall: 129.360
38% AD: 130.651
Target:
62% AD: 132.230
79% AD: 133.340
BUY above EL: 128.476 following up with a MSL (Market Structure Low) or 2-3 lines breaks
Pattern Invalidation 128.111
