LONG XAUUSDGold (XAU/USD) – Bullish Outlook Backed by Harmonic Structure and Market Fundamentals
We are currently anticipating a bullish continuation in XAU/USD, supported by a combination of technical signals and macroeconomic drivers.
On the technical side, the recent completion of a Bullish Butterfly Harmonic pattern suggests a potential reversal zone (PRZ) has been confirmed, indicating strong buying interest at the 3195 level. The symmetry within the XA, AB, BC, and CD legs of the harmonic structure aligns well with Fibonacci ratios, reinforcing the credibility of this bullish signal.
Additional confluence is found with:
Strong horizontal support near 3195
Positive divergence on momentum indicators (e.g., RSI )
Price action respecting the 50 EMA as dynamic support
On the fundamental front, growing market uncertainty, dovish expectations around global central bank policy, and sustained geopolitical tensions are likely to keep gold attractive as a safe-haven asset. Moreover, persistent inflation concerns and weaker global growth forecasts continue to support the upside potential for precious metals.
Trade Setup:
Entry: 3195
Take Profit 1: 3225
Take Profit 2: 3245
Stop Loss (Recommended): 3180
Risk Management Note: Proper risk-reward ratio and position sizing are advised, considering increased volatility due to upcoming economic releases and geopolitical developments.
Butterfly

Short on BTCUSDBitcoin (BTC/USD) – Bearish Outlook Amid Economic Uncertainty
We anticipate a short-term bearish trend for BTC/USD, driven by escalating economic concerns and the recent resurgence of trade tensions. The imposition of new tariffs has negatively impacted market sentiment, contributing to downward pressure on Bitcoin. The current price structure also suggests limited bullish momentum, favoring another potential sell-off.
From a technical perspective, forming a Bearish Butterfly Harmonic pattern further supports the expectation of a downward move.
Trade Setup:
Entry Level: 84,500
Take Profit 1: 78,500
Take Profit 2: 74,500
We recommend monitoring macroeconomic developments closely, as further deterioration could accelerate the bearish trend.

PHGC - Egyptian stock#PHGC timeframe 1 DAY
Created a bearish Gartley pattern
Sell point around 1.48 ( PRICE NOW 1.50 )
Stop loss / reentry 1.574 (estimated loss -6.35%)
First target at 1.267 (estimated profit 14.40%)
Second target 1.077 (estimated profit up to 27.63%)
NOTE: this data according to timeframe 1 DAY.
It's not an advice for investing, only my vision according to the data on chart.
Please consult your account manager before investing.
Thanks and good luck.

Fiery Butterfly of Natural Gas Price in 2025. In the previous analysis, we predicted the natural gas price trends from 2022 to the end of 2024 using harmonic patterns, which turned out to be highly profitable .
Now, in this idea, we aim to forecast the price movement for 2025 Based on the harmonic patterns, it seems likely that gas prices will rise and reach the golden level of the Butterfly pattern before experiencing a significant drop.

[Update ETH]: $1350-->$7000-->$800?I think we may go to retest the 0.75 level by the end of May, then blow off top very fast in Q4 to high 6000/low 7000. Then I think we gonna go slowly down <1000 until the end of this decade.
Mini bear market-> Fed will panic-pivot end of Q2 -> Final Blowoff top Q3/Q4-> Mega Recession

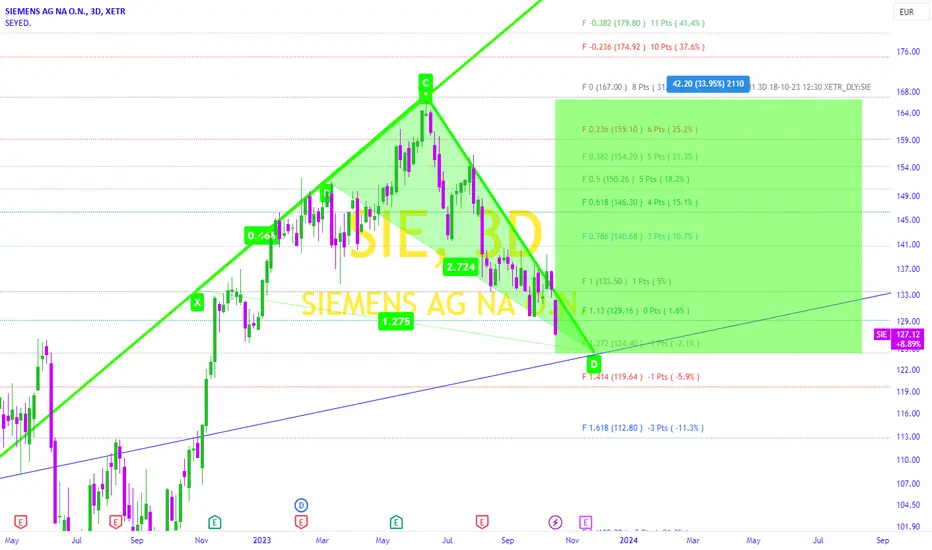
Effort of the Young Green Butterfly to Raise the Siemens Flagthe detail is shown in the above Chart.
I made this Idea based on Candlestick Analysis and Fibonacci Tool .
The Buyers' Crab could reach the highest point at the price of 167 euros.
The Bearish trend started and siemens flag is falling and approaching to the golden level of buyers crab .
The past trend of sellers' candles has formed a motivated green butterfly pattern
So we can expect this young Butterfly to raise the Siemens flag again.
Siemens Is Great .
Good luck.
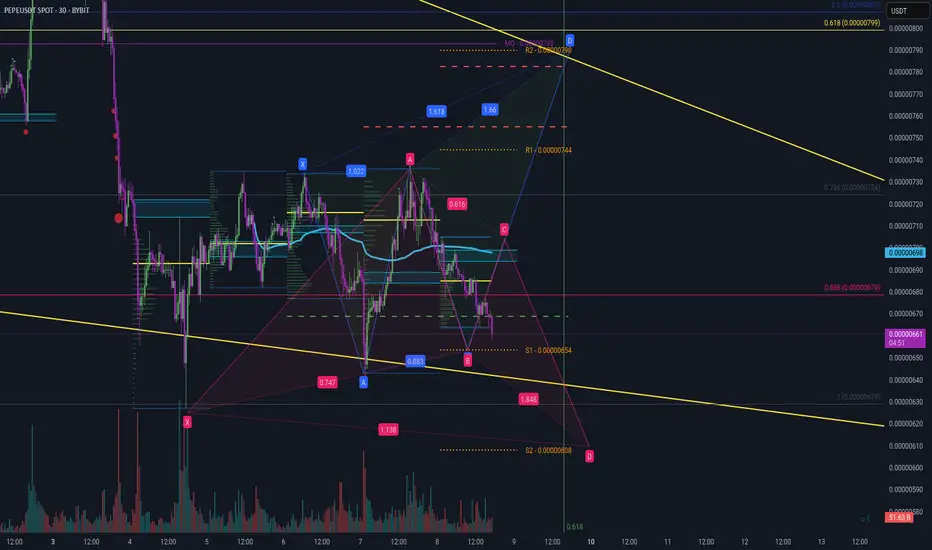
Pepe Daily Targets 08 March 2025Hi guys, just thought to post my ideas for a setup.
Bullish Gartley at S2 retracement (RED)
Bearish Gartley at S1 retracement (BLUE)
Wait for confirmations - don't rush into any trades.
End of hibernation for the bears?AMEX:SPY is at a pivotal point and could potentially be at the top of the bullish cycle that began in October 2022. If this prediction proves accurate, I think we could see a maximum low of $510 for this year. There are a couple of caveats, including one that will be a clear indicator of whether or not this wave count is accurate, which I will explain later.
On the 1000R chart ($10), this uptrend was confirmed by Supertrend and volume activity. Volume drastically increased at the start of Wave (3) in March 2023 and did not taper off until the start of Wave (4) in July 2024. This was the strongest impulse in the trend, which is common for Wave 3. You can also see the ADX line of the DMI indicator (white line) was at its highest level during that period.
Assuming Wave (5) is already complete, we can observe that the volume in Wave (3) was considerably less than Wave (5).
Other observations supporting this wave count:
- Wave (4) retracing into the territory of Wave 4 of (3)
- Alternation in corrective patterns between Wave (2) and Wave (4); flat in (2) and straight down in (4)
- Wave (5) extending to nearly 1.618 of (1)
While the points I’ve made so far suggest that the market may be on the verge of a crash, the image gets more complicated when you take a closer look on the 250R chart ($2.50). I’ll start with what I’m counting as Wave 4 of (5). The price ended at ATH in Wave 3 and then corrected in an unmistakable five wave descending wedge pattern. This can only be a fourth wave of a larger impulse, so we can conclude with a fair amount of confidence that the wave that follows will be the last.
Here is where things get interesting. The price moved from $575 on January 13th to a slightly higher ATH of $609.24 on January 24th before being rejected again. This uptrend unfolded in a typical bullish pattern and left a notable gap at $584, which is the only gap still left unfilled. The trend change is confirmed on the moving averages. Notice the serious drop in volume that followed as well.
Despite the shift in volume, there are two issues I have with this wave count that are preventing me from calling this a confirmed correction:
1. Wave 5 of (5) was awfully short and only extended roughly $2 above the end of Wave 3 of (5). This does not break any rules, but it is unusual.
2. What I have labelled as Wave B of Wave (1) or (A) of the correction made a new ATH on Friday February 14th, which should invalidate this wave count since the end of Wave 5 of (5) should be the peak.
The second point is why some may think that we are about to resume the larger bull trend, however there is a possibility that they are mistaken based off the PA on the actual index SP:SPX and futures CME_MINI:ES1! . On the SP:SPX chart, we can see that the index did not break the ATH at $6128.18 set on January 25th, and instead rejected at $6,127.24.
CME_MINI:ES1! also failed to notch a new ATH on Friday and I have observed the price action create a nearly perfect bearish butterfly pattern. Also notice how the volume is significantly lower than in the uptrend that began on January 31st.
So the question remains: are we at a tipping point or will the bulls regain control? Right now it’s unclear, but I will keep my bearish sentiment until SP:SPX makes a new ATH, which will invalidate this theory. Since only the ETF that tracks it only made a slightly higher high on low volume, I’m skeptical of the PA on AMEX:SPY at the moment. This is why I entered puts on Friday.
If the trade plays out, I expect the price to quickly move to fill the gap at $584, which is still conveniently located at what I cam considering the 1.236 extension of Wave A, which is a common target extension in flat corrections. I will keep my puts open until this idea is invalidated, as the Wave C drop will likely be caused by a news event that could come at any time. Let me know if you guys are seeing the same thing or something different. Good luck to all!

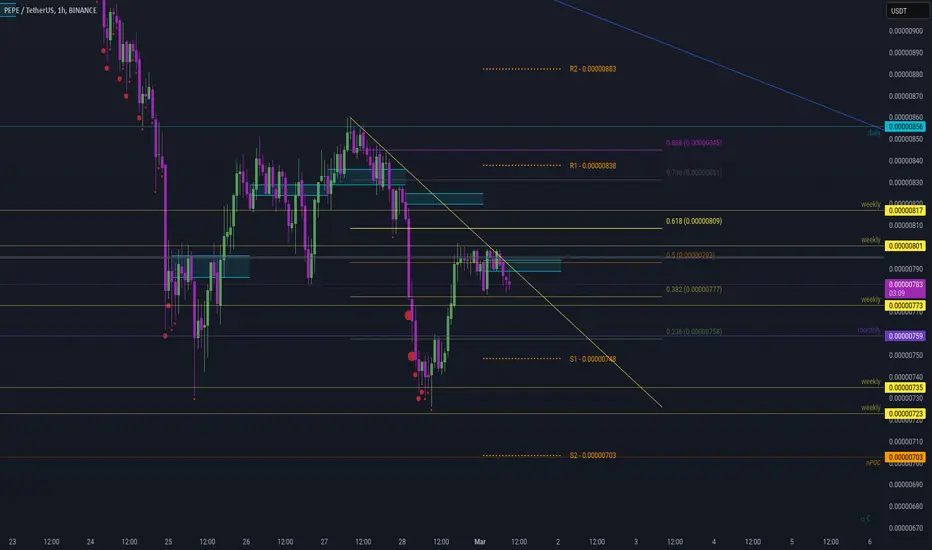
Pepe USDT Day Trading Idea 1 March 2025Pepe USDT Day Trading Idea
Fib drawn from high to low of the rane were currently in. Obvious rejectioon at 0.5 and forming a Triangle Pattern if you will.
Day idea 1:
Possible 0.236 support with monthly as a backup at that level or S1 at 0.0000748. Trend reversal from suppoort with a possible high between 0.382 and 0.888 or R1 at 0.0000838. If S1 is hit be aware of the monthly being resistance at 0.236.
Day idea 2:
Possible S2 at 0.0000703 which fulfills the larger range Butterfly Gartley depicted in previous post posted here for reference.
For S and R levels I'm using the "Day Trading Booster BY DGT". Great indicator for day trading levels.
Pepe Bearish Bat Harmonic BUT into a Bullish Gartley with FibExThis might blow our minds.
Bearish BAT Harmonic to 0.5 playing out to possibly the red C wave retracement 0.382 BUT at the same time being the 0.618 from X to A leading into a bullish Gartley! Bullish gartley B to C can reject at 0.382, 0.5, 0.618 or 0.888 depicted is at 0.618. For a retracement back to a D.
Fib retracement from X to A to D gives a high range of the Butterfly Harmonic posted here:
This corresponds with BTCUSDT Gartley Harmonic which gave me this idea posted here:
Just an idea as it's very early but its an idea! So to be clear, the Bat Gartley (RED) needs to play out first before the Gartley Harmonic (Green) plays out.
Happy trading, trade with risk management and all that.

AMZN butterfly & $192.The stock trend of Amazon (AMZN) in 2024 showed significant upward movement, with the price reaching a peak of $230 and a low of $145 during the year, driven by strong market performance and investor confidence.
However, In 2025 based on technical analysis, the formation of a Butterfly harmonic pattern suggests a highly probable correction toward the $190 level .
This pattern, often appearing after an extended bullish trend, indicates a potential reversal. Given the current market dynamics, the likelihood of such a drop is considerable.
Investors should closely monitor key support levels and prepare for possible downside risks while making informed decisions.
SEYED.

Butterfly for BTCThis is called a Bullish Butterfly Harmonic pattern
Looking to buy in the black box

Pepe Butterfly Gartley UpdateHey guys, Pepe Butterfly Gartley just hit the target low at (D) which is now extended to 1.618 if the target is probably hit.
For S and R levels I'm using the "Day Trading Booster BY DGT". Great indicator for day trading levels.
Target high on D retracement back to (A) top of the range.
This is an update that originally started here:
This idea also goes with my posted idea "Pepe USDT Day Trading Idea 1 March 2025".

The time of problems has passed, now only up to conquer the heigIn fact, everything is going perfectly for us and now is the perfect moment to buy a company for many years to come

GBPAUD back at key resistance! Intraday Update: The GBPAUD is up against some key resistance. This is the 127% ext of the Aug 2024 highs to Act 2024 lows, the 161% ext of the Oct 24 highs to Nov 2024 lows. And also has completed a bearish butterfly while we trade below the 2.0315 level resistance.

XAUUSD Weekly Butterfly and DivergenceXAUUSD weekly, has butterfly pattern with RSI divergence
Likely retrace back from here to around the 50ema, which is around the 2500 level give or take

Pepe Butterfly Gartley Update - Daily Fib Resistance LevelsHey guys, Pepe Butterfly Gartley just hit the target low at (D).
Although a bullish gartley, we still have to make sure we dont lose the lowest low just put in. That would invalidate the pattern.
Fibs - bright numbers on the right are all valid resistance levels up until 0.618 to see lower! Would be good to clear 0.618 and monthly resistance for some strength in the uptrend.
Usually this pattern is bullish in terms that the price will retrace (up) to point A.
Down trend, given the big picture. We still may be in a downtrend to fulfill Wave 5!
At the moment very strong down trend, trade with caution as don't be only bullish. Look for rejections at 0.236, 0.5, and 0.618. Opening times more significant from now 1 hour 15 minutes time.

The reduction target is $70-73According to the Butterfly pattern, the Fibo perfectly converges the decline to the target of $ 70-73. The timing is not clear when we will get there, but according to the schedule of the decline of #HSI1, we should reach it by October 2023, there will be an excellent point for going to long to new heights.

PTM Platinum Asset Mgmt (ASX) Monthly 2Monthly chart has clear 5 wave move into longer term bullish fibonacci cluster level
This stock has taken a battering over the last few years and recently there is a monthly spinning top outside of the bollinger bands and a gap on the weekly at $1.05, so there is at least 25-30c to close this...
I'm looking at the longer term bullish bias, so wont be trading this as a short to medium term trade...
Full disclosure... I already have a position in this stock within the last month or so

PTM Platinum Asset Mgmt (ASX) Monthly Long term butterfly pattern on the Monthly
Hit long term fibonacci cluster,
I've already bought this as a long term position

MARA about to increase +18% in stock valuation!!Based on my trading algorithms MARA will fly for +18% gain

Bearish Logscale Butterfly T2 with Bearish MACD & RSI DivergenceBitcoin appears to be set up at the 1.902 HOP for a Type 2 retest of the Logscale Bearish Butterfly that resulted in a major Type 1 reaction from the 1.618 Fibonacci Extension back in 2021, where it dropped from $69,000 to $15,500 over the course of several months before ultimately bottoming at the PCZ of a smaller Log Scale Bullish Butterfly which signaled the Type 2 run up to the 1.902 HOP of the Bearish Butterfly where it is now. As it tests this level the MACD and RSI are both Diverging Bearishly and the RSI especially seems weak as it now struggles to even crack above 70 level. This signals to me that the RSI has confirmed exhaustion after divergence at the HOP and that it is likely ready to start declining further.
Saying as though this is the type 2 test, I'd suspect that we'd make a lower low than our previous Type 1 reaction low at $15k, perhaps landing us around $12-10k; but if those levels don't hold It would be technically viable to assume BTC would go for the 0.886 retrace at around $4.6k

