Bitcoin (BTC) forming bullish Butterfly for upto 22% pumpHey dear patrons, hope you are well and welcome to the new trade setup of Bitcoin (BTC)
Previously we had a nice trade of Bitcoin:
Now on a daily time frame, Bitcoin is forming final leg of bullish Butterfly pattern.
Buy between: $26837 to $25313
Sell between: $28019 to $30882
Stop loss:
Below $25313
Possible profit and loss ratio:
As per the above targets, this trade has a profit possibility of 22%, and a loss possibility upto 6%.
Note: Above idea is for educational purpose only. It is advised to diversify and strictly follow the stop loss, and don't get stuck with trade
Butterfly

NANO (XNO) coin formed bullish Butterfly for upto 781 pumpHi dear friends, hope you are well and welcome to the new trade setup of NANO (XNO) coin with US Dollar pair.
Previously we had a nice trade of XNO:
Now on a monthly time frame chart, NANO has formed a huge bullish Butterfly pattern:
Note: Above idea is for educational purpose only. It is advised to diversify and strictly follow the stop loss, and don't get stuck with trade

Butterfly Complete Near All Time High! Butterfly completed on OIL close to the all time high/HTF supply zone, price currently rejecting has broken internal structure, but i want to see price come up and mitigate that supply zone/continue to fail the same level before taking sells, i was going to sell the breakout as OIL moves fast but again to risky as it can also pullback super fast, waiting for more confirmation (Failed highs/wyckoff etc) Probably see a spring or some manipulation into those highs before price decides to reverse (If it does)
Let me know your thoughts!
* Disclaimer **
These ideas I never trade until the end target with my initial lots, I focused on high probable entries with higher lots and use a specific partial taking strategy giving me a very high win rate and take most of my profits very early, I only leave a small % of my capital to run the entire trade. On the flip side im constantly monitoring LTF momentum and will close early if things change, these analysis's are for research purposes only.

Bullish Butterfly Setup on BTCNoticed a Bullish Butterfly Harmonic being made on BTC on the 4 hour, Ima take my chances and long BTC at 28.5k and 28k with a price target anywhere from 33-34k

Taking a long position on EURGBP It is time to go long on EURGBP.
The pair has reversed downwards. However there is an opportunity to capture about 30+ pips by going long.
There is a butterfly pattern and M15 divergence.

USOIL_D1 Bearish Butterfly Pattern & H4 RSI Bearish DivergenceUSOIL_D1 Bearish Butterfly Pattern & H4 RSI Bearish Divergence Formation. if like my idea follow me and share your opinion in comments. Thank you.

Dogelon Mars (ELON) formed bullish Butterfly for upto 252% rallyHi dear friends, hope you are well and welcome to the new trade setup of Dogelon Mars (ELON) token.
On a weekly time frame, ELON has formed a huge bullish butterfly pattern.
Note: Above idea is for educational purpose only. It is advised to diversify and strictly follow the stop loss, and don't get stuck with trade

DODO formed huge bullish butterfly for upto 1408% big pumpHi dear friends, hope you are well, and welcome to the new update on DODO token.
On a weekly time frame chart, DODO has formed a big bullish Butterfly pattern. There is also strong support at $0.12.
Note: Above idea is for educational purpose only. It is advised to diversify and strictly follow the stop loss, and don't get stuck with trade

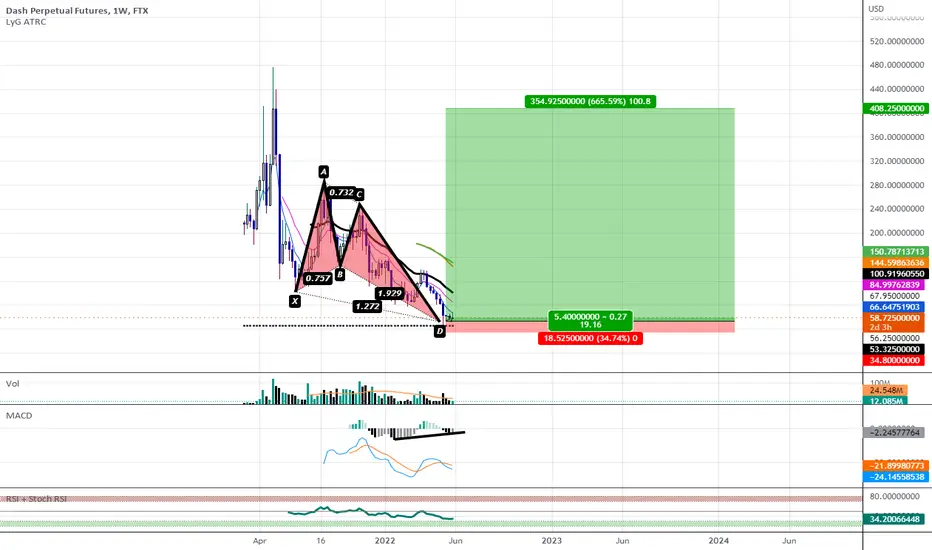
Bullish Butterfly with Bullish Divergence on WeeklyWe Have Weekly MACD Bullish Divergence Visible at the PCZ of a Bullish Butterfly on DASH
GOLD_XAUUSD_H1 Bearsih Butterfly Formation & H1,H4 Supply ZoneGOLD_XAUUSD_H1 Bearsih Butterfly Formation & H1,H4 Supply Zone Possible Bearish Reversal. if you like my idea follow me for next update and share your opinion in comments. Thank You

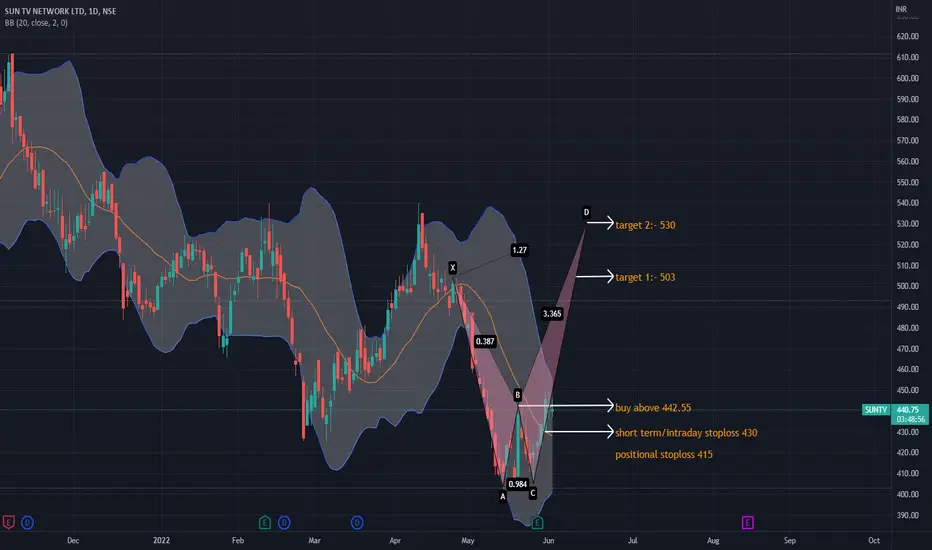
SUNTVSuntv made harmonic pattern on daily charts with okayish volumes.
Could be bought with mentioned stoploss & targets.
Thoughts on USDCADHello again! Here we go with USDCAD. First of all if we look at a major time frame, we can see a Butterfly pattern. Now this is not as strong as other butterfly pattern, so I based the entry point with the break of the bearish channel right before it started to react. I'm expecting a bullish movement here and I think the price is just gonna move a bit upwards and it is coherent with both patterns. If it breaks the SL, then it surely will not go up. Operate with lower risk as we have strong news this week.

2022-2023 LONG TRX $1 incomingNobody talks about TRX but this is a gem without a doubt, I can see this do massive numbers, I can see this run all the way to $0.71 cents to $1.00. Also detected a butterfly on the monthly so this could be the beginning.

USOIL_D1 Bearish Butterfly Formation, Market will be DownUSOIL_D1 Bearish Butterfly Formation, Market will be Bearsih Revesal under 120 you can use sl 121.45, let see market condition, if you like my idea follow me and share your opinion... Thank You

BTC bearish butterfly 1H target $30,824BTC is in process of developing a bearish 🦋 harmonic, It will complete at $30,824. Invalidation of this will be if price goes below $28K level. We have strong resistance levels at $30,500 and $31,500 so chances of this harmonic playing out upon completion are very high.

EURUSD-Weekly Market Analysis-Jun22,Wk1If you have been following my analysis, you would have known that it is unusual for me to share a Weekly Market Analysis on a 15minutes chart.
A Bearish Butterfly Pattern complete at 1.0788 for a shorting opportunity. If this became a valid setup, I could upsize my trading profit to the 4-hourly chart level. Link at the bottom.
That's how Winner trade ;P

💎Resurrection of Risk 👑 Join the MC House of LV🕊️Old Money Never
Goes Out Of
Style
www.lvmh.com
LVMH is home to 75 distinguished
Houses rooted in six different sectors
True to tradition, each of our
Brands builds on a specialty legacy
While keeping an unwavering focus on
The exquisite caliber of its products.
In The Words
Of
Chairman Bernard Arnault
"Our objective to strive for solid financial performance and our relentless drive for excellence remind us of our daily commitment to act in such a way as to make the world a better place.
The Group and its Maisons carried out numerous actions in 2021 to promote biodiversity, protect nature and to preserve skills and craftsmanship, and will continue to do so in the years to come."
www.lvmh.com
EURONEXT:MC
MIL:LVMH
🎇

Butterfly on BTCBeen on vacation for a while and finally back to the chart. What you see here is a potential butterfly on BTC.
Trade should be taken between 34.5k - 35k.
Confluence for this trade:
- 3 Fibonacci Gan Fan.
- Golden pocket.
- Butterfly Harmonic with a 1.27 fib level.
- Monthly level
- Naked POC.
- Elliot wave 4 count
There are probably way more confluence why the price is likekly to fall on this price.
Stoploss above invalidation (35k).
TP levels: 30k, 27k 25k and 20k.

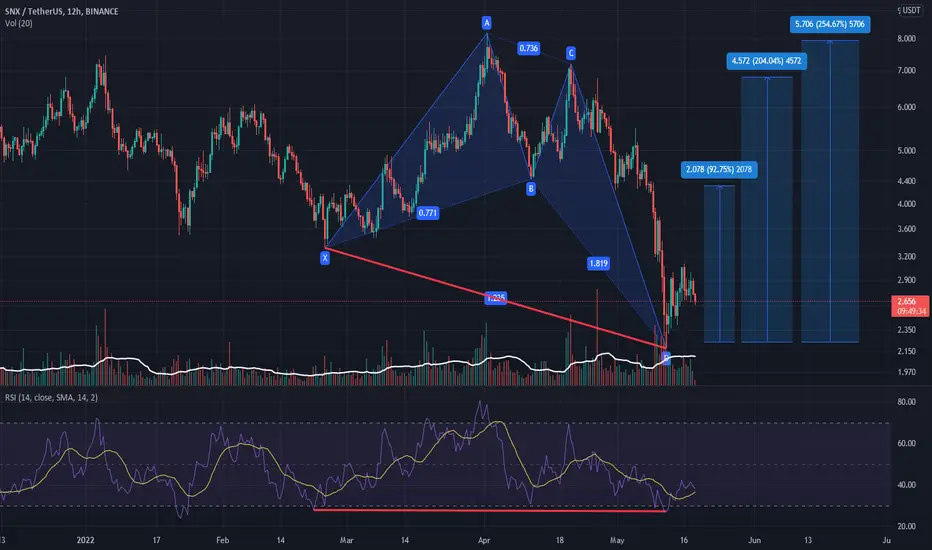
SNX/USDT-12H-BINANCE(Bullish Butterfly)This is not a financial advice. Always do your own research and always put stoploss in your trade (SL) :) If you want more detailed info
how to study and read charts or just need help with some coin, just write to me here a comment, i will try to answer to everybody...
i can help you :) all for free, don't worry, BE HAPPY!
Potential Head and Shoulders Forming at PCZ of Bearish ButterflyWe made a high and a higher high then formed bearish divergence and are now potentially making a new lower high at what is the PCZ of a very promising Bearish Butterfly

Long GALAA good opportinity to take a position on gala.
ENTRY: 0.08-0.1
TP1: 0.15
TP2: 0.2
TP3: 0.3
SL: 0.014
ONLY SPOT

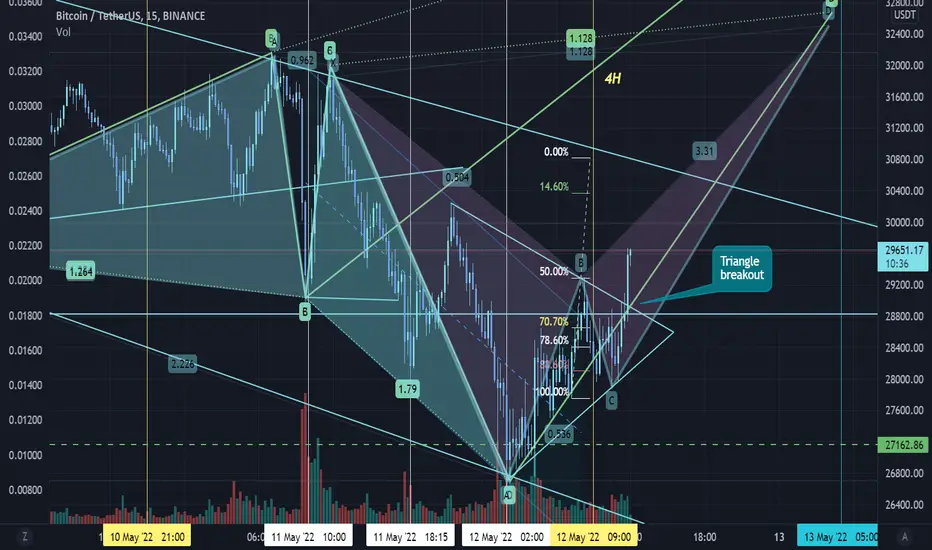
BTCUSDT Butterfly Gartley AB=CDTriangle breakout. Corrective uptrend. I'm expecting at least 3 days in an uptrend of the macro correction. Based on Elliot the price action is in a wave 4 zigzag correction. targets predicting daytrade at least 32.6k. Symmetrical triangle and Fibonacci confluences. Beautifully bullish.
Thoughts on CADJPY (Bearish positions)Meanwhile we wait for the big bat pattern to materialize, at this moment there's a butterfly pattern on a small time frame, because of it we know the market is behaviouring bearish. So we could look for bearish positions. Target would be the possible entry for our bat pattern.
Do you have any other ideas? let me know on the comments.
