Butterfly

As expected YBSHarmonic Butterfly Pattern matched
TP1 at 127% after BO from point B.
#scalping
#Momentum MYX:YBS

Bullish Butterfly Bullish butterfly pattern with AB=CD appearing on a 15 minute chart of EURUSD.
Prices printing higher lows with the oscillator showing lower lows, indicating bullish hidden divergences.
This trade was shared in the chat earlier today
Good luck to all traders and gamblers alike anticipating price movements on this pair!

$FDX// Butterfly{s) // $RLMD Butterfly w daily engulfing candle, 290 can trade, 2% risk max to account.
$RLMD as well both of combo scan from tc 2k, via Pradeep Bonde/ @Stockbee Best in business, hands down imo

AUDUSD > A Possible Bullish Harmonic Butterfly Pattern!!Friends I am overwhelmed by your generosity, thanks for the likes and comments, thank you for being so giving and kind, not many people have the virtue of generosity.
Analysis on #AUDUSD
A Possible bullish harmonic butterfly pattern might complete soon near the structure support level where I will be looking for a buy if the price action is favorable and meets my rules
Check today analysis below⠀
>>“ Only trade when the probabilities of the market going in your favor are greater than it going against you." TradingAxis

AUD/USD BUY VIEW.......
💹AUD/USD ⏬BUY STOP @ 0.73903
✅TP # 0.74233
⛔️SL 0.73615
📊 Trade Accuracy 70% 📊
📊 Follow Proper M.M & Use S.L 📊
AronnoFX will not accept any liability for loss or damage as a result of
reliance on the information contained within this channel including
data, quotes, charts and buy/sell signals
If you like this idea, do not forget to support with a like and follow.
Traders, if you like this idea or have your own opinion about it,
write in the comments. I will be glad

GOLD POSSIBLE POTENTIAL 1795-1828 *HARMONIC PATTERN*I predicted the possible upward in gold, It can rise to 1795-1828
If it rises to 1773 then rebound it should go up to 1796 *Bearish Bat*
If 1784 then rebound it will go to 1828 *Bearish Crab*
If 1791 then rebound it will go to 1811 *Bearish Butterfly*
IF BREAK BELOW 1759 THIS PREDICTION WILL BE *FIELDED*

Butterfly $RPRX Nice engulfing candle (5.6 mill share daily candle) in trigger zone on $RPRX, worth watching this one, good growth numbers as well, aim tp 1 (scope symbol) and get stop to break even and book 1/2 profit. I will update.
app.koyfin.com
**off 4% breakout scan (did 5.61% Friday)

lunausdt I opened a position on lunausdt.. I expect it to throw back after a nice butterfly formation and then go to the target.. ascending triangle is one of my favorite formations. I recommend you to rate it.. Please support my page and keep following me if you motivate me.. good luck guys

Bat Or Butterfly? Will it go 1800??I use simple analysis Harmonics.
bot D of Bat and Butterfly is near each other.
will it react there??
I will entry when there is My 3 Hit Myth happened there.

AMC - Bullish Butterfly - Swing Trade + 3 TargetsThe Butterfly is one of my favorite Harmonic Patterns for a nice long position. Low Risk with potential High Reward! =)
I don't think the Fundamentals are going to hold it down this season.
Low Risk Entry: < $35
Targets : 15% 30% 50%
Stop Loss: 5%
MEME Stock
Going to accept Bitcoin
Class A Bullish Divergence on the Daily time frame

inspire medicalTwo case scenario we a looking here.
1:Bearish falling window 67% continuation 208.52. stop 160
2:Pivot point reversal downtrend. target up 223.43 down target 171.29


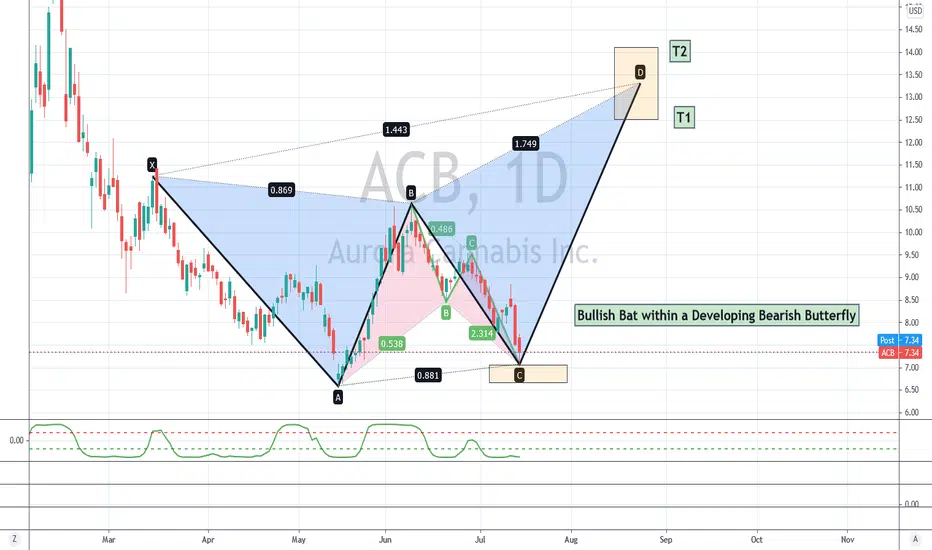
Aurora Cannibis Inc.(ACB) From Low to new recent High ??Combination of a Bat Pattern and Developing Bearish Butterfly Pattern plus nearing
a short term double bottom could give ACB a lift.
Watch for a reversal into the lower colored box.
As always do your own Due diligence
and be mindful of the general market direction
S.

Potential Emerging Butterfly Potential emerging butterfly pattern appearing on the weekly charts of gold.
Good luck to everyone trading gold!
