GBP/USD: Sell setup shaping upHey everyone, what’s your take on GBP/USD right now?
After breaking below the trendline, GBP/USD tried to retest the area but failed to hold. Price is now hovering around 1.329, and the selling pressure is still clearly present.
This current setup is aiming toward the Fibonacci 1.618 extension zone around 1.287. In the short term, a pullback could play out based on Dow Theory, and the highlighted zone might offer a prime shorting opportunity.
My bias: SELL on the retest — with tight risk management, clear TP and SL in place.
Now it’s your turn — what’s your outlook? Drop your thoughts in the comments below.
Good luck and trade smart! 💼📉
Buy

BTC recovery within the downtrend – watch for sell signalsHello friends,
Today, BTCUSD is showing a slight bearish bias, currently hovering around $115,000.
On the macro front, global financial markets are still digesting expectations that the Fed could cut interest rates in September, with current odds close to 90%, according to the CME FedWatch Tool. The main driver? Last week’s disappointing Non-Farm Payroll (NFP) report, which slightly weakened the US dollar and gave Bitcoin some short-term relief.
However, BTC is still not out of the woods. Institutional investors remain cautious, awaiting clearer signals from the Fed. If the US stock market pulls back, Bitcoin could follow suit as part of a short-term profit-taking wave.
From a technical point of view, BTCUSD is still respecting a well-defined descending channel on the H4 timeframe. Price is approaching a strong confluence resistance zone around $115,800 (Entry Sell 1), aligned with both EMA and trendline. The next key level to watch is $118,000 (Entry Sell 2) – a zone that may trigger a false breakout before sellers step back in.
Looking ahead, the plan is to sell if the price shows rejection signs near 115,800 or 118,000. Place your SL just above resistance, and TP targets at 112,000, with an extended target near the $110,000 channel bottom.
So, what’s your take – will BTC break the downtrend channel or drop further?
Drop your thoughts in the comments below!

Gold Surges on Weak NFP Hello everyone, what’s your take on XAUUSD?
Gold prices soared at the end of the last session and are now trading around $3,380. This sharp rise followed a weaker-than-expected U.S. Non-Farm Payrolls (NFP) report, which shifted market sentiment toward expectations that the Fed may delay interest rate cuts. As a result, the U.S. dollar weakened and demand for gold as a safe haven surged.
Technically, gold appears to be forming a cup and handle pattern, with the first resistance target at $3,400, followed by $3,435.
What do you think? Could this rally continue? Let us know in the comments!

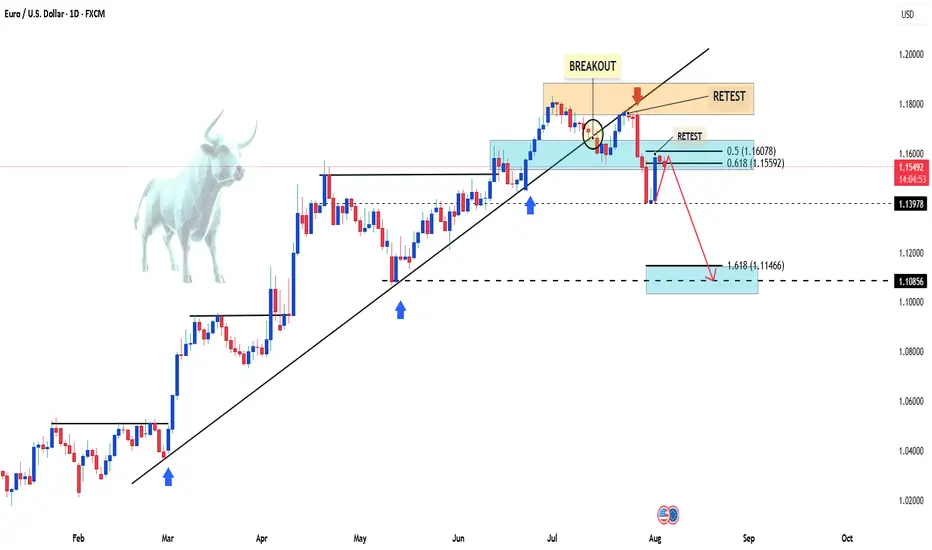
EURUSD Faces Renewed Selling PressureHello, what are your thoughts on EURUSD?
After failing to break above the 1.1600 level, the EUR/USD pair is now facing strong selling pressure again, currently testing the mid-1.1500s on Monday. Meanwhile, the US Dollar has seen a modest rebound across the board as investors digest Friday’s sharp drop following weaker-than-expected US jobs data.
From a technical standpoint, this setup may lead EURUSD to even lower levels. The recent movement aligns well with our previous outlook and follows the Dow Theory principles.
I'm expecting the price to continue its correction—what about you?
EURUSD – Which Way Will It Break?Hello everyone, what are your thoughts on the EURUSD trend?
EURUSD is currently experiencing a Bollinger Bands squeeze, signaling a potential breakout in either direction. The price is trading near the lower limit, hovering around 1.157 , with two potential scenarios unfolding:
Bullish scenario: The price could break upward toward 1.172, testing the upper resistance zone.
Bearish scenario: If the price falls below the lower limit, it could head towards the sell target at 1.140.
💬 For me, I’m leaning toward FOMO (Fear of Missing Out) and following the sell trend with a target of 1.140. What about you? Let me know your thoughts in the comments below!

GBPUSD – Trendline Broken, More Downside Ahead?Hello traders! What’s your take on GBPUSD?
The GBP/USD pair has broken below its long-term ascending trendline and is now trading beneath a key resistance zone. After a failed breakout at the newly formed trendline, price quickly reversed and dropped sharply.
This resistance zone previously acted as a strong support level but has now been flipped to resistance. If price fails to reclaim this area during the next pullback, the bearish outlook will be further confirmed.
💬 Do you think GBPUSD will bounce from the 1.32 region, or will it continue falling toward the lower targets? Share your thoughts below!

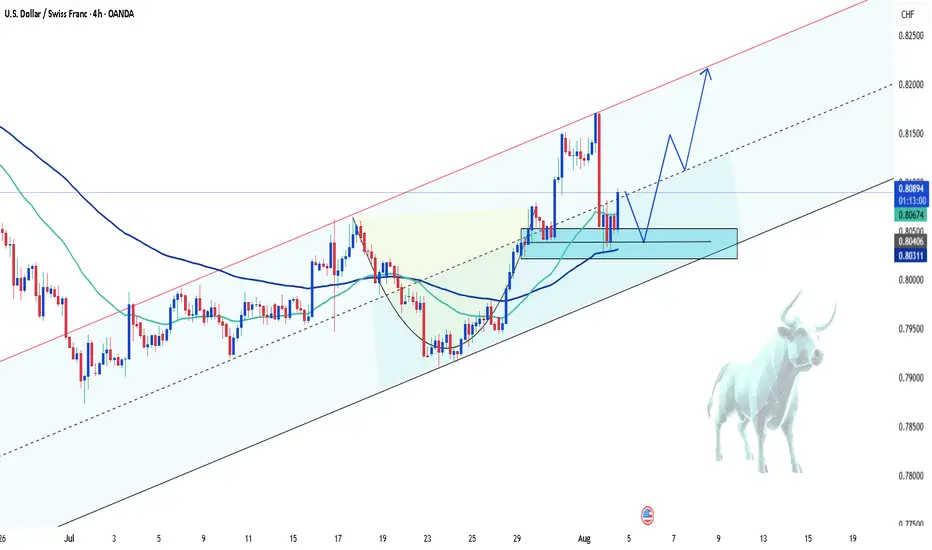
USDCHF – Bullish comeback in progress?Hey everyone! What’s your take on the current trend of USDCHF?
While the pair experienced a recent dip, take a step back and look at the bigger picture — doesn’t it still seem to be moving within an ascending channel?
Right now, USDCHF is hovering around 0.8092 and starting to bounce back. The recovery appears to be supported by a newly formed support zone and the confluence of the EMA 34 and 89. The pair seems to be eyeing the recent high, with potential to climb further toward the upper boundary of the channel.
My current bias? Bullish.
What about you — do you see the same opportunity?
Drop a comment and hit like if you’re on the same page!
Gold's Bullish Momentum: Heading Towards Historic Highs?Hey everyone, it's Alex here!
Yesterday, XAUUSD continued its upward trend and is now trading around 3.375 USD.
The price increase of gold is mainly driven by the bargain-hunting sentiment from speculators. After a slight drop in gold prices in the morning, buy orders were quickly triggered, taking advantage of the lower prices. Coupled with the weakening USD, this opened the door for a strong buying pressure on gold.
From a technical perspective, the current trend shows the beginning of a new bullish wave within a clearly defined uptrend channel. Notably, the EMA 34 and EMA 89 are converging closely, along with the breakout of previous resistance, which further increases the likelihood of the ongoing bullish momentum.
Regarding the outlook, I prefer buying in line with the prevailing trend. As long as the price holds above the newly established support (confirmed by previous resistance), the next target will be the upper boundary of the price channel, around 3,435 USD.
This is a key level that will determine whether the upward trend continues or if the market will experience a correction. It all depends on how the market reacts at that moment.
What do you think about the current gold trend? Feel free to share your thoughts in the comments!

AUD/USD Long Trade Setup – Buying at the Channel LowOANDA:AUDUSD
🔍 Technical Overview:
The pair is trading within a well-defined ascending channel.
A potential bullish reversal is forming at the confluence of:
Channel support
Local structural support (highlighted in orange circle)
Bullish wick rejections and slowing downside momentum
📈 Trade Idea: BUY AUD/USD
Entry: Market buy or buy near 0.6450 – 0.6465
Stop-Loss: Below the swing low and channel support at 0.64160
Target 1: 0.65150
Target 2: 0.6566
Target 3: 0.66160
Risk-to-Reward: ~1:3 R:R ratio
Monitor price action near mid-channel resistance
🧠 “If the structure speaks to you, let it echo.” – Let the price action confirm your bias before committing fully.
Previous Sell Setup at the top of channel:
Psychology Always Matters:

Gold Set to Reach Historic HighsHello everyone, great to see you again!
Gold has been on a strong upward trajectory, breaking previous bearish structures and showing solid growth momentum. Market sentiment is heavily supported by the weakening of global currencies, particularly the US dollar, and expectations surrounding the potential interest rate cuts by the Federal Reserve.
Looking at the technical picture, we are approaching the historic peak of $3,433. The gold market is showing significant strength, confirmed by EMA 34 and EMA 89, as well as new support zones, signaling a trend reversal and confirming the bullish outlook.
The next few trading sessions could play a critical role in confirming whether the precious metal can break the all-time highs.
What do you think? Is gold about to make history? Let me know in the comments below!

USDJPY Bullish Momentum Continues ? Hello traders, what do you think about USDJPY?
As of now, USDJPY is showing a slight upward movement after the recent correction. The price is trading around 147.59, not changing much since the beginning of the session.
The Japanese yen remains under pressure due to Japan’s slow recovery and ongoing economic challenges, giving USD an edge to capitalize on recent gains.
From a technical standpoint, USDJPY is moving in an ascending wedge pattern. After testing the trendline support near 147, the pair could be headed toward the psychological target of 150, or even higher towards the upper trendline boundary in the coming days.
Keep an eye on the price action near key resistance levels as the market continues to evaluate global economic factors, especially the upcoming US jobs data and Fed policy outlook.
What’s your take on USDJPY? Do you expect this pair to rise further? Let me know in the comments below!

AUDUSD Is Bullish! Long!
Here is our detailed technical review for AUDUSD.
Time Frame: 1h
Current Trend: Bullish
Sentiment: Oversold (based on 7-period RSI)
Forecast: Bullish
The market is on a crucial zone of demand 0.646.
The oversold market condition in a combination with key structure gives us a relatively strong bullish signal with goal 0.647 level.
P.S
We determine oversold/overbought condition with RSI indicator.
When it drops below 30 - the market is considered to be oversold.
When it bounces above 70 - the market is considered to be overbought.
Disclosure: I am part of Trade Nation's Influencer program and receive a monthly fee for using their TradingView charts in my analysis.
Like and subscribe and comment my ideas if you enjoy them!

Gold - M30 Buy SetupOANDA:XAUUSD TVC:GOLD
Timeframe: m30
Risk Level: Low-Medium
🔹 Setup:
Price is testing the boundary of the ascending channel and retesting the support @ 3350
📈 Entry:
Current price zone: 3360-65
🎯 Targets (TP):
TP1: 3375
TP2: 3385
TP4: 3410
TP6: 3430
⛔ Stop Loss (SL):
3349
H4 Overview:
PEPPERSTONE:XAUUSD
#XAUUSD #GOLD #Buy #Signal #MJTrading
Psychology Always Matters:

USOIL BULLISH BIAS RIGHT NOW| LONG
USOIL SIGNAL
Trade Direction: long
Entry Level: 66.22
Target Level: 69.94
Stop Loss: 63.73
RISK PROFILE
Risk level: medium
Suggested risk: 1%
Timeframe: 9h
Disclosure: I am part of Trade Nation's Influencer program and receive a monthly fee for using their TradingView charts in my analysis.
✅LIKE AND COMMENT MY IDEAS✅

Gold’s heating up – Riding the wave or waiting for the dip?Hey everyone! So, what’s your take on XAUUSD right now?
Gold’s been on a tear lately – yesterday it kept pushing higher and is now chilling around $3,376.
The move’s mostly driven by hopes that the Fed might ease up soon, especially with recent U.S. data showing signs of slowing down.
From a chart perspective, it’s looking like we might be at the beginning of a fresh bullish wave. There’s a nice bullish confluence happening at the EMA 34 and 89, plus we’ve broken above previous resistance – both giving that upward momentum some real backing.
If price pulls back before another push, I’m keeping my eyes on the Fibo 0.5–0.618 zone. That area also lines up with the EMAs and old resistance, so it could be a sweet spot for a buy setup if things line up right.
Personally, I’m leaning bullish today.

SOLUSDT 1D - Bulls back in control with Golden Cross and channelOn the daily chart, SOLUSDT is forming a bullish continuation structure. After the Golden Cross (MA50 crossing MA200), the price is now pulling back toward the midline of the ascending channel and the 0.5 Fibonacci level at 166.38. This confluence with the broken trendline and 200 EMA makes this zone a prime technical area of interest.
Support: 166.38 (0.5 Fibo), EMA200 (161.77), broken trendline
Resistance: 182.84–189.67 (Fibo 0.705–0.79), 206.54, target - 255.93 (Fibo 1.618)
This retracement looks healthy, supported by higher volume during the prior bullish leg. As long as the 166.38–161.77 zone holds, continuation toward 206.54 and potentially 255.93 is on the table.
Fundamentally, Solana remains a key L1 narrative with strong traction in DePIN and AI-linked dApps. The rising TVL and investor sentiment support the trend.
Watch price action around 166 for confirmation - this is the battleground.

GOLD Will Go Up! Buy!
Take a look at our analysis for GOLD.
Time Frame: 2h
Current Trend: Bullish
Sentiment: Oversold (based on 7-period RSI)
Forecast: Bullish
The market is approaching a key horizontal level 3,372.49.
Considering the today's price action, probabilities will be high to see a movement to 3,395.61.
P.S
Please, note that an oversold/overbought condition can last for a long time, and therefore being oversold/overbought doesn't mean a price rally will come soon, or at all.
Disclosure: I am part of Trade Nation's Influencer program and receive a monthly fee for using their TradingView charts in my analysis.
Like and subscribe and comment my ideas if you enjoy them!

XAUUSD breaks out – bullish bias returnsGold has bounced from the bottom of the descending channel, initiating a clear upward move with a series of strong bullish candles. On the H2 chart, price has broken above the upper boundary of the medium-term downtrend channel and filled the nearest fair value gap, signaling a resurgence in buying pressure.
Current price action is approaching a previous resistance zone, aligned with recent swing highs. The chart suggests a potential consolidation before further upside, provided that the current bullish structure remains intact.
From a macro perspective, while the stronger-than-expected U.S. PMI data supports the USD in the short term, weak labor market figures and ongoing global geopolitical tensions continue to fuel demand for gold as a safe-haven asset. This environment is helping sustain XAUUSD’s current recovery structure.

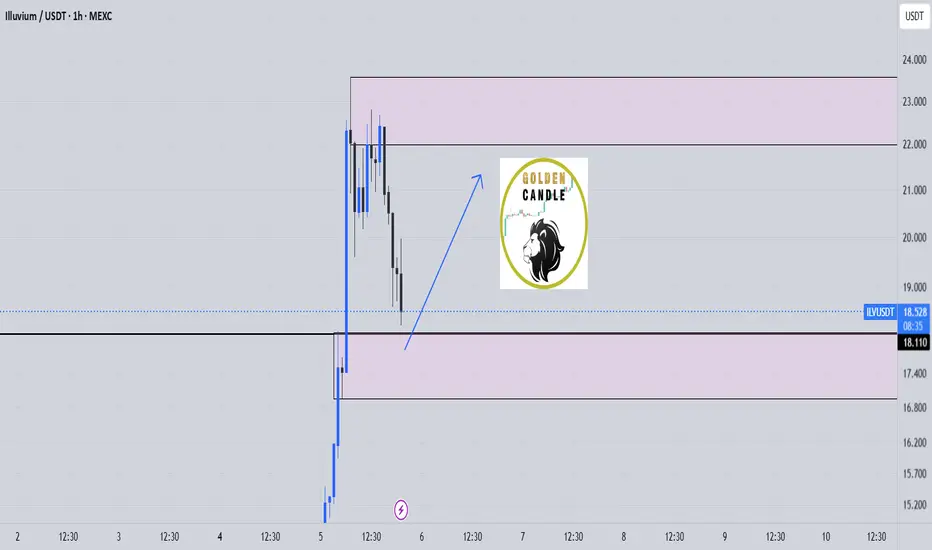
ilv buy midterm"🌟 Welcome to Golden Candle! 🌟
We're a team of 📈 passionate traders 📉 who love sharing our 🔍 technical analysis insights 🔎 with the TradingView community. 🌎
Our goal is to provide 💡 valuable perspectives 💡 on market trends and patterns, but 🚫 please note that our analyses are not intended as buy or sell recommendations. 🚫
Instead, they reflect our own 💭 personal attitudes and thoughts. 💭
Follow along and 📚 learn 📚 from our analyses! 📊💡"
CAD/JPY BULLS ARE STRONG HERE|LONG
Hello, Friends!
We are now examining the CAD/JPY pair and we can see that the pair is going down locally while also being in a downtrend on the 1W TF. But there is also a powerful signal from the BB lower band being nearby indicating that the pair is oversold so we can go long from the support line below and a target at 108.573 level.
Disclosure: I am part of Trade Nation's Influencer program and receive a monthly fee for using their TradingView charts in my analysis.
✅LIKE AND COMMENT MY IDEAS✅

EURUSD – price retest in motion, will the selloff resume?After a decisive break below key support, EURUSD is now retesting that zone in a classic break–retest setup. While familiar to many traders, this structure can be deceptive if the reaction is misread.
Currently, price action remains cautious. Buyers have pushed price back toward the former support – now acting as resistance – but we haven’t seen any strong bullish candle closes. If clear rejection signals emerge (such as a bearish engulfing candle or increasing downside momentum), EURUSD is likely to resume its decline toward TP1 at the Fibonacci extension near 1.1288, or even further down to TP2 at the 1.618 extension.
On the flip side, a convincing break and hold above 1.1580 would invalidate the short-term bearish outlook. That would signal a potential shift in market sentiment – and flexibility will be key.
I’m currently waiting for more confirmation.
What about you – how are you reading this reaction? Let me know your take in the comments!

GBPUSD Will Go Higher From Support! Long!
Take a look at our analysis for GBPUSD.
Time Frame: 1h
Current Trend: Bullish
Sentiment: Oversold (based on 7-period RSI)
Forecast: Bullish
The market is approaching a key horizontal level 1.328.
Considering the today's price action, probabilities will be high to see a movement to 1.336.
P.S
We determine oversold/overbought condition with RSI indicator.
When it drops below 30 - the market is considered to be oversold.
When it bounces above 70 - the market is considered to be overbought.
Disclosure: I am part of Trade Nation's Influencer program and receive a monthly fee for using their TradingView charts in my analysis.
Like and subscribe and comment my ideas if you enjoy them!

EUR/GBP BULLS ARE STRONG HERE|LONG
EUR/GBP SIGNAL
Trade Direction: long
Entry Level: 0.863
Target Level: 0.872
Stop Loss: 0.857
RISK PROFILE
Risk level: medium
Suggested risk: 1%
Timeframe: 9h
Disclosure: I am part of Trade Nation's Influencer program and receive a monthly fee for using their TradingView charts in my analysis.
✅LIKE AND COMMENT MY IDEAS✅
