BTCUSDT – Mild Pullback, Support Holds FirmBTCUSDT remains in a clear uptrend with a structure of higher highs and higher lows, after breaking out of a prolonged consolidation pattern since early May.
The price has surged from the 106,000 resistance zone and approached the technical target around 112,000 – an area that is currently triggering a slight pullback.
At the moment, the support zone around 106,700–107,800 aligns with a demand area and the EMA34, likely serving as a springboard for the next upward move.
If BTC continues to consolidate around this zone without breaking below 106,700, the 112,000 level could be breached, paving the way for a move toward higher targets.
Buy!!

GBPUSD – False Breakout Alert at Channel TopOn the D1 timeframe, GBPUSD continues to maintain a clear bullish structure within an ascending price channel, with steadily rising highs and lows.
Currently, price is approaching the resistance zone near 1.35919 — which is the upper boundary of the channel and also a zone that previously saw strong reactions. As illustrated in the chart, a likely scenario is a false breakout above this zone, followed by a pullback towards the support area at 1.33270–1.32500 to retest the EMA34 region.
If this support holds, price could bounce back in line with the upward channel structure, opening the door to the next target zone.

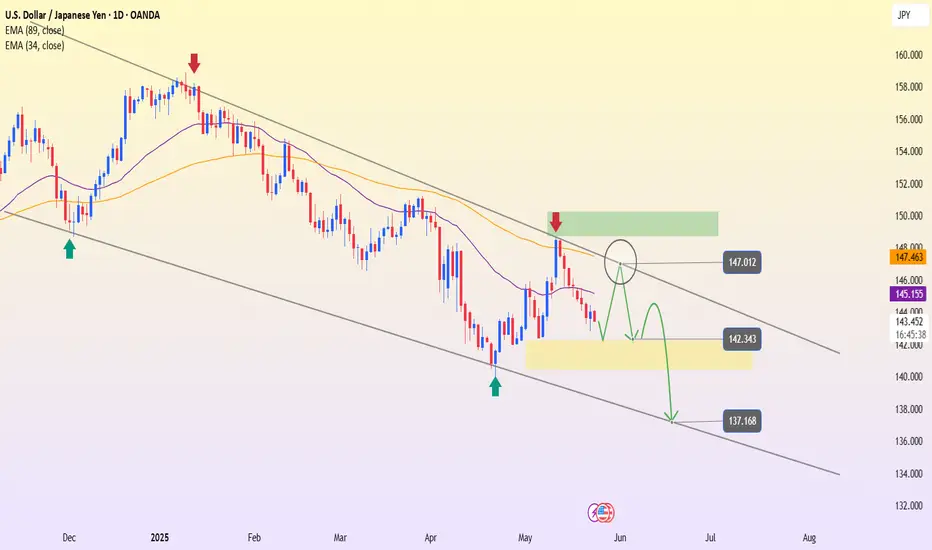
USDJPY – The downtrend continues, channel still leads the wayLooking at the D1 chart, USDJPY remains firmly within the descending channel that has persisted since the end of 2024. Every time the price approaches the upper boundary of the channel, selling pressure reappears – and the recent touch around the 147.012 area is no exception.
After being rejected at this strong resistance zone, the price has turned lower and is now forming a pullback structure within the prevailing trend. EMA34 and EMA89 continue to slope downward, reinforcing the bearish momentum.
If the price gets rejected again around the 145–146 region, the correction pattern may complete, opening up room for a drop toward the support zone at 142.343, or even deeper toward the channel bottom near 137.168.
In summary, the primary trend remains bearish – and the preferred strategy now is "sell on rally" when the price nears the upper resistance of the channel. Patience and watching for price action will be key.
EURUSD – Consolidation below trendline hints at breakout aheadHello traders! EURUSD is currently forming a rather interesting consolidation pattern right below the descending trendline – a level that has rejected price twice in the past.
After a mild pullback from the 1.1382 zone, price has quickly recovered and is now hovering around the EMA34 and EMA89. This is an important confluence area and is acting as short-term support around 1.1263.
If EURUSD continues to hold above this support and forms sideways accumulation, the probability of a trendline breakout will increase. In that case, the next target will likely be the previous high at 1.1382.
U.S. bond yields are fluctuating sharply, and geopolitical tensions – such as trade uncertainty or regional instability – may serve as catalysts that support the euro.
Keep an eye on the breakout zone – if price breaks out decisively, it could be a strong confirmation of a new bullish trend!

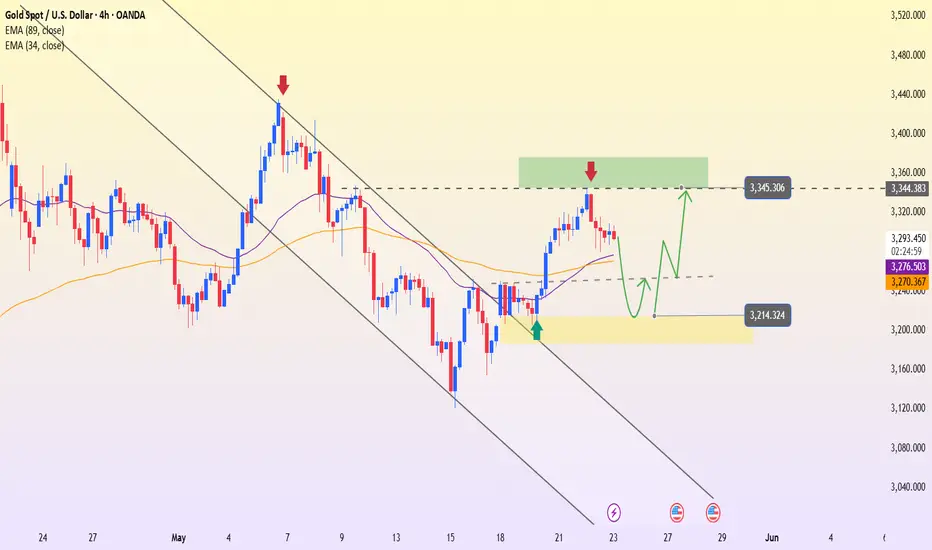
After a sudden drop, is gold "loading up" for a breakout?Hey everyone! At the start of today’s Asian session, gold is moving sideways around the $3,300 level, following yesterday’s sharp swing. Looking back, the price had climbed for three consecutive sessions earlier this week, then suddenly spiked to a two-week high of $3,345 during the Asian session on Thursday—only to quickly drop and close near $3,294.
This sharp reversal reflects the ongoing tug-of-war between a strengthening US dollar, volatile US bond yields, and unstable geopolitical factors. However, on the 4H chart, the bullish structure still holds, with price currently retesting the support zone around the EMA34.
Key price scenarios to watch:
If the support area around $3,214 holds → gold could bounce back toward the $3,345 region.
On the other hand, if $3,214 breaks → the bullish scenario will be temporarily invalidated and gold might revisit a deeper accumulation zone.
Right now, watching the price reaction around yesterday’s low is crucial—this could be the key to catching the next wave.
BUY AUDUSDIn todays trading session we are monitoring AUDUSD for buying opportunities. Our entries are at 0.64236 and our targets are as high as 0.65611 all the way to 0.6600 (Yes you read that right!). Our current stops are at 0.63900. Use proper risk management.

SUI/USDT Potential UpsidesHey Traders, in today's trading session we are monitoring SUI/USDT for a buying opportunity around 3.85 zone, SUI/USDT is trading in an uptrend and currently is in a correction phase in which it is approaching the trend at 3.85 support and resistance area.
Trade safe, Joe.

ETH/USDT Potential UpsidesHey Traders. in today's trading session we are monitoring ETH/USDT for a buying opportunity around 2420 zone, Ethereum is trading in an uptrend and currently is in a correction phase in which it is approaching the trend at 2420 support and resistance area.
Trade safe, Joe.

DXY Is Going Up! Buy!
Here is our detailed technical review for DXY.
Time Frame: 9h
Current Trend: Bullish
Sentiment: Oversold (based on 7-period RSI)
Forecast: Bullish
The market is trading around a solid horizontal structure 99.729.
The above observations make me that the market will inevitably achieve 100.749 level.
P.S
Overbought describes a period of time where there has been a significant and consistent upward move in price over a period of time without much pullback.
Disclosure: I am part of Trade Nation's Influencer program and receive a monthly fee for using their TradingView charts in my analysis.
Like and subscribe and comment my ideas if you enjoy them!

USD/CAD BUYERS WILL DOMINATE THE MARKET|LONG
Hello, Friends!
We are targeting the 1.400 level area with our long trade on USD/CAD which is based on the fact that the pair is oversold on the BB band scale and is also approaching a support line below thus going us a good entry option.
Disclosure: I am part of Trade Nation's Influencer program and receive a monthly fee for using their TradingView charts in my analysis.
✅LIKE AND COMMENT MY IDEAS✅

XAUUSD – Testing resistance zone, will there be a breakout?Gold continues its impressive recovery on the 3H timeframe, after bouncing strongly from the support zone around $3,300. Currently, the market is approaching a key resistance area at $3,400 – a level that previously triggered strong selling pressure.
EMA34 and EMA89 have crossed upwards, indicating that short-term bullish momentum is gaining strength. However, since this is a former resistance zone, a pullback to the $3,300 area before continuing the upward move is entirely possible.
On the news front, rising jobless claims and weakening manufacturing PMI have lowered expectations for the strength of the USD. However, a slight uptick in the services PMI keeps market sentiment cautious – resulting in a tug-of-war, though still leaning in favor of the buyers.
What do you think? Will gold break out further or take a breather first?

BTCUSDT.P | 110kHello everyone, this is The Dark Analysis, let's have a look at BTCUSDT.P together.
I suggested you open a long position on BTCUSDT.P after 1m breakout.
you can see the result on the picture above.
NEW ENTRY
If you have missed this opportunity, you can open a buy position on BTC at this area:
5m-15m Order Block at 107428.7-106936.8
- SL :106887.8
- TP : Previous high
CONDITIONS
-The price most reach this zone with weak momentum.
-There must be a dogi or engulf candle after touching that very zone.
Don't be shy and feel free to tell me your ideas in comments.

Bitcoin Potential UpsidesHey Traders, in today's trading session we are monitoring BTC/USDT for a buying opportunity around 102,000 zone, Bitcoin is trading in an uptrend and currently is in a correction phase in which it is approaching the trend at 102,000 support and resistance area.
Trade safe, Joe.

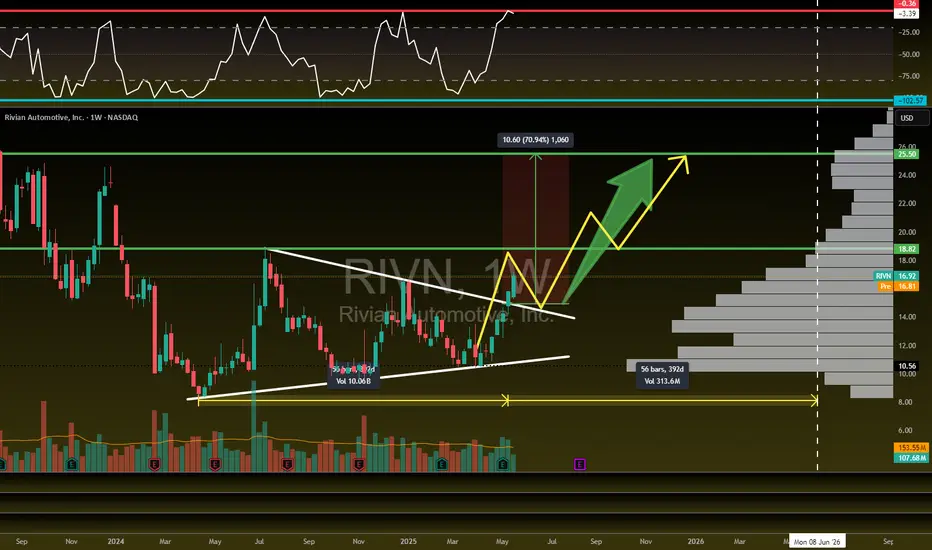
Rivian is flying! 71% UpsideNASDAQ:RIVN is flying! ✈️
Looking for a pullback to retest our breakout then move higher to our profit targets...Posted this setup last week in the community.
🎯$18.82📏$25.50
- Bullish H5_L Indicator
- Running into Red barrier (Need WCB to form)
- Volume shelf launch
SILVER Will Go Higher! Long!
Take a look at our analysis for SILVER.
Time Frame: 4h
Current Trend: Bullish
Sentiment: Oversold (based on 7-period RSI)
Forecast: Bullish
The market is on a crucial zone of demand 3,314.0.
The oversold market condition in a combination with key structure gives us a relatively strong bullish signal with goal 3,380.1 level.
P.S
Overbought describes a period of time where there has been a significant and consistent upward move in price over a period of time without much pullback.
Disclosure: I am part of Trade Nation's Influencer program and receive a monthly fee for using their TradingView charts in my analysis.
Like and subscribe and comment my ideas if you enjoy them!

GBPJPY Will Move Higher! Long!
Here is our detailed technical review for GBPJPY.
Time Frame: 1D
Current Trend: Bullish
Sentiment: Oversold (based on 7-period RSI)
Forecast: Bullish
The market is trading around a solid horizontal structure 192.740.
The above observations make me that the market will inevitably achieve 197.573 level.
P.S
The term oversold refers to a condition where an asset has traded lower in price and has the potential for a price bounce.
Overbought refers to market scenarios where the instrument is traded considerably higher than its fair value. Overvaluation is caused by market sentiments when there is positive news.
Disclosure: I am part of Trade Nation's Influencer program and receive a monthly fee for using their TradingView charts in my analysis.
Like and subscribe and comment my ideas if you enjoy them!

EURCAD Is Bullish! Long!
Please, check our technical outlook for EURCAD.
Time Frame: 4h
Current Trend: Bullish
Sentiment: Oversold (based on 7-period RSI)
Forecast: Bullish
The market is approaching a key horizontal level 1.556.
Considering the today's price action, probabilities will be high to see a movement to 1.566.
P.S
We determine oversold/overbought condition with RSI indicator.
When it drops below 30 - the market is considered to be oversold.
When it bounces above 70 - the market is considered to be overbought.
Disclosure: I am part of Trade Nation's Influencer program and receive a monthly fee for using their TradingView charts in my analysis.
Like and subscribe and comment my ideas if you enjoy them!

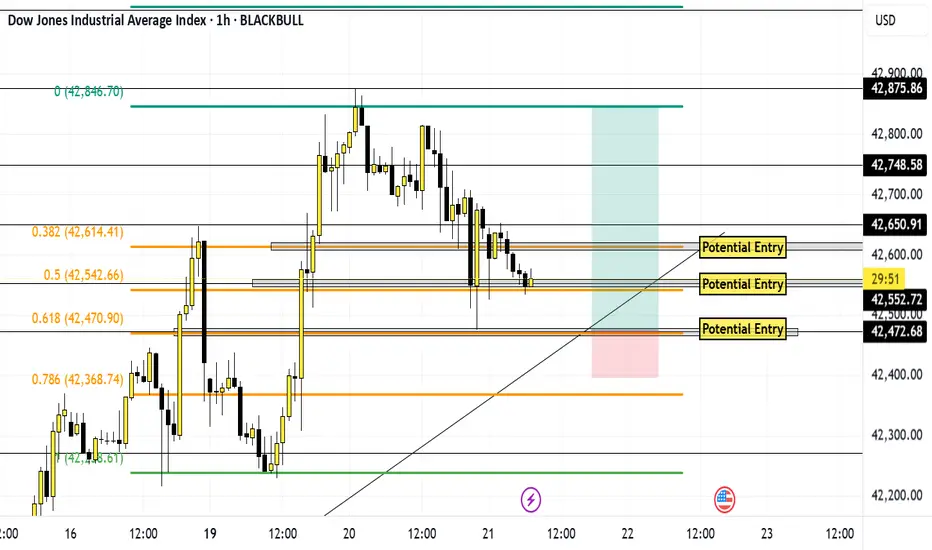
US30 May 21 If athletes get athlete's foot, what do elves get? Mistle-toes.
Now let's get to it. Before heading into the trade, I am definitely bullish. Price seems to be making a retracement before it pushes back up. I have given myself 3 potential entry points. But I am only going to enter them if:
Price makes market structure
Price breaks and retests through a key level/ entry point
If it bounces off of the trend line
Or a break of structure
And all of this, for me has to happen around 12pm est because I like to trade the afternoon session. But like a stallion price is going to do whatever it wants.
Stay safe and be patient
Amara Raja Energy & Mobility Limited Trend Reversal On ChartAmara Raja Energy & Mobility Limited, a flagship company of the group, is India’s largest manufacturer of automotive and industrial batteries. The company also produces Li-ion cells and battery packs for electric vehicles and the telecom industry.
At current price it looks very attractive for short term gains .
Short term target may show Up move to 1100 levels and initial support at 996
long term target intact 1700-1860 levels.

XAUUSD – Short-term bounce, major trendline still in play!Hey everyone, looking at the chart, we can see that gold is still moving within a larger uptrend. However, it's now testing a key resistance trendline that has repeatedly caused price to reverse in the past.
The recent bounce from the $3,170 zone looks strong on the surface, but in reality, it's just retesting the $3,400 resistance area – where selling pressure could reappear. Price behavior is also showing signs of losing steam as it approaches previous highs.
If the price fails to break through the upper trendline, a pullback to the $3,400 support zone is the first likely scenario. A deeper move toward the $3,170 area – which previously triggered strong buying – could also unfold.
Summary: Price is currently testing a strong resistance zone. If it fails to break above, the likelihood of a corrective reversal increases. Watch the trendline reaction closely and plan accordingly!

Based on macd and SMA ready to shortBased on macd and SMA ready to short first profit @204 soon. Simple moving average is ready and supportedby MACD also

Gold is Giving up Set ups this week! Lets get it!Nice run up yesterday. Looking for it to continue. Want to see a nice pull back to give us entry for it to continue. Its a waiting game to wait for the killzones for best entries!

doge buy midterm"🌟 Welcome to Golden Candle! 🌟
We're a team of 📈 passionate traders 📉 who love sharing our 🔍 technical analysis insights 🔎 with the TradingView community. 🌎
Our goal is to provide 💡 valuable perspectives 💡 on market trends and patterns, but 🚫 please note that our analyses are not intended as buy or sell recommendations. 🚫
Instead, they reflect our own 💭 personal attitudes and thoughts. 💭
Follow along and 📚 learn 📚 from our analyses! 📊💡"
