MRK Merck On the Verge of a Breakout? Unusual Calls !!Merck (MRK) is setting up for what could be a high-probability breakout. The stock has been in a falling wedge pattern for several months — a classic technical formation that often precedes sharp upside moves. Price action has now compressed to the end of the wedge, and we may be on the brink of a bullish resolution.
🔍 Technical Setup
Falling Wedge Pattern nearing completion
Price currently hovering near long-term support ($78.25)
Strong bullish divergence forming on momentum indicators (RSI/MACD)
The falling wedge is typically a reversal pattern, and given how deep MRK has pulled back from its highs ($134+), the risk/reward here looks compelling.
🔥 Options Flow
Today’s options market added fuel to the fire:
48,000 call contracts traded expiring this Friday
This sudden surge in short-dated call buying signals aggressive positioning for an imminent move
This kind of volume is not retail-driven — it points to potential institutional interest
💡 The Bullish Case
With the technical breakout structure in place and strong confirmation from options flow, the case for a bullish reversal is growing. If MRK can close above wedge resistance with volume, it opens the door to a quick move toward $85+, possibly even higher in the coming weeks.
Disclosure: I am part of Trade Nation's Influencer program and receive a monthly fee for using their TradingView charts in my analysis.
Buy!!

FCEL FuelCell Energy Options Ahead of EarningsAnalyzing the options chain and the chart patterns of FCEL FuelCell Energy prior to the earnings report this week,
I would consider purchasing the 5usd strike price Calls with
an expiration date of 2025-7-3,
for a premium of approximately $1.10.
If these options prove to be profitable prior to the earnings release, I would sell at least half of them.

PL Planet Labs PBC Options Ahead of EarningsAnalyzing the options chain and the chart patterns of PL Planet Labs PBC prior to the earnings report this week,
I would consider purchasing the 4usd strike price Calls with
an expiration date of 2025-6-20,
for a premium of approximately $0.37.
If these options prove to be profitable prior to the earnings release, I would sell at least half of them.

MDB MongoDB Options Ahead of EarningsIf you haven`t exited MDB before the selloff:
Now analyzing the options chain and the chart patterns of MDB MongoDB prior to the earnings report this week,
I would consider purchasing the180usd strike price Puts with
an expiration date of 2025-6-6,
for a premium of approximately $4.95.
If these options prove to be profitable prior to the earnings release, I would sell at least half of them.

DOCU DocuSign Options Ahead of EarningsIf you haven`t bought DOCU before the previous earnings:
Now analyzing the options chain and the chart patterns of DOCU DocuSign prior to the earnings report this week,
I would consider purchasing the 93usd strike price Calls with
an expiration date of 2025-6-6,
for a premium of approximately $4.80.
If these options prove to be profitable prior to the earnings release, I would sell at least half of them.
Disclosure: I am part of Trade Nation's Influencer program and receive a monthly fee for using their TradingView charts in my analysis.

IOT Samsara Options Ahead of EarningsIf you haven`t sold IOT before the previous earnings:
Now analyzing the options chain and the chart patterns of IOT Samsara prior to the earnings report this week,
I would consider purchasing the 44usd strike price Puts with
an expiration date of 2025-6-6,
for a premium of approximately $1.90.
If these options prove to be profitable prior to the earnings release, I would sell at least half of them.

CUP AND HANDLE $TSLA TO $515 MINIMUMThe cup and handle is a bullish chart pattern commonly used by traders to spot potential buying opportunities. It features a rounded "cup" formation followed by a slight downward drift forming the "handle." This pattern typically signals a continuation of an upward trend once the handle completes its consolidation phase.
ROBOTAXI BOOM
BUY NOW NASDAQ:TSLL NASDAQ:TSLA

BITCOIN Will Move Higher! Long!
Please, check our technical outlook for BITCOIN.
Time Frame: 1h
Current Trend: Bullish
Sentiment: Oversold (based on 7-period RSI)
Forecast: Bullish
The price is testing a key support 105,496.60.
Current market trend & oversold RSI makes me think that buyers will push the price. I will anticipate a bullish movement at least to 106,868.68 level.
P.S
The term oversold refers to a condition where an asset has traded lower in price and has the potential for a price bounce.
Overbought refers to market scenarios where the instrument is traded considerably higher than its fair value. Overvaluation is caused by market sentiments when there is positive news.
Disclosure: I am part of Trade Nation's Influencer program and receive a monthly fee for using their TradingView charts in my analysis.
Like and subscribe and comment my ideas if you enjoy them!

EURGBP Is Very Bullish! Buy!
Take a look at our analysis for EURGBP.
Time Frame: 1D
Current Trend: Bullish
Sentiment: Oversold (based on 7-period RSI)
Forecast: Bullish
The market is testing a major horizontal structure 0.841.
Taking into consideration the structure & trend analysis, I believe that the market will reach 0.852 level soon.
P.S
Overbought describes a period of time where there has been a significant and consistent upward move in price over a period of time without much pullback.
Disclosure: I am part of Trade Nation's Influencer program and receive a monthly fee for using their TradingView charts in my analysis.
Like and subscribe and comment my ideas if you enjoy them!

SILVER Will Go Up! Buy!
Take a look at our analysis for SILVER.
Time Frame: 10h
Current Trend: Bullish
Sentiment: Oversold (based on 7-period RSI)
Forecast: Bullish
The market is testing a major horizontal structure 3,324.9.
Taking into consideration the structure & trend analysis, I believe that the market will reach 3,432.4 level soon.
P.S
The term oversold refers to a condition where an asset has traded lower in price and has the potential for a price bounce.
Overbought refers to market scenarios where the instrument is traded considerably higher than its fair value. Overvaluation is caused by market sentiments when there is positive news.
Disclosure: I am part of Trade Nation's Influencer program and receive a monthly fee for using their TradingView charts in my analysis.
Like and subscribe and comment my ideas if you enjoy them!

AUDJPY Will Go Up From Support! Long!
Please, check our technical outlook for AUDJPY.
Time Frame: 4h
Current Trend: Bullish
Sentiment: Oversold (based on 7-period RSI)
Forecast: Bullish
The price is testing a key support 92.389.
Current market trend & oversold RSI makes me think that buyers will push the price. I will anticipate a bullish movement at least to 92.931 level.
P.S
Overbought describes a period of time where there has been a significant and consistent upward move in price over a period of time without much pullback.
Disclosure: I am part of Trade Nation's Influencer program and receive a monthly fee for using their TradingView charts in my analysis.
Like and subscribe and comment my ideas if you enjoy them!

USDJPY Will Go Higher From Support! Buy!
Take a look at our analysis for USDJPY.
Time Frame: 2h
Current Trend: Bullish
Sentiment: Oversold (based on 7-period RSI)
Forecast: Bullish
The market is on a crucial zone of demand 143.192.
The oversold market condition in a combination with key structure gives us a relatively strong bullish signal with goal 144.216 level.
P.S
We determine oversold/overbought condition with RSI indicator.
When it drops below 30 - the market is considered to be oversold.
When it bounces above 70 - the market is considered to be overbought.
Disclosure: I am part of Trade Nation's Influencer program and receive a monthly fee for using their TradingView charts in my analysis.
Like and subscribe and comment my ideas if you enjoy them!

AVGO Broadcom Options Ahead of EarningsIf you haven`t bought AVGO before the rally:
Now analyzing the options chain and the chart patterns of AVGO Broadcom prior to the earnings report this week,
I would consider purchasing the 250usd strike price Calls with
an expiration date of 2025-6-13,
for a premium of approximately $14.75.
If these options prove to be profitable prior to the earnings release, I would sell at least half of them.
Disclosure: I am part of Trade Nation's Influencer program and receive a monthly fee for using their TradingView charts in my analysis.

GOLD Will Grow! Long!
Here is our detailed technical review for GOLD.
Time Frame: 45m
Current Trend: Bullish
Sentiment: Oversold (based on 7-period RSI)
Forecast: Bullish
The market is approaching a significant support area 3,357.59.
The underlined horizontal cluster clearly indicates a highly probable bullish movement with target 3,378.12 level.
P.S
The term oversold refers to a condition where an asset has traded lower in price and has the potential for a price bounce.
Overbought refers to market scenarios where the instrument is traded considerably higher than its fair value. Overvaluation is caused by market sentiments when there is positive news.
Disclosure: I am part of Trade Nation's Influencer program and receive a monthly fee for using their TradingView charts in my analysis.
Like and subscribe and comment my ideas if you enjoy them!

AUD/NZD SENDS CLEAR BULLISH SIGNALS|LONG
Hello, Friends!
AUD/NZD pair is trading in a local downtrend which we know by looking at the previous 1W candle which is red. On the 1D timeframe the pair is going down too. The pair is oversold because the price is close to the lower band of the BB indicator. So we are looking to buy the pair with the lower BB line acting as support. The next target is 1.089 area.
Disclosure: I am part of Trade Nation's Influencer program and receive a monthly fee for using their TradingView charts in my analysis.
✅LIKE AND COMMENT MY IDEAS✅

$ASTS Trade Alert Setup - 26% Upside🚨 NASDAQ:ASTS Trade Alert Setup 🚨
Falling Wedge Breakout at $24.37 =
🎯 $29.07 📏 $30.77
Trading Plan: July 11th $26 Calls on Breakout or shares

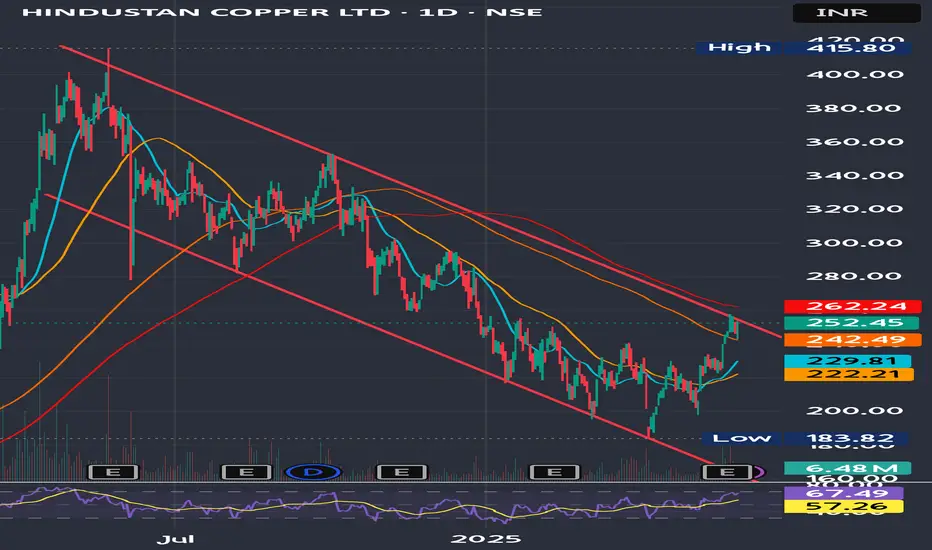
Hindcopper's Channel Breakout DueHindustan Copper Ltd. has recently garnered attention due to its strong financial performance and positive market sentiment.
Stock has broken out above key resistance around ₹240–₹245 with volume support.
Trend: Bullish
Indicators:
RSI ~67 (strong momentum)
MACD positive crossover
Above 50- & 200-DMA
Target Levels (Upside Potential)
Target Level Reason
270 Minor resistance zone (prior supply area)
292–295 Near-term swing high (Feb 2024 levels)
320+ Medium-term breakout target if momentum sustains
Stoploss Levels
Stoploss Type Level
Reason
Tight Stoploss 240 Previous breakout zone
Moderate SL 225 Near 50-day moving average
Positional SL 216 Breakdown confirmation below trend support
Buy on dips strategy around 245 -250 levels
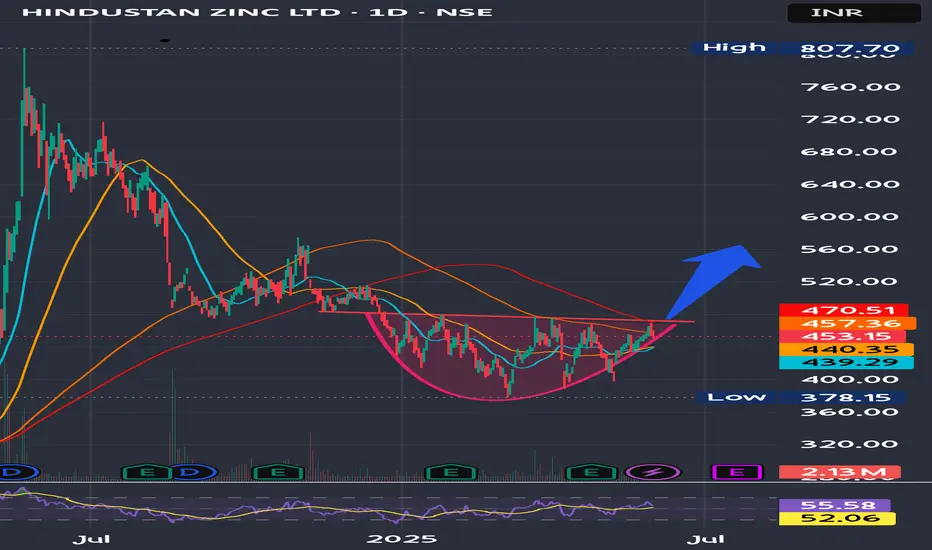
Hindustan Zinc Ltd at near breakout Hindustan Zinc Ltd. (Hindzinc) is one of the world's largest integrated producers of zinc, lead, and silver.
It is near a crucial resistance level and making higher lows indicating a breakout upwards soon.
Trading Levels-
Tgt Price-564
SL-448.5
EURUSD – The bearish threat is becoming increasingly clearRecently released PMI data shows that the U.S. manufacturing sector is rebounding. This dampens expectations of monetary easing from the Fed. With a stronger U.S. dollar and rising bond yields, USD-denominated assets like EURUSD are facing downward pressure.
On the daily chart, EURUSD is approaching the resistance zone at 1.16438 – an area that has rejected prices before. The recent rebound appears to be losing strength, and the ascending trendline is at risk of breaking.
If the price fails to hold above this trendline as illustrated, a breakout to the downside could drive the market toward the 1.10757 zone – which aligns with a previous strong support level.
In summary: be cautious of a potential trend break. If a pattern of lower highs continues, sellers may soon take control.

GBPJPY Is Very Bullish! Long!
Please, check our technical outlook for GBPJPY.
Time Frame: 7h
Current Trend: Bullish
Sentiment: Oversold (based on 7-period RSI)
Forecast: Bullish
The price is testing a key support 192.683.
Current market trend & oversold RSI makes me think that buyers will push the price. I will anticipate a bullish movement at least to 194.257 level.
P.S
We determine oversold/overbought condition with RSI indicator.
When it drops below 30 - the market is considered to be oversold.
When it bounces above 70 - the market is considered to be overbought.
Disclosure: I am part of Trade Nation's Influencer program and receive a monthly fee for using their TradingView charts in my analysis.
Like and subscribe and comment my ideas if you enjoy them!

Gold H2 Market Update Ongoing Accumulation BUY LOW SELL HIGH📊 Technical Outlook Update H4
🏆 Bull Market Overview
Gold is currently trading around $3,352.69 per ounce, up 1.9% today, reaching its highest level since May 23, driven by renewed safe-haven demand amid escalating U.S.-China trade tensions and a weaker dollar. The market remains range-bound, with key resistance levels at $3,410 and $3,460, and support levels at $3,160 and $3,240. Volatility is expected to remain moderate, with potential catalysts including upcoming U.S. employment data and central bank policy decisions.
⭐️ Recommended Strategy
Continue to buy on dips near support levels and sell near resistance levels, capitalizing on the current range-bound market conditions. Monitor for potential breakouts above resistance or breakdowns below support, which could signal a shift in market dynamics.
Latest Gold Market Updates:
📈 Gold prices have surged due to renewed tariff threats from the U.S. and escalating geopolitical tensions, prompting investors to seek safety in gold.
💰 Gold miners are largely avoiding hedging strategies to fully benefit from the current market, reflecting strong bullish sentiment in the industry.
🔮 Citibank projects gold prices could rally to $3,500 over the next three months, citing strong demand and macroeconomic factors.
📊 JP Morgan anticipates gold prices exceeding $4,000 per ounce by Q2 2026, with an average of $3,675 in Q4 2025, driven by continued investor and central bank demand.
⭐️ Goldman Sachs has raised its year-end 2025 forecast to $3,700, with a potential upside scenario reaching $4,500, based on strong Asian buying and central bank purchases.
💍 Record gold prices are prompting jewelry designers to shift toward 14-karat gold and alternative materials to control costs, while consumer demand remains robust.
🔮 Outlook Summary
Gold remains in a bullish trend, supported by safe-haven demand amid geopolitical tensions and economic uncertainties. The market is currently range-bound, with key levels to watch at $3,160–$3,240 for support and $3,410–$3,460 for resistance. Upcoming economic data releases and central bank policy decisions could act as catalysts for a breakout from the current range. Analysts maintain a positive outlook, with forecasts suggesting potential for further price increases in the medium to long term.

GBP/CAD BEST PLACE TO BUY FROM|LONG
Hello, Friends!
We are now examining the GBP/CAD pair and we can see that the pair is going down locally while also being in a downtrend on the 1W TF. But there is also a powerful signal from the BB lower band being nearby indicating that the pair is oversold so we can go long from the support line below and a target at 1.866 level.
Disclosure: I am part of Trade Nation's Influencer program and receive a monthly fee for using their TradingView charts in my analysis.
✅LIKE AND COMMENT MY IDEAS✅

GOLD LONG FROM SUPPORT
GOLD SIGNAL
Trade Direction: long
Entry Level: 3,281.17
Target Level: 3,348.67
Stop Loss: 3,236.17
RISK PROFILE
Risk level: medium
Suggested risk: 1%
Timeframe: 7h
Disclosure: I am part of Trade Nation's Influencer program and receive a monthly fee for using their TradingView charts in my analysis.
✅LIKE AND COMMENT MY IDEAS✅
