ZS Zscaler Options Ahead of EarningsIf you haven`t bought the dip on ZS:
Now analyzing the options chain and the chart patterns of ZS Zscaler prior to the earnings report this week,
I would consider purchasing the 250usd strike price Puts with
an expiration date of 2026-1-16,
for a premium of approximately $29.30.
If these options prove to be profitable prior to the earnings release, I would sell at least half of them.
Disclosure: I am part of Trade Nation's Influencer program and receive a monthly fee for using their TradingView charts in my analysis.
Buy!!

BSV/USDT Breakout and Potential RetraceHey Traders, in today's trading session we are monitoring BSV/USDT for a buying opportunity around 36.10 zone, BSV/USDT was trading in a downtrend and successfully managed to break it out. Currently is in a correction phase in which it is approaching the retrace area at 36.10 zone.
Trade safe, Joe.

doge buy midterm"🌟 Welcome to Golden Candle! 🌟
We're a team of 📈 passionate traders 📉 who love sharing our 🔍 technical analysis insights 🔎 with the TradingView community. 🌎
Our goal is to provide 💡 valuable perspectives 💡 on market trends and patterns, but 🚫 please note that our analyses are not intended as buy or sell recommendations. 🚫
Instead, they reflect our own 💭 personal attitudes and thoughts. 💭
Follow along and 📚 learn 📚 from our analyses! 📊💡"

SILVER Will Move Higher! Buy!
Here is our detailed technical review for SILVER.
Time Frame: 1D
Current Trend: Bullish
Sentiment: Oversold (based on 7-period RSI)
Forecast: Bullish
The market is trading around a solid horizontal structure 3,333.6.
The above observations make me that the market will inevitably achieve 3,538.8 level.
P.S
Overbought describes a period of time where there has been a significant and consistent upward move in price over a period of time without much pullback.
Disclosure: I am part of Trade Nation's Influencer program and receive a monthly fee for using their TradingView charts in my analysis.
Like and subscribe and comment my ideas if you enjoy them!

AUDUSD Is Very Bullish! Long!
Please, check our technical outlook for AUDUSD.
Time Frame: 1h
Current Trend: Bullish
Sentiment: Oversold (based on 7-period RSI)
Forecast: Bullish
The market is approaching a key horizontal level 0.650.
Considering the today's price action, probabilities will be high to see a movement to 0.653.
P.S
The term oversold refers to a condition where an asset has traded lower in price and has the potential for a price bounce.
Overbought refers to market scenarios where the instrument is traded considerably higher than its fair value. Overvaluation is caused by market sentiments when there is positive news.
Disclosure: I am part of Trade Nation's Influencer program and receive a monthly fee for using their TradingView charts in my analysis.
Like and subscribe and comment my ideas if you enjoy them!

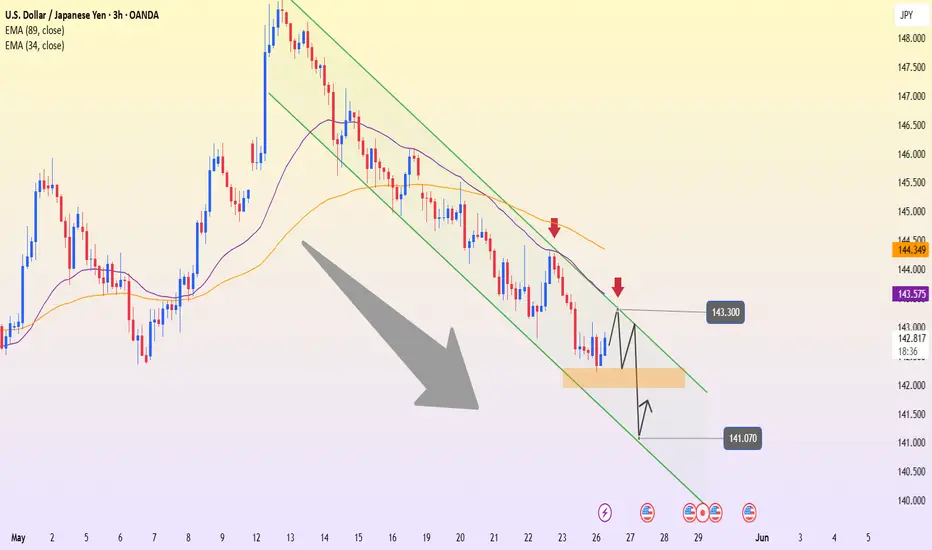
USDJPY – Bearish Channel Holds, Eyes on Support BreakUSDJPY is currently trading within a clearly defined bearish channel on the 3H timeframe, consistently forming lower highs and lower lows. After a slight bounce from the 142.50 support zone, the price is now heading toward the 143.30 resistance area — which aligns with the upper boundary of the channel. This is a zone likely to face rejection and renewed selling pressure.
On the news front, Moody’s recently downgraded the U.S. credit rating due to concerns over prolonged budget deficits, putting pressure on the USD. Although the interest rate gap between the Fed and the BoJ still favors the dollar, current market sentiment is making it harder for USDJPY to maintain a strong rally.
If the 143.30 resistance holds, the price is likely to be pushed back down to retest the 141.07 support zone — a previous low and the lower boundary of the descending channel. A confirmed break below this level would signal further downside, with the next target below the 140.00 mark.
1.15150 Resistance Looms Amid EU Economic WoesOn the daily timeframe, EURUSD continues climbing toward the strong resistance zone around 1.15150 after a solid rebound from the EMA 34. However, the current candlestick structure shows signs of slowing momentum as price approaches a historically significant top — a zone prone to short-term profit-taking.
The technical setup becomes even more relevant when viewed alongside macroeconomic developments: the U.S. has just announced an extension of its 50% tariff deadline on EU goods from June 1 to July 9, temporarily easing trade tensions. However, the European Commission has revised down its Eurozone growth forecast for 2025 from 1.3% to 0.9%, highlighting persistent structural weaknesses and economic risks in the region.
The likely scenario: EURUSD may face rejection at 1.15150, followed by a pullback toward the support area around 1.09610. This zone aligns with the EMA 34, EMA 89, and a previous accumulation range. If this support fails to hold, the medium-term trend could shift clearly to the downside.

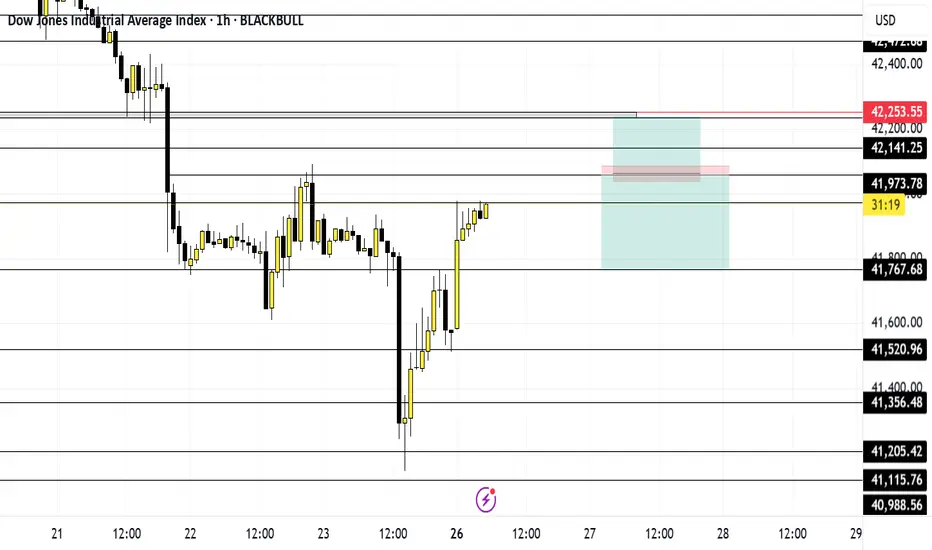
May 26 US30Let's get to work... Price at the moment is trending down, creating lower highs and lower lows on the 4hr. However it broke structure on the 1hr and is trending upward.
I'm going to wait for price to get to 42,055 level and wait for it to break and retest for a buy or break structure for a sell.
Caution. Monday is a holiday so I most likely won't trade until Tuesday.
And ultimately whichever way price goes I'm going to get out at my net key level.
Have fun, stay safe and enjoy your journey
XAUUSD – Signs of Weakness at the Pressure ZoneToday’s market has low trading volume as both the UK and the US are on holiday. This makes price action more prone to “choppy” movements within a narrow range, and technical signals tend to become more reliable.
Gold is approaching a strong resistance zone around 3,420 – a level that previously triggered a sharp drop in early May. Based on the current technical structure, it’s clear that gold is entering a “pressure zone,” as upward momentum slows down and recent candles start to show hesitation.
The most likely scenario is a rejection at 3,420, followed by a pullback toward the 3,250 support area – where EMA 34 and prior accumulation volume converge. If this zone fails to hold, the next target could be around 3,170.
We don’t always have to “call the top,” but this is definitely a time to dial back bullish expectations and closely monitor price action in this sensitive area.

$BBAI setting up for a monster move! 200% UpsideNYSE:BBAI - If it flagged once, it will flag again...⛳️
🎯$5.20🎯$6.75🎯$9.40
- H5_L Bullish Cross
- Volume Shelf Launch
- WR% Swinging Green to Red 🧲

BTCUSDT – Hitting resistance, is selling pressure returning?Bitcoin is showing signs of losing momentum after touching the resistance zone around 111,669. On the H4 timeframe, the previous bullish structure has stalled with a series of red candles and a clear pullback, bringing price back to test the EMA 34 zone.
In terms of news, although the market remains excited due to expectations surrounding a Bitcoin spot ETF, many large investors are starting to take profits after the recent sharp rally. This is causing selling pressure to slightly outweigh buying in the short term.
The most likely scenario now is that BTC could make a mild upward move to retest the 111,600 area – but if it fails to break above, a reversal back toward the support zone at 105,800 is highly probable. This area aligns with the EMA 89 and a previous accumulation zone.
Current strategy: don’t get caught in a false breakout. Instead, watch the 111,600 area and wait for a clear signal. If a reversal candlestick pattern appears, short-term sell entries may be considered with a target near the lower support.

EURUSD – Testing Key Resistance, Signs of a Pullback EmergingEURUSD is gradually approaching the strong resistance zone around 1.142 – a level that has rejected price at least twice in the past. The recent bullish momentum is clear, but the current move is nearing a major barrier, increasing the likelihood of a short-term pullback.
If the price fails to break this zone and rejection signals appear, a drop back toward the support area around 1.125 is highly possible – this level aligns with the EMA 89 and recent swing lows. It will be a key area to watch where the market might “take a breath” before deciding the next direction.
The current strategy is to patiently observe price action at this resistance zone. If confirmation appears, this could offer an opportunity for short-term sell setups. However, if the price decisively breaks above 1.142, the bearish scenario would be invalidated.

XAUUSD holds the trend – Will it break through 3,440?Gold continues to maintain a strong uptrend on the daily timeframe, supported by a rising trendline and upward-sloping EMA 34 and EMA 89. The price is now approaching the key resistance zone at 3,440 – a level that has been rejected twice in the past – making a slight pullback entirely possible.
However, the market structure shows no signs of reversal, and any dip toward the support area around 3,210 could present a “buy on dip” opportunity. As long as the price remains above the ascending trendline, the primary trend is still upward.
Traders are advised to patiently wait for clear signals near support rather than FOMO at resistance. If the 3,440 barrier is broken successfully, bullish momentum may accelerate toward higher targets.

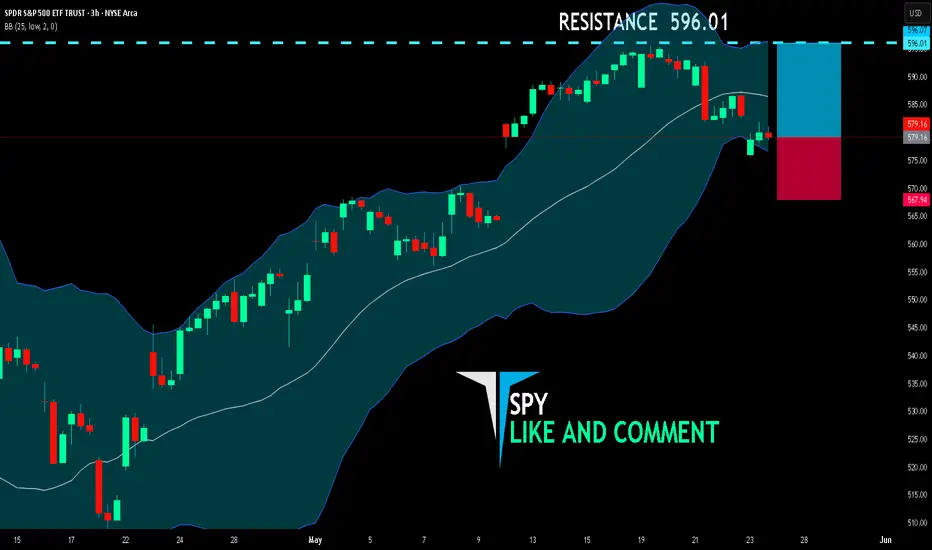
SPY LONG FROM SUPPORT
SPY SIGNAL
Trade Direction: long
Entry Level: 579.16
Target Level: 596.01
Stop Loss: 567.94
RISK PROFILE
Risk level: medium
Suggested risk: 1%
Timeframe: 3h
Disclosure: I am part of Trade Nation's Influencer program and receive a monthly fee for using their TradingView charts in my analysis.
✅LIKE AND COMMENT MY IDEAS✅
USOIL Will Go Higher From Support! Buy!
Please, check our technical outlook for USOIL.
Time Frame: 9h
Current Trend: Bullish
Sentiment: Oversold (based on 7-period RSI)
Forecast: Bullish
The price is testing a key support 61.684.
Current market trend & oversold RSI makes me think that buyers will push the price. I will anticipate a bullish movement at least to 64.409 level.
P.S
Please, note that an oversold/overbought condition can last for a long time, and therefore being oversold/overbought doesn't mean a price rally will come soon, or at all.
Disclosure: I am part of Trade Nation's Influencer program and receive a monthly fee for using their TradingView charts in my analysis.
Like and subscribe and comment my ideas if you enjoy them!

CADJPY Will Go Higher! Long!
Take a look at our analysis for CADJPY.
Time Frame: 1D
Current Trend: Bullish
Sentiment: Oversold (based on 7-period RSI)
Forecast: Bullish
The market is testing a major horizontal structure 103.810.
Taking into consideration the structure & trend analysis, I believe that the market will reach 105.723 level soon.
P.S
We determine oversold/overbought condition with RSI indicator.
When it drops below 30 - the market is considered to be oversold.
When it bounces above 70 - the market is considered to be overbought.
Disclosure: I am part of Trade Nation's Influencer program and receive a monthly fee for using their TradingView charts in my analysis.
Like and subscribe and comment my ideas if you enjoy them!

GOLD BULLS WILL DOMINATE THE MARKET|LONG
GOLD SIGNAL
Trade Direction: long
Entry Level: 3,297.95
Target Level: 3,337.98
Stop Loss: 3,271.20
RISK PROFILE
Risk level: medium
Suggested risk: 1%
Timeframe: 1h
Disclosure: I am part of Trade Nation's Influencer program and receive a monthly fee for using their TradingView charts in my analysis.
✅LIKE AND COMMENT MY IDEAS✅

EUR/CAD LongMacro fundamentals favor EUR strength: Strong Q1 GDP, sticky inflation, and no urgency for ECB rate cuts.
CAD is weakening: Oil prices are down ~15% for the month, BoC is leaning dovish, and trade risks remain elevated.
Technical structure is bullish: EUR/CAD broke above multi-year resistance at 1.5500. Price is now pulling back into that zone, which is likely to act as support (classic break-and-retest setup).
Monthly and weekly candles both support a bullish continuation, and this entry gives you a clean structure with tight risk and high reward potential.
EUR/CAD Swing Long Trade Setup
Entry: 1.5520 (buy limit)
Stop Loss: 1.5375 (below weekly structure and invalidation point)
Take Profit 1: 1.5800
Take Profit 2: 1.6000

doge buy midterm"🌟 Welcome to Golden Candle! 🌟
We're a team of 📈 passionate traders 📉 who love sharing our 🔍 technical analysis insights 🔎 with the TradingView community. 🌎
Our goal is to provide 💡 valuable perspectives 💡 on market trends and patterns, but 🚫 please note that our analyses are not intended as buy or sell recommendations. 🚫
Instead, they reflect our own 💭 personal attitudes and thoughts. 💭
Follow along and 📚 learn 📚 from our analyses! 📊💡"

$QQQ Needs this pullback to happen!NASDAQ:QQQ a healthy pullback to fill the GAP and retest the 100/200DMA here going into next week.
A break through these MA's would be very bearish.

USDCAD Is Bullish! Buy!
Take a look at our analysis for USDCAD.
Time Frame: 10h
Current Trend: Bullish
Sentiment: Oversold (based on 7-period RSI)
Forecast: Bullish
The market is on a crucial zone of demand 1.379.
The oversold market condition in a combination with key structure gives us a relatively strong bullish signal with goal 1.387 level.
P.S
The term oversold refers to a condition where an asset has traded lower in price and has the potential for a price bounce.
Overbought refers to market scenarios where the instrument is traded considerably higher than its fair value. Overvaluation is caused by market sentiments when there is positive news.
Disclosure: I am part of Trade Nation's Influencer program and receive a monthly fee for using their TradingView charts in my analysis.
Like and subscribe and comment my ideas if you enjoy them!

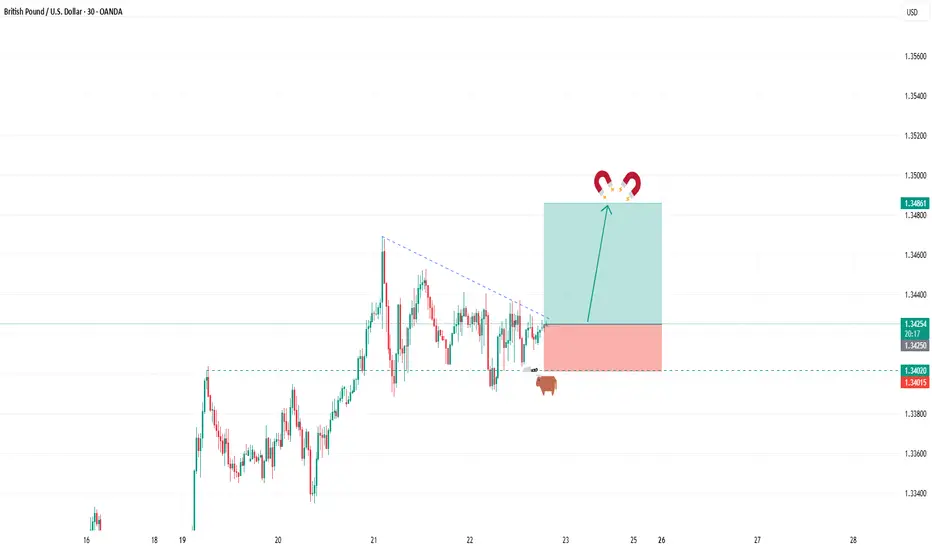
BUY GBPUSDIn todays session we are keenly monitoring CABLE for buying opportunity. Our buy entry is at 1.34258 and our target is at 1.34860 and our tight stop loss is at 1.3400. Use proper risk management. Cheers to you all.
GBPUSD Will Go Up! Buy!
Please, check our technical outlook for GBPUSD.
Time Frame: 4h
Current Trend: Bullish
Sentiment: Oversold (based on 7-period RSI)
Forecast: Bullish
The price is testing a key support 1.341.
Current market trend & oversold RSI makes me think that buyers will push the price. I will anticipate a bullish movement at least to 1.350 level.
P.S
Please, note that an oversold/overbought condition can last for a long time, and therefore being oversold/overbought doesn't mean a price rally will come soon, or at all.
Disclosure: I am part of Trade Nation's Influencer program and receive a monthly fee for using their TradingView charts in my analysis.
Like and subscribe and comment my ideas if you enjoy them!
