Buy-sell-signal


EURJPYSimple Setup For Trading.
Wait For Breakout and get some confirmation and then enter the position.


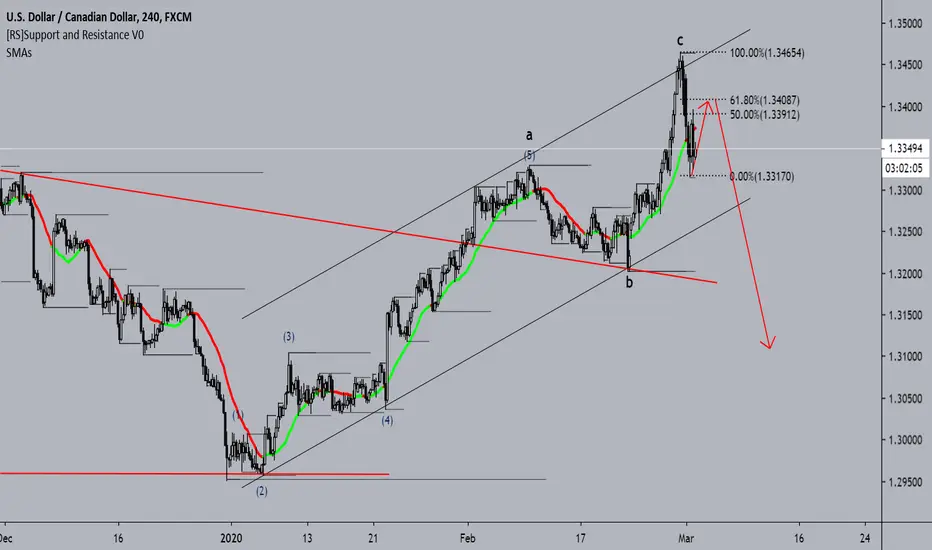
GBPUSD - SHORTBased on my analysis and theory, GBPUSD will be short for short-term
You can see the resistance level that put GU fall to around 1.354 support area and once it breakout the support area then it will fall more further to around 1.344 support area before we see GU going back up.
This is my personal view
Trade at your own risk.
- Give thumb up and follow for more future analysis and theory :)

*USD/CHF* Entry & ExitLets keep it simple.
Sell IF candle closes below the 0% and T/P at -27.2%
No trade if it doesn't follow plan
Goodluck!

*EUR/USD* Entry & ExitBuy IF: candle closes above 38.2% level. set T/P at the next level above it
Sell IF: candle closes below 0% level. Set T/P at the next level below it
Good luck!

*USD/CHF* Entry & ExitBuy IF - candle closes above 0% level. Take Profit at the next level above
Sell IF - candle closes below 38.2% level. Take profit at the next level below
Note 1: for more accurate entry, wait for the next candle to test the broken fib level as support/resistance
Note 2: T/P is a one touch target. If the candle reaches the T/P level before closing, do not enter.

EUR/AUD FULL ANALYSIS: Possibly massive trend reversal ahead!Hi traders,
Here's the EUR/AUD pair which possibly signals a massive trend reversal and a buying opportunity.
As usual, we don't take any trades unless all rules of our trading strategy align.
TECHNICALS :
The pair has been in a nice downtrend since March, forming fresh LLs and LHs until it reached the 1.61 support, which aligns both with a horizontal support and a longer-term rising trendline.
The interesting part happened yesterday: Risk-off flows formed a fresh HH (after the pair failed to form a fresh LL on June 8), signaling a possible trend reversal.
The 1-hour chart zooms in a possible entry area: A pullback to a short-term horizontal support level.
Now to the other signals that point up:
RISK SENTIMENT:
Risk sentiment has notably changed yesterday with the sell-off in US equities and with signs of a possible second wave of the Covid-19. This could continue in the week ahead.
POSITIONING :
Markets are bullish on the EUR after the recent ECB meeting, and have total bearish positioning on the AUD. Although the net AUD bias (net changes in positioning) has been bullish with the recent risk-on, this could possible change in the next trading week and push the EUR/AUD pair up.
CORRELATIONS and INTEREST RATES:
German/Australian 2y yields (green) are slightly diverging from the exchange rate, and Copper keeps falling (yellow line, inverted) as global demand vanishes. This could be another headwind for the AUD and provide support for the pair in the coming week.
Please hit the "LIKE" button if you would like more posts like this. Thanks!

USDCAD Analysis Idea (Read Description)Hello Traders,
Here's my analysis for USDCAD, if this does happen, open a buy on oil as it will be going up.
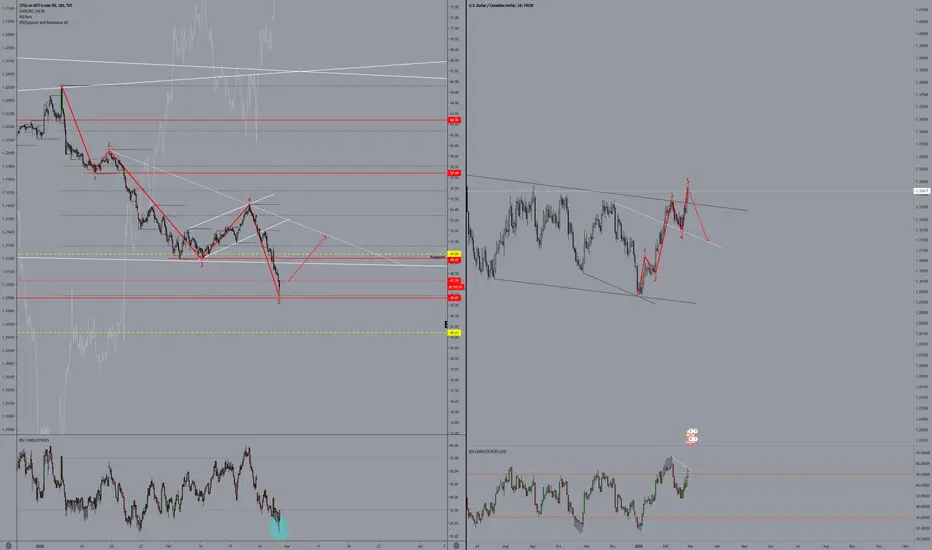
USOIL Updated Anlaysis w/USDCADHello Traders,
Here's my analysis for both USDCAD and USOIL, as we know when USDCAD drops, Oil goes up!
USOIL Analysis Buy ZoneHello Traders,
Here's my analysis for USOIL, I set a buy limit @ 42.00 and my stop loss is 40.00
Trade safely

XAUEUR 2310 BULL PATTERN?!?!Hello Traders,
It seems to me that XAUEUR, has a pattern on 2310-2315 days it has a bullish movement.
Trade Safe


XAUUSD Possibility/ZonesHello Traders,
Here's my analysis and zones for XAUUSD, make sure to use proper risk management as buying at 1600 zone could be risky!
Trade Safe :P
