DigitalNote Double Bottom FormationOn the 15th of June, DigitalNote has formed a double bottom at $0.005 level. This is 161.8% Fibonacci retracement applied to the corrective wave up after the uptrend trendline breakout.
The Fibonacci support has been rejected twice cleanly after which price went up and broke above the 50 moving Average and the descending channel at the same time. On the corrective wave down, XDN/BTC has rejected the upper trendline of the descending channel and went up once again.
It seems that the 50 Moving Average is currently acing as the support and from this point onward XDN might start moving higher. The strong resistance is seen at 38.2% Fibonacci retracement that is $0.01 strong psychological level. Break above it could confirm the bullish trend formation for the long term, while rejection is likely to result in a strong wave down.
On a downside, break and close below the $0.005 support will invalidate short or long term bullish scenario and could send price to new lows.
Buy-signal

Decentraland Established The UptrendSince 11th of July, Decentraland has been moving steadily upwards producing higher highs and higher lows. On the 17th of July price reached the high at $0.135, which has resulted in a 53% growth in less than a week.
Then price corrected won to $0.11, where MANA/USD has rejected cleanly 50% Fibonacci retracement level. Today MANA broke above the ascending channel, suggesting the continuation of the uptrend.
There are several resistance levels to watch. First 161.8% at $0.14, second 261.8% at $0.17, and the final upside target and strong resistance is at 361.8% Fibs, that is $0.2.

Substratum Trend Reversal?Substratum did hit the bottom on the 29th of June, where it hit $0.16. At that stage RSI formed a bullish divergence on the 4h timeframe suggesting the correction up.
Currently it is obvious that price started to print higher highs and higher lows, and recently broke above the 200 Moving Average, reaching $0.3 high. On the small corrective move down, SUB/USD has rejected the 200 Moving Average and 38.2% Fibonacci support at $0.25.
Such price action suggest the continuation of the corrective move upwards, and price could reach 38.2% Fibs at $0.45, which also corresponds to the 461.8% Fibs applied to the current corrective wave down.
When/if the resistance is rejected and broken, further growth potential shall become quite likely and could mean trend reversal for the Substratum, which at the end might result in a new all-time high.

ICON vs Bitcoin Slowly Moving UpICON seem to have found the bottom at btc 0.0002 area. Since 14th of June price has been slowly but steadily moving upwards, producing higher highs and higher lows.
While rising, on a correctional wave down ICX/BTC rejected the 2/1 Gann Fan trendline along with the 50% Fibonacci retracement level at btc 0.000215.
Icon has approached the 200 Moving Average, but failed to reach it. It is highly likely that on the next wave up, the Moving Average will be reached, the question is whether it will be broken or rejected.
If broken ICX should continue going higher towards either 61.8% or 76.4% Fibonacci retracement level. But, if Moving Average will be rejected, Icon might correct down, perhaps to test the btc 0.000215 support yet again.

Groestlcoin Upside TargetGroestlcoin has formed a double bottom on the 12th of June and since then price has been climbing up consistently, while rejecting the uptrend trendline. Price broke above the extended descending channel and the 200 Moving Average.
The channel and MA breakout occurred simultaneously just today, suggesting further upside potential. GRS/USD is now highly likely to move up towards the key resistance seen at $0.9. This is the 23.6% Fibonacci retrenchment level, where previously price bounced off a number of times.
If the $0.9 resistance is broken, GRS should test the strong psychological price at $1. And finally, break and close above $1 should confirm the trend reversal, at least for the short to medium term, which could result in a strong growth.
Currently, the correction down is possible, perhaps down to the 200 Moving Average, but only break and close below the $0.48, should invalidate bullish outlook, where Groestlcoin shall continue trending down.

INS Ecosystem Correction UpINS Ecosystem found the bottom at $0.52, that has been tested on the 12th of June. There INS/USD formed a double bottom and rejected the downtrend trendline as well as 127.2% Fibonacci retracement level for the second time, suggesting that the bottom might have been reached.
Today price has been going upwards and broke above the 50 Moving Average. Perhaps this is the first strong sign of a potential upcoming corrective wave down, that should result in a growth towards 88.6% Fibonacci retracement. This is $0.9 level, which corresponds to the previous support formed back in April.
Break above that resistance would most likely result in a growth towards the key psychological support at $1. If INS will managed to break and close above that price, it could mean the beginning of an uptrend and not only a corrective move up.
On a downside, if INS Ecosystem will close below the recent low at $0.52, the bullish outlook should be invalidated, resulting in a continuation of a downtrend or the beginning of a consolidation phase.

BitShares Beating BitcoinOn the 24th of June, BitShares found the bottom at 1980 satoshis, where it has rejected cleanly 78.6% Fibonacci retrenchment level. Then price went up and broke above the 50 Moving Average and the descending channel, reaching 2800 satoshis high.
On a corrective wave down, BTS/BTC retraced down to 2500 satoshis area, where it rejected the 61.8% Fibs level, along with the 50 Moving Average and the descending channel, all at the same time.
Price continues to produce higher highs and higher lows, and considering all this price action, the uptrend is very likely to continue. Strong resistance is seen at 23.6% Fibs, that is 3630 satoshis level, which corresponds to the 4/1 Gann Fan trendline. Break above this resistance could be confirmation of the long term uptrend continuation, which might result in BTS aiming for the new all-time high.
At the same time, it is important to watch 2400 satoshis support area, because break and close below would invalidate the uptrend and the range trading or even a strong move down could take place.

Quick EJ H4 buyHey ladies! Here's a quick trade I have pending for EJ. Blues = buy, red = stop, greens = targets
If greens are reached first, trade is invalid. Good luck!

Quantstamp VS Bitcoin Next WaveQuantstamp found the bottom at 925 satoshis on the 29th of June. Then price went up sharply breaking above the 50 Moving Average and the downtrend trendline at the same time.
Price has reached the 1390 satoshis high, where Quantstamp has gained over 50% against the Bitcoin. The corrective wave down followed and price found the support at the downtrend trendline, which has been rejected cleanly.
Considering the recent price action, the next wave is expected to be up, and Quantstamp could be heading towards the 1540 satoshis support, where previously it found the resistance. If that resistance is broken, the next upside target is seen at 2150 satoshis level, that is 61.8% Fibonacci retracement level.
At the same time, the consolidation could be expected to take place, where price will continue ranging between 1000 and 1300 satoshis. And only break and close below the 925 satoshis could invalidate bullish outlook.

BLOCKv VS Bitcoin Upside CorrectionBLOCKv has found the bottom at 256 satoshis, where RSI oscillator formed a bullish divergence. Price went up and broke above the downtrend trendline and the 50 Moving Average. On the small pullback, VEE/BTC rejected the Moving Average and produced a new higher high.
The higher highs and higher lows pattern currently presenting itself, suggesting the continuation of a short term uptrend and/or a correctional move upwards from the long term downtrend.
VEE could continue moving higher towards the key resistance at 483 satoshis. This is the very strong level and previously it has acted as the support as well as resistance on multiple occasions, not to mention that it does correspond to the 2/1 Gann Fan trendline.
Currently price is at 50% Fibs, that is 328 satoshis, and this could be the starting point of the uptrend continuation. Nevertheless, price still could decline and hit lower Fibonacci support level, prior to moving higher. But only break and close below the 256 satoshis could invalidate bullish outlook and result in a downtrend continuation.

GBPUSD BUY 70%I'm buying GBP, this is a counter-trade to the first PRZ level.
I see GBPUSD as a bear but I also see a retracement happening

USDJPY BUY SIGNAL 80%Hello Everyone,
I'm buying as soon as it retraces to the 38% PRZ level, and it makes a bullish engulfing candle or variation.
Also, I have been posting analysis on the weekends to show where my head is after a long week of trading so you'll see more of me on here.
When I enter a trade a have 3-4 confirmations and an exit plan, I would try to post mine in here or If I can make a telegram or fb page to show people my process of thinking.
I wish you guys and gals nothing but the best this week,
Thank you.

XVGBTC a good chance to open long positionVerge is one of the top coins, which can demonstrate good growth during 2018. Decrease to Fib 0.786 support level opens opportunity to open long position. Today, most markets are down, many other top coins also provide a good entry opportunity, but first of all we recommend to pay attention to XVG.
Bullish divergence of 4-hour scale can push the market to test the 0.00000725 level within a week.

Viberate VS Bitcoin Near Psychological SupportOn the 24th of June, Viberate hit the low at 1080 satoshis. This is the 127.2% Fibonacci retracement level applied to the previous corrective wave up. At the same time this is the area of the key psychological support, that is 1000 satoshis.
Technically speaking, it might be a very attractive price for buyers, which could result in a trend reversal or a correctional move upwards against the Bitcoin. If daily close will remain above 1k satoshis, price could easily reach the strong resistance at 1615 satoshis, which previously was the key support. The confirmation could be daily break and close the 1260 satoshis resistance, where the descending channel has been rejected.
On the other hand, if VIB/BTC stays below the 1260 resistance and break to the new lows, the downtrend continuation could take place and the bullish outlook would be invalidated.

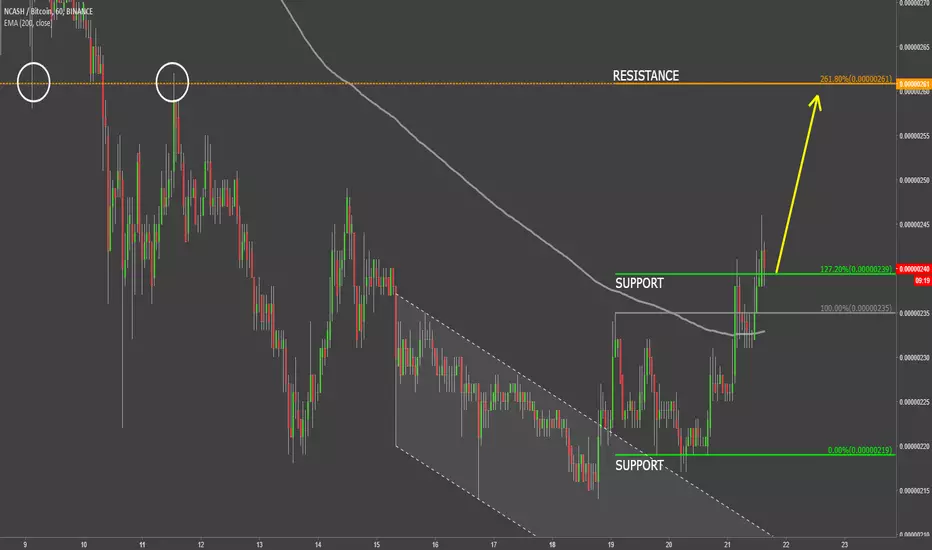
NCash VS Bitcion Short Term UptrendRecently NCash has found the bottom at 214 satoshis area. There it formed a double bottom, after which price went up and broke above the descending channel. Today NCASH/BTC broke above the 200 Moving Average, suggesting the beginning of an uptrend.
Fibonacci applied to the corrective wave down after the descending channel breakout shows that the nearest strong resistance is at 260 satoshis, which corresponds to the previous support and resistance.
At this stage NCash should continue moving higher, although small corrective move down can also be expected. Break below 200 satoshis could invalidate bullish outlook where the downtrend continuation will take place.
ISimple Token Expected to Double in ValueISimple Token seem to have found the bottom at $0.023 level. The support level is seen at 78.6% Fibonacci retracement, that is $0.027. This level today has been rejected along with the 3/1 Gann Fan trendline, while the price produce a new high high.
Simultaniously, IOST/USD is breaking above the downtrend trendline, and this combined price action suggests the beginning of a short or medium term uptrend. The strong resistance is seen at 23.6% Fibs, that is $0.063. If/when this price is reached IOST would more than double in value against the USD.
It seems that today price bounced off the support level, with the daily low at $0.026. Break and close below that price on the daily chart would invalidate bullish outlook. This makes the potential buy trade setup with an extremely high risk/reward ratio, which could be very attractive for ISimpleToken investors.

Etherparty Should Outperform BitcoinEtherparty has recently found the bottom, hitting 541 satoshis level. At this price it rejected the 261.8% trendline of the Fibonacci channel, applied back in 2nd of May, when FUEL/BTC produced the high.
Then it managed to break and close above the 50 Moving Average suggesting the beginning of a correctional wave up, or even a potential trend reversal. Currently Etherparty is trading right at the 50 Moving Average which this time could act as the support providing a good buying opportunity for the short term.
FUEL could grow from 600 up to 1000 satoshis level, that is 61.8% Fibonacci retracement level, conformed by the 161.8% trendline of the Fibonacci channel. All-in-all, fast growth should be expected, unless price breaks below the 541 satoshis low.

Clams Facing Massive SupportToday CLAMS has reached 11 months low, hitting $2.27 level. This is the key support level for CLAM/USD, that has been rejected for at least 4 consecutive times during the past year. During that year price has moved in cycles, producing up and down waves.
If this cycle will continue the next wave could be starting shortly and confirmation of that could be the break above the descending channel.
At this stage price could either start to consolidate, move slightly lower, potentially to test $2 psychological support, or start a sharp rise. But it is certainly an interesting timing for CLAMS, and if support are will hold and price will stay above the $2, price might go up towards the previous support level at $13 area.

Bitcoin Should Breakout SoonSince February, when Bitcoin found the low at $6k, price continues to consolidate within the triangle patter. Currently BTC/USD is trading very close to the uptrend trendline and the support level at 78.6% Fibonacci retracement level.
Could it be the turning point for BTC? Yes, it certainly could be. Current price seems very attractive and could provide a good buying opportunity for the medium to short term investors. While BTC stays above $6k, the probability of the uptrend remains very high. There are two resistance areas where the Bitcoin could be heading towards, first is $13k and second $18.5k. Both of them are confirmed by Fibonacci retracement levels.
Only if BTC will break and close below $7k, price could reach $6k support once again, which is a key support. Break below $6k should invalidate bullish outlook and might result in a decline towards $4k area.

Tierion Confirming The UptrendSince May, Tierion was moving downwards and has lost nearly 60% to the USD. But on the 29th of May it has bounced off the 88.6% Fibonacci retracement level, that is $0.064. The following wave up resulted in a break above the downtrend trendline reaching the high at $0.088.
The correction down followed and TNT/USD this time found the support at 76.4% Fibonacci retracement level, that is $0.07. Throughout the past few days this support level has been rejected and if not broken, Tierion should start moving higher.
The resistance is seen at 50% Fibs, that is $0.125, which corresponds to the uptrend trendline resistance. But it is still important to watch the $0.064 support level, as the break and close below will invalidate bullish outlook.

BitcoinCash vs Bitcoin Uptrend EstablishedBitcoinCash found the bottom at btc 0.123 while forming a bullish divergence on the RSI oscillator. The following wave up resulted in a break above the downtrend trendline and the 50 Moving Average, suggesting the continuation of the already established uptrend.
The recent wave up resulted in a break above the btc 0.152 resistance level, confirming BCC/BTC bullish intentions. The potential move up might result in a growth towards btc 0.2, that is 38.2% Fibonacci retracement applied through the all-time high.
But this is only the first upside target and key resistance level. If Bitcoin Cash will break above, that should confirm further uptrend and could send price much higher. On the other hand, rejection could result in a corrective move down or an extended consolidation.
The risk of the downtrend will only become valid once/if price breaks below the btc 0.123. In that case BCC could go down towards btc 0.1 psychological support.

Status Rejecting Second SupportOn the 29th of May Status has found the support at 88.6% Fibonacci retracement, that is $0.087 level. The following wave up resulted in a break above two descending channels and reaching the high at $0.1.
The corrective wave down followed and SNT/USD yet again fond the support, this time at the 76.4% Fibs, that is $0.091. The strong support area has been formed between $0.087 and $0.091, and while it is holding, trend is likely to reverse to the upside.
Nearest resistance could be 61.8% Fibs retracement level, that is $0.15, which could provide a potential growth of 60% in the medium term. If that resistance is broken, an exponential growth by Status could take place.
It is important to watch the support area in general and $0.086 level in particular, as daily break and close would invalidate bullish outlook and could result in a decline towards the previous support at $0.074

NEO Soon Could Reach $120This week NEO tested the low at $47 after which price went up, breaking above the downtrend trendline followed by the break above the 50 Moving Average. Such price action could be the first signs of the upcoming uptrend, providing a good risk/rewards buying opportunity.
The upside target is seen at 50% Fibs applied though the all-time high, that is $121 area. It is also confirmed by 161.8% Fibs, applied to the recent corrective wave down. This makes the area between $121 and $123 a strong resistance and a potential upside target.
The only way price could continue to decline, is when/if NEO/USD will break below $44 support area, which currently seems as unlikely scenario.
