EOS Might Reach $30Since EOS has reached the $23 high, on the 29th of April, price corrected down and found the support at $10. The support is confirmed by 161.8% Fibs applied to the corrective wave down after the breakout of the descending channel on the 11th of April.
EOS/USD formed a double bottom at $10 support and today it broke above the descending channel. Current price action suggest the continuation of the uptrend, where EOS could reach strong resistance at $27. It is very close to the $30 psychological price and it is likely that EOS will find the resistance at that area.
To invalidate bullish outlook, EOS/USD must close below the $10 support, which could trigger a stronger move down, that could result in a decline towards $4 support area.
Buy-signal

Ethereum VS Bitcoin RiseEthereum uptrend has been obvious up until the 20th of May when it reached btc 0.085 high. Then price corrected down to btc 0.071, losing 16% to Bitcoin. However ETH/BTC cleanly rejected the 2/1 Gann Fan trendline followed by the breakout of the downtrend trendline, not to mention the formation of the Bullish Divergence on the RSI oscillator.
This might imply that the uptrend is about to continue and price could reach btc 0.095, that is 161.8% Fibonacci retracement level, applied to the current corrective wave down. The btc 0.095 is very close to the btc 0.1 psychological resistance that potentially could also be reached. But the break above that resistance could send ETH much higher, although it yet to be seen.
On the downside, break and close below btc 0.071 support would invalidate bullish outlook and could result in continuation of the correctional move down.

Burst Could Triple Against BitcoinSince April, Burst has been steadily moving upwards producing higher highs and higher lows, while it moved from 190 up until 360 satoshis. On a corrective wave down price reached 280 satoshis support, that has been rejected along with the uptrend trendline.
Yesterday BURST/BTC broke above the minor resistance at 320 satoshis, which should result in a continuation of the long term uptrend. There are several resistance to watch, first is 78.6% Fibs at 785 satoshis. Second is 88.6% Fibs at 875 satoshis. And final resistance is near 1000 satoshis, that is a strong psychological level, and also the price that was rejected twice back in 2017.
The uptrend could only be invalidated in daily close will be below 280 satoshis support. In that case consolidation could take place and even decline towards 200 satoshis area.

GAS vs Bitcoin Getting TractionGAS has found the support at btc 0.0024, that is 76.4% Fibonacci retracement level. This support has been rejected twice, along with the uptrend trendline. The wave up followed, where GAS/BTC broke above the downtrend trendline suggesting the beginning of the uptrend.
Nearest upside resistance is seen at 38.2% Fibonacci, that is btc 0.0038. Previously this level has been acting as the support and then resistance, therefore it is reasonable to expect some resistance again.
While the price continues to print higher highs and higher lows, the downtrend seems to be unlikely at this point. Only break and close below the btc 0.002 could invalidate bullish outlook and establish the downtrend.

Binance Coin Valid UptrendBack in February, Binance coin found the bottom at the 78.6% Fibonacci retracement level, that is $5.58. Since then price has been steadily rising, producing higher highs and higher lows. The recent correction from the $16.3 high, resulted in a decline towards the $12 support, where the uptrend trendline has been rejected cleanly.
The BNB/USD trend remains bullish, and after todays' encreased trading volume the price seems to be ready to continue moving higher from this point. The strong resistance is seen at 23.6% Fibs that is $18.5 and could be reached in a relatively short period of time. Break above that resistance will most likely result in a much stronger growth, while rejection would trigger a correction down.
On a downside, break and close below recent low, that is $11.6 would invalidate bullish outlook and could result in a extended consolidation or even a decline towards the $8 area.

Databits Moving In WavesDatabits range trading continues and price seem to be stuck between $0.5 and $1 areas. The recent wave down found the support at 76.4% Fibonacci retracement level that is exactly $0.5, and that level was rejected cleanly.
While this support is holding it is likely that DTB/USD will produce a wave up, repeating the previous pattern. The resistance is seen at 38.2% Fibonacci retracement level, that is $1.14. It is a key resistance that should play an important role in further price development as the break above could send Databis to the new all-time high.
Daily break and close below the $0.5 support might send DTB down to the $0.35 support, thus extending the timeframe for the next wave up.

IOTA vs Bitcoin Price Prediction 2018IOTA has fond the bottom near 140k satoshis that is 76.4%. At first price went slightly lower, but eventually rejected the Fibonacci support together with the uptrend trendline. Price went up and on a corrective wave down rejected the 61.8% Fibonacci support together with the upper trendline of the descending channel.
All-in-all trend now is bullish and growth is likely to continue. The nearest resistance for IOT/BTC is around 420k satoshis, that is a potential double top. If price managed to break above, the next resistance and the key target is around 640k satoshis, which could be reached this year.
On a downside, IOTA could correct down to the 50 Moving average and even down to the 140k satoshis support, but only a break and close below 127k satoshis could invalidate bullish outlook.

ChatCoin VS Bitcoin Respecting The SupportChatCoin continues to trade above the 200 Moving Average and what is more important is that price has bounce of the MA multiple times and yet continues to reject it till now. Today CHAT/BTC is trading right at the MA and the 1385 satoshis support.
While the support is holding ChatCoin is likely to continue moving higher and could reached the upside target at 2640 satoshis. This is the resistance level that corresponds to the 427.2% Fibonacci retracement as well as the previously established high back on the 15th March.
But if current support is broken with a daily close below 1385 satoshis, price might continue to go lower towards next support based at 1000 satoshis psychological round number and even down to the previous low near 650 sat.


Aelf VS Bitcoin Uptrend AccelerationFollowing the previous idea on Aelf , it has reached and broke above the upside target suggesting the continuation and perhaps acceleration of the uptrend. ELF/BTC has gained 325% since March, while the price moved from 6k satoshis support up to 23.8k satoshis all-time high.
On a corrective wave down price corrected to 14.7k satoshis, that is 50% Fibonacci retracement level that has been rejected cleanly. At the same time ELF is very close to 50 Moving Average which could act as the support as it was on the 25th of April.
While Aelf is trading above 10k satoshis psychological support price is likely to continue moving higher providing a strong growth. Because the nearest resistance, the key resistance, is at 65k satoshis, that is confirmed by two Fibonacci retracement leveles, 727.2% and 361.8%.
Nevertheless the downside risk always remains, but only break and close below 10k satoshis psychological support could invalidate bullish outlook.

Lunyr Solid UptrendAfter finding the bottom at $6.75, Lunyr has established a solid uptrend, continuously producing higher highs and higher lows. Clearly price is bouncing off the uptrend trendline and recently rejected the 23.6% Fibonacci support level.
All-in-all the trend is bullish, but in order to move higher, LUN/USD has to produce a new high while closing above the $17.72 resistance level. When/if this occurs, Lunyr should move towards the 61.8% Fibonacci retracement level, that is $26.6.
On a downside, the strong support is based at $14 area, where the uptrend trendline as well as the 23.6% Fibs support were rejected. Close below that level should invalidate bullish outlook and could result in a stronger correctional move down.

BitcoinCash Soon Could Reach $2000BitcoinCash bottomed out at $600 and price started to grow at a very high rate. BCH/USD has gained over 200% in just one month while hitting the $1845 high. Currently BCH has corrected won and seems that it has found the support at $1270 where it rejected the uptrend trendline.
If the uptrend trendline will be able to hold the price the uptrend continuation should take place. The next upside target is seen at $2025, that is 161.8% Fibonacci retracement level, not to mention that this is a very strong psychological resistance.
Nevertheless, the consolidation could take place before price will move higher. But only break below the uptrend trendline should push price down to $1150-1220 support area.

NANOBTC curve like movementOn a mid and long term timeframe charts the coin look very bullish. Technical indicators are in buy state, the price moves in curve like pattern bouncing from the trend line. Currently The asset is in oversold state and has bounced from its trend line. The price is about to enter Ichimoku cloud zone hence it should break local resistance. Stoch RSI and CCI confirms the possibility of such scenario. Fundamental analysis is also great: version 13.0 of the Nano Node has been released recently, update becomes more popular each day. The team visited the biggest crypto conference two days ago and plans to integrate in Ledger

Bluzelle Might Double Your BitcoinsBluzelle found the bottom at 3300 satoshis and started the uptrend while continued to move within the ascending channel. But recently price broke above the channel and on the corrective wave down rejected the upper trendline of the channel as well as the 50 Moving Average, suggesting the continuation of the uptrend.
The very strong resistance is seen at 14400 satoshis, which is confirmed by two Fibonacci retracement levels, 727.2% and 1127.2%. If/when this target is reached, the value of Bluzelle should double against the Bitcoin, since currently it is trading at 7250 satoshis.
On the downside, the correction down is possible and price could get back to the 5k satoshis support. Also BLZ/BTC could consolidate for a some time before moving higher. All-in-all it seems that there is an established uptrend with a high probability of a growth continuation.

Augur Short Term 80% Growth PotentialAugur has found strong support at $23, and started to move higher breaking above the downtrend trendline. But what is more important is that this week REP/USD managed to close above the 200 Moving Average, not to mention that the price continues to produce higher highs and higher lows.
The trend now seem to be very bullish and the Augur rise is likely to continue. The very strong resistance, that is potential upside target, is seen at 50% Fibonacci retracement level, that corresponds to the previous uptrend trendline. Only break and close above $75 resistance level should confirm a long term bullish uptrend. However, rejection of it, could result in a consolidation and potential correctional move down, back to the $40 area.
On a downside, price could return to the downtrend trendline breakout point, that is $27, but only break and close below the $23 support would invalidate bullish outlook.

NAVCoin VS Bitcoin Range BreakoutNAVCoin found the bottom at 11k satoshis after which range trading begun. NAV/BTC was moving between 11k support and 14.5k resistance for over a month. But on the 18th of April it finally broke above the range suggesting the beginning of an uptrend.
Just recently price rejected the uptrend trendline and currently finding the support at the previous level of resistance. The uptrend probability becomes high and price could jump as high as 28.5k satoshis, confirmed by two Fibonacci retracement levels.
On a downside, break and close below the 10k satoshis psycological support should invalidate bullish outlook and potential result in a downtrend continuation.


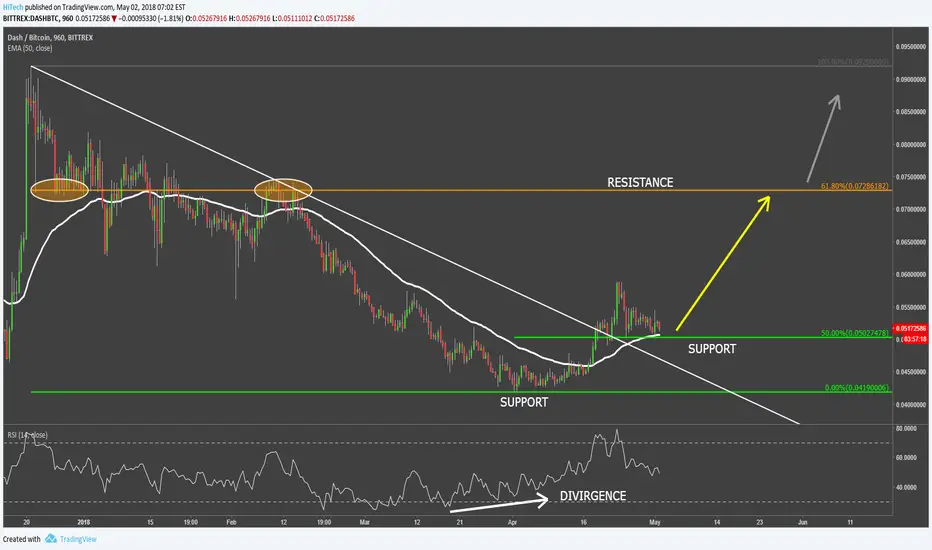
Dash VS Bitcoin Interesting TimingAfter Dash has found the bottom at btc 0.042, RSI oscillator has formed a bullish divergence and price has started to move up. DASH/BTC broke above the 50 Moving Average and then above the downtrend trendline, suggesting trend reversal.
Dash has reached the high at btc 0.059 and corrected down to btc 0.05, where it found the support at 50% Fibonacci retracement level and 50 Moving Average. The support has been rejected so fart and it looks like an interesting timing as from this point onward price could continue moving higher.
The next upside target is seen near 61.8% Fibonacci retracement area, that is btc 0.072. Previously price found the support and then resistance at the very same level. Break above that resistance could send price much higher while rejection should result in a strong corrective move down.
On the downside, break and close below the current support, that is btc 0.05, could send price down to btc 0.04 support to form a double bottom.
Bread VS Bitcoin Resistance To WatchBread token has found the bottom at 4800 satoshis and started to move upwards. While BRD/BTC has been ascending, the price moved withing the uptrend trendline, rejecting it multiple times. At the same time it continues to produce higher highs and higher lows suggesting the beginning of an uptrend.
There are two major resistance levels to watch, first is at 38.2% Fibonacci retracement level, that is 11k satoshis, second and key resistance is at 76.4% Fibs, that is 17.2k satoshis. Break and close above second resistance could send Bread token to the stars, while if rejected, a strong correction is very likely to take place.
On a downside, the uptrend seems to be obvious, although price could retrace back, down to either the uptrend trendline, 50 Moving Average, or in the worst case could form a double bottom at 4800 satoshis prior to moving higher.

Counterparty Long Term ViewCounterparty seem to find the bottom near $10 psychological support area. Price has reached the low at $9.63 where it rejected the uptrend trendline. Current price action suggests that the long term uptrend is likely to continue, especially after the 50 Moving Average has been broken on a Daily chart.
There are two resistance levels to watch, first is 76.4% Fibonacci retracement level at $82, second is $130, that is 127.2% Fibs. Counterparty remains one of the most undervalued coins right now and it could potentially have a huge growth this year, especially if it manages to break above the $130 level.
On the downside, while XCP/USD is holding the 50 Moving Average support price is likely to continue moving upwards, but only break and close below $16 support could send it back to $10 support.


$TRX TRON Chart Looking Prime; Ready for a runThis one has been hard to predict, but I'm seeing some rumblings in the price movement that could be a sign of things to come. On this interval you can see the beautiful cup-and-handle set up + flagging jumps on the incline. I expect we'll see 750sats sooner rather than later.

Factom VS Bitcoin Breaking AboveFactom continues to rejected the uptrend trendline and today FCT/BTC finally broke and closed above the downtrend trendline which suggests the beginning of a correctional wave up or a trend reversal.
The upside move could be either strong a weak depending how price will react on the fist strong resistance at BTC 0.0038. If it will be broken with confidence the next wave up should result in a growth towards BTC 0.0055 are, which is the key resistance.
Although it is unlikely for the Factom to continue the downtrend, the worst case scenario could be the move down towards BTC 0.0025 support.
