Buy-signal

Edgeless Token Should Outperform BitcoinEdgeless token found the support at 5600 satoshi and started to move higher, breaking above the 200 Moving Average and the very strong resistance formed at 13k satoshi. Higher highs and higher lows pattern started to emerge suggesting that EDG/BTC could be planning to continue rising.
After breaking the 13k satoshi resistance, the price went back and this time rejected this level, which is now acting as a support. The upside momentum is there and it is very likely that price will move higher towards previously formed high near 40k satoshi. To be precise, there is a very strong resistance at 37k satoshi confirmed by two Fibonacci retracement levels. First is 88.6% and second is 227.2%, applied to the last corrective wave down.
While the upside potential is there, Edgeless might take some time before moving higher and could even test the uptrend trendline and/or the 200 Moving Average once again. In any case, the buying opportunity is there and only break below the 5600 satoshi support could invalidate bullish outlook.

Memetic / PepeCoin Higher Highs Memetic does look pretty awesome from the technical perspective, it has been bouncing off the 200 Moving Average for an extended period of time after which it broke above the $0.4 resistance and now there is clearly a higher highs, higher lows pattern.
After breaking above the $0.4 resistance price retraced back and rejected the uptrend trendline. Currently, it seems that MEME/USD is ready to continue the uptrend and a new all-time high should be just around the corner. The first target is seen at $2.5 where 161.8% Fibonacci retracement, applied to the latest corrective wave down. On a downside note, only break and close below the 200 Moving Average would invalidate bullish outlook.

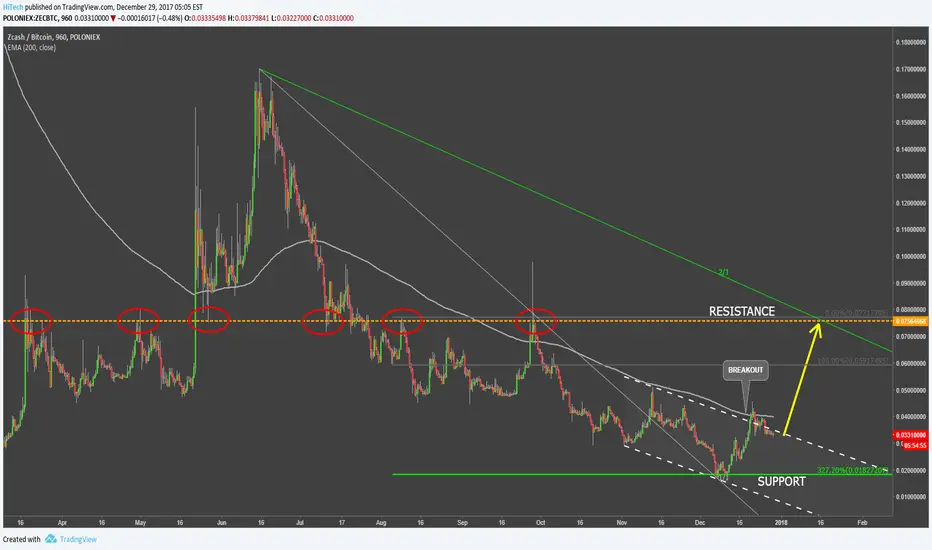
ZCash VS Bitcion Could Go Over 100% UPZCash found the support at 327.2% Fibonacci retracement, applied to the corrective wave up, after breaking the btc 0.75 support. After bouncing off the btc 0.02 psychological level, ZEC/BTC went higher and broke above the descending channel as well as 200 Moving Average.
This could indicate that price is ready to go higher, although it is too early to say it is reversing. The key resistance is at btc 0.075, which is the first upside target for the potential upcoming wave up. This is a key price for ZCash as it could indicate on the future trend. Only a break and close below the btc 0.018 could invalidate bullish outlook.
GBPJPY Potential Long SetupFX:GBPJPY
Buy Limit @150,800
sl: 150,200 (60pips)
tp: 152,600 (180pips)
1:3 risk:reward

Bitcoin: BTCUSD Next Buy Point: Folllow the ChartBitcoin Update Next Buy Point Follow the Chart
A reverse head and shoulders is forming with neckline at the
upper parallel. Next buy point comes only when neckline is crossed
on upside with stop 50 points lower - upside measurement implied
target is 8390 on any sustained break. The whole thing fails if
7717 - 7660 range also fails, for fall back to 7530, which must
hold today at all costs for bull case to stay good in near term.
So far this battle for the new high ground continues, the bulls
trying to grind down the bears at high altitude, and so far
they're....winning. The way this pattern develops determines
the day from here. It will likely take a while to play out yet -
we don't even need to second guess it here, really. It's tough
up here - that selling out of London first thing...was that
heavy weiight Goldman clients closing out longs from lower
down at the exact spot Jafari tagged at 8000 as the next high?
It was a big bad red candle, first for a long while...it's tough
up here.. .so we ait and simply react to the next signal. If it's
a break above the neckline we buy, as above. If it's a break
below 7660 we get stopped out for 130 points profit before
spreads. Not great, but...it's tough up here. If 7660 breaks it
means a test of 7530 - and if that should break it means the
damn thing has flipped right out of the freeezer again and
we're going to have to strart the chase all over again. Please no.
But it's Bitcoin. Anything can happen. (And If it does, we switch
back to shorting rallies back up the blue lines. Please no.
Like in Alien (new theme) we're watching a new life-form develop
on our screens in front of us. Intersting stuff, no? Please comment ffs!
Let the chart decide for us. And let the force be with you,
guide you, Luke. Trust the force!


EURUSD Corrective structure Another way I see it going will be in Idea updates! Thanks for looking! If your trade idea is similar post it in the comments, and I wish us luck!


kore buy signal Quick one here for ya
is over sold on most time frames but starting to gain strength and reset on the 30mins
ready to pop out wave 5 of a elliot set after completing waves 1-4
Buy under arround 17
Target 22-24


GBPNZD long2 target for you guys. if still move up can reach 3'rd target. no other than wait and see.


USD JPY buy signals hello Guys i buy this one
the price break the trend line and the support zone and the price above the cloud and and we have buy signals from MACD and stochastic
the target 50 pip
good luck

NZD CAD - BUY SETUPTrading idea and price prediction for (FX: NZD/CAD ) from trader Nika Lekishvili
www.tradingview.com ~ My Channel
GL !


EUR SEK * BUY SIGNAL
Trading idea and price prediction for (FX: EUR/SEK ) from trader Nika Lekishvili
www.tradingview.com ~ My Channel
GL !

AUD JPY ~ BUY FOR 30-35 PipsTrading idea and price prediction for (FX: AUD/JPY ) from trader Nika Lekishvili
www.tradingview.com ~ My Channel
GL !

USDCHF- Bullish Move UpOur RSI 80-20 Strategy triggered a trade. Below are the rules of the strategy:
Step One: Find the currency pair that is showing a high the last 50 candlesticks . (OR low depending on the trade)
Step Two: When we find 50 candle low, it needs to be coupled with RSI reading around 20 or lower. (If it’s a high it needs to be coupled with the RSI reading 80 or higher.)
Step Three: Wait for a second price (low candle) to close after the first one that we already identified.
Step Four: Wait for the price to head in the direction of the trade and wait for a candle to close above the first candle that you identified that was previous 50 candle low.
Step Five: Place Stop Loss-This strategy follows a 1 risk to 3 reward ratio entry/exit points.
