GBPAUD Will Go Up From Support! Long!
Here is our detailed technical review for GBPAUD.
Time Frame: 4h
Current Trend: Bullish
Sentiment: Oversold (based on 7-period RSI)
Forecast: Bullish
The market is on a crucial zone of demand 2.060.
The oversold market condition in a combination with key structure gives us a relatively strong bullish signal with goal 2.071 level.
P.S
We determine oversold/overbought condition with RSI indicator.
When it drops below 30 - the market is considered to be oversold.
When it bounces above 70 - the market is considered to be overbought.
Disclosure: I am part of Trade Nation's Influencer program and receive a monthly fee for using their TradingView charts in my analysis.
Like and subscribe and comment my ideas if you enjoy them!
Buy

SUPER - Getting ready for the super run- Price is trading near the resistance after forming higher high.
- it's highly likely that price will get rejected around the resistance and will form another higher high.
- this is an excellent opportunity for us to enter the trade.
Entry Price: 0.7322
Stop Loss: 0.5344
TP1: 0.8939
TP2: 1.0517
TP3: 1.2867
TP4: 1.6336
TP5: 2.2243
Max Leverage 5x.
Don't forget to keep stoploss.
Support us by Liking and following.
Thanks and Cheers!
GreenCrypto

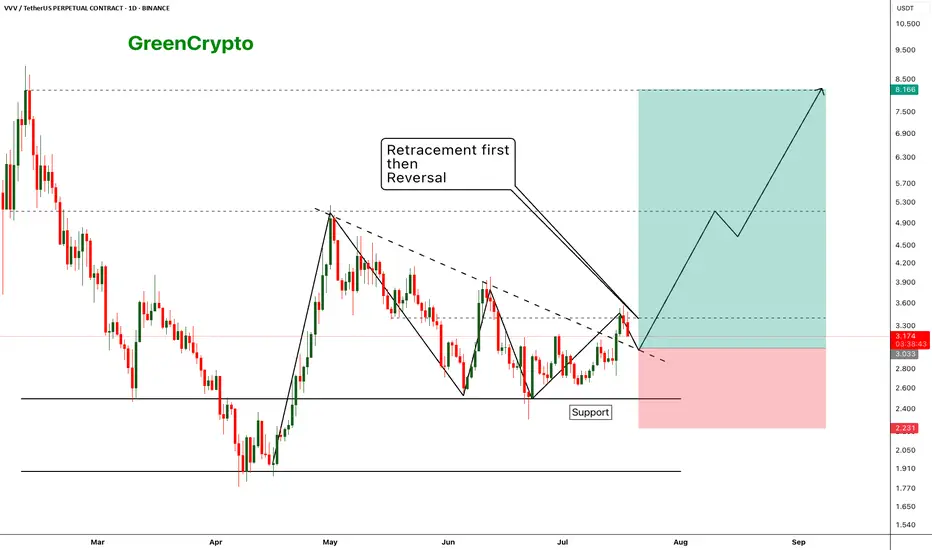
VVV - Expecting perfect reversal after the retracement- price has broken out from the resistance trendline and now we are seeing a retracement as expecting
- Price should hold the support (previous resistance) and reverse from the suppport zone.
- we can enter our trade once the retracement completed
Entry Price: 3.033
Stop Loss: 2.231
TP1: 3.411
TP2: 4.037
TP3: 4.851
TP4: 6.360
TP5: 8.028
Max Leverage 5x.
Don't forget to keep stoploss.
Cheers!
GreenCrypto
Gold prices fall in the short term – What's next?Hello everyone, what’s your take on gold?
Today, gold continues to attract short-term selling pressure as USD buying momentum returns and expectations for Fed rate cuts diminish. On the other hand, an overall positive risk sentiment is also seen as another factor weighing on the precious metal.
At the time of writing, gold is trading around the EMA 34 and 89 near 3,336 USD. With no major updates expected, the market is likely to remain steady throughout the day.
From a technical perspective, the bearish trend persists, with prices capped below the trendline. A series of lower highs and lower lows could push XAUUSD to retest deeper levels, potentially reaching the 3,300 USD mark. However, lingering trade uncertainties may limit losses for this safe-haven asset.
This is just my view on the market, not financial advice.

Gold's Short-Term Decline: What's Next?Hello everyone, what do you think about gold?
Today, gold continues its short-term downtrend. After new data was released at the end of yesterday’s trading session, the USD rose by 0.3%, and U.S. Treasury yields also increased, reducing the appeal of gold. Additionally, the latest unemployment claims data shows improvement in the U.S. economy, which has contributed to the drop in the precious metal.
As of writing, gold is trading around the EMA 34, 89 levels at 3,336 USD. With the recent news, the market is expected to maintain its current stance throughout the day, as no new significant updates are expected.
From a technical standpoint, the downtrend remains in place, with prices continuing to be capped below the trendline. The series of lower highs and lows could likely lead XAUUSD to test lower levels, with the possibility of reaching the 3,300 USD mark.
What do you think about the price of gold today? Let us know in the comments!
ETHUSD Is Going Up! Buy!
Please, check our technical outlook for ETHUSD.
Time Frame: 12h
Current Trend: Bullish
Sentiment: Oversold (based on 7-period RSI)
Forecast: Bullish
The market is approaching a key horizontal level 3,011.53.
Considering the today's price action, probabilities will be high to see a movement to 3,240.64.
P.S
The term oversold refers to a condition where an asset has traded lower in price and has the potential for a price bounce.
Overbought refers to market scenarios where the instrument is traded considerably higher than its fair value. Overvaluation is caused by market sentiments when there is positive news.
Disclosure: I am part of Trade Nation's Influencer program and receive a monthly fee for using their TradingView charts in my analysis.
Like and subscribe and comment my ideas if you enjoy them!

USD/JPY(20250718)Today's AnalysisMarket news:
① Kugler: It is appropriate to keep the interest rate policy stable for "a while".
② Daly: Whether to cut interest rates in July or September is not the most critical.
③ Bostic: It may be difficult to cut interest rates in the short term.
Technical analysis:
Today's buying and selling boundaries:
148.45
Support and resistance levels:
149.80
149.30
148.97
147.93
147.61
147.10
Trading strategy:
If the price breaks through 148.97, consider buying in, the first target price is 149.30
If the price breaks through 148.45, consider selling in, the first target price is 147.93

Latest Gold Price Update TodayGold prices today continue to maintain a short-term uptrend, driven by trade tensions and U.S. inflation data.
The weakening of the USD and the drop in U.S. Treasury yields have increased gold's appeal as a safe-haven asset. The trade tensions between the U.S. and the EU, along with new tariff measures, further boost the demand for gold.
Additionally, the U.S. PPI for June rose by 2.3%, lower than the forecast and May’s increase, suggesting that inflation could decrease in the future. The market expects the Fed to cut interest rates in September, weakening the USD and supporting gold's uptrend.
With factors like trade tensions, a weaker USD, and positive inflation data, gold prices may continue to rise. Investors need to closely monitor these factors to devise an appropriate strategy.

Sweep On levels and Confirmation of Bullish pressure! Now that we have a sweep on levels we are looking for bullish pressure to continue. They have closed the 4Hr bullish. Being that it is Friday keeping expectation low cause price can break out and push hard or it can end up being Rotational. I feel there is a move here. We just have to wait for it to line up inside of the killzone. NOFOMO Mayn!

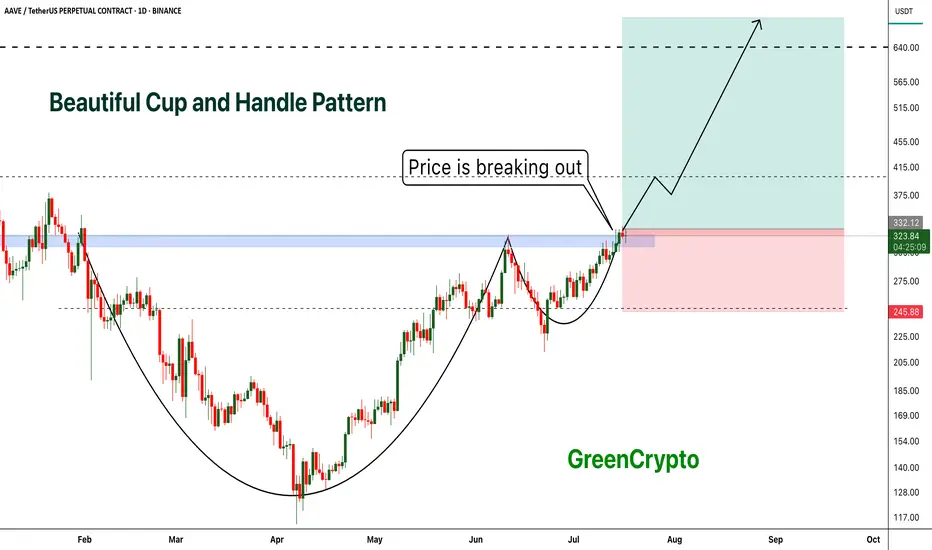
AAVE - Beautiful Cup and Handle Pattern Breakout- AAVE is breaking out from cup and handle pattern finally
- Cup and handle pattern breakout usually results in perfect trend continuation
- A huge long trade opportunity from this
Entry Price: 335 Above
Stop Loss: 245
TP1: 381.89
TP2: 429.16
TP3: 525.94
TP4: 628.78
TP5: 712.89
Max Leverage 5x:
Don't forget to keep stoploss
Cheers
GreenCrypto
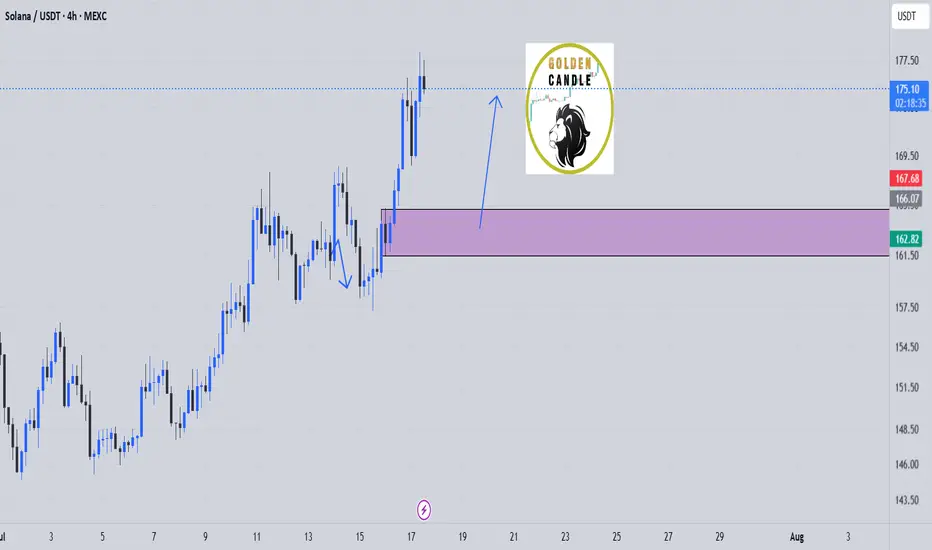
sol buy midterm"🌟 Welcome to Golden Candle! 🌟
We're a team of 📈 passionate traders 📉 who love sharing our 🔍 technical analysis insights 🔎 with the TradingView community. 🌎
Our goal is to provide 💡 valuable perspectives 💡 on market trends and patterns, but 🚫 please note that our analyses are not intended as buy or sell recommendations. 🚫
Instead, they reflect our own 💭 personal attitudes and thoughts. 💭
Follow along and 📚 learn 📚 from our analyses! 📊💡"
GOLD Is Very Bullish! Buy!
Please, check our technical outlook for GOLD.
Time Frame: 9h
Current Trend: Bullish
Sentiment: Oversold (based on 7-period RSI)
Forecast: Bullish
The market is approaching a key horizontal level 3,328.03.
Considering the today's price action, probabilities will be high to see a movement to 3,388.97.
P.S
Overbought describes a period of time where there has been a significant and consistent upward move in price over a period of time without much pullback.
Disclosure: I am part of Trade Nation's Influencer program and receive a monthly fee for using their TradingView charts in my analysis.
Like and subscribe and comment my ideas if you enjoy them!

EURJPY Is Going Up! Long!
Here is our detailed technical review for EURJPY.
Time Frame: 7h
Current Trend: Bullish
Sentiment: Oversold (based on 7-period RSI)
Forecast: Bullish
The market is approaching a significant support area 172.355.
The underlined horizontal cluster clearly indicates a highly probable bullish movement with target 174.222 level.
P.S
Please, note that an oversold/overbought condition can last for a long time, and therefore being oversold/overbought doesn't mean a price rally will come soon, or at all.
Disclosure: I am part of Trade Nation's Influencer program and receive a monthly fee for using their TradingView charts in my analysis.
Like and subscribe and comment my ideas if you enjoy them!

AUDCHF Will Grow! Buy!
Take a look at our analysis for AUDCHF.
Time Frame: 1D
Current Trend: Bullish
Sentiment: Oversold (based on 7-period RSI)
Forecast: Bullish
The market is on a crucial zone of demand 0.519.
The oversold market condition in a combination with key structure gives us a relatively strong bullish signal with goal 0.534 level.
P.S
The term oversold refers to a condition where an asset has traded lower in price and has the potential for a price bounce.
Overbought refers to market scenarios where the instrument is traded considerably higher than its fair value. Overvaluation is caused by market sentiments when there is positive news.
Disclosure: I am part of Trade Nation's Influencer program and receive a monthly fee for using their TradingView charts in my analysis.
Like and subscribe and comment my ideas if you enjoy them!

GBPNZD Is Bullish! Buy!
Here is our detailed technical review for GBPNZD.
Time Frame: 2h
Current Trend: Bullish
Sentiment: Oversold (based on 7-period RSI)
Forecast: Bullish
The market is approaching a significant support area 2.254.
The underlined horizontal cluster clearly indicates a highly probable bullish movement with target 2.262 level.
P.S
We determine oversold/overbought condition with RSI indicator.
When it drops below 30 - the market is considered to be oversold.
When it bounces above 70 - the market is considered to be overbought.
Disclosure: I am part of Trade Nation's Influencer program and receive a monthly fee for using their TradingView charts in my analysis.
Like and subscribe and comment my ideas if you enjoy them!

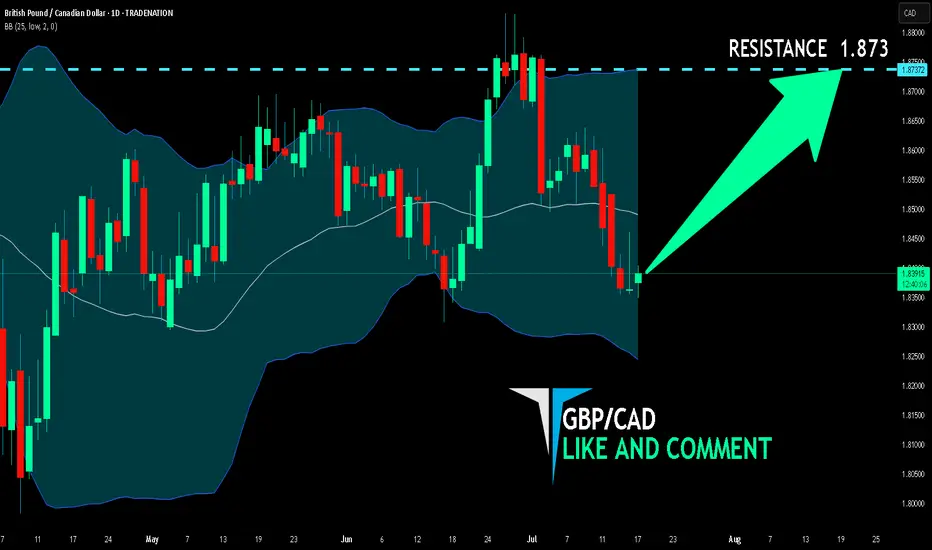
GBP/CAD BULLS ARE GAINING STRENGTH|LONG
Hello, Friends!
We are now examining the GBP/CAD pair and we can see that the pair is going down locally while also being in a downtrend on the 1W TF. But there is also a powerful signal from the BB lower band being nearby indicating that the pair is oversold so we can go long from the support line below and a target at 1.873 level.
Disclosure: I am part of Trade Nation's Influencer program and receive a monthly fee for using their TradingView charts in my analysis.
✅LIKE AND COMMENT MY IDEAS✅
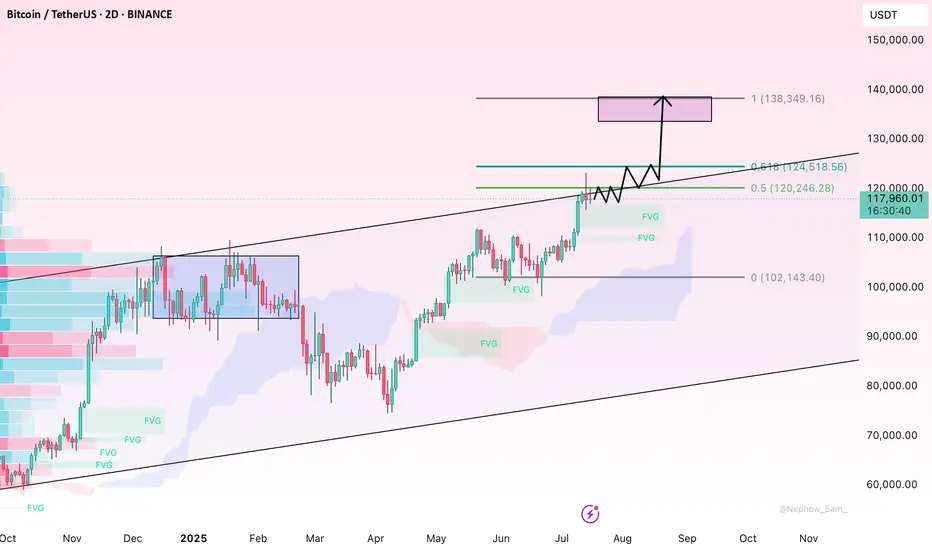
BTC Nears $120K – Pullback Risk or Breakout Launchpad?Bitcoin has rallied strongly after breaking its multi-week consolidation, now hovering just under the key psychological and historical resistance at $120K. The daily chart shows price floating above the 20EMA, with no signs of distribution—yet. However, the dense liquidity pocket between $110K–$114K remains a magnet in case of a technical pullback.
If bulls defend $118K and price cleanly breaks above $121K with strong volume, the next target lies in the $125K–$128K zone. Spot ETF inflows remain healthy, and any dovish pivot from the Fed could set off another crypto-wide bull wave.
Twitter Speculation sent Gold FLIP Floppin!So yesterday there was a few Tweets that caused chaos in the market. Fed Rumors about Powell getting fired. Im still looking for my long. Waiting for a sweep on levels before getting active.

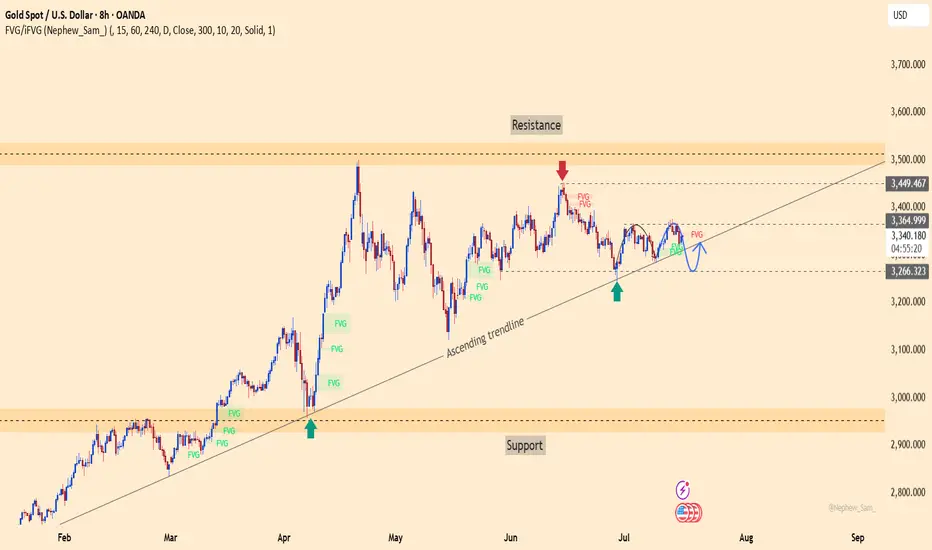
xauusd – is gold coiling up for a breakout?After multiple retests of the ascending trendline since March, gold (XAUUSD) continues to hold a solid bullish structure. While it hasn’t decisively broken through the 3,366 resistance, price action suggests that buyers are still in control. The repeated appearance of FVG zones signals smart money accumulation beneath the surface.
On the news front, U.S. PPI data came in at a 0.2% increase — exactly in line with expectations. This neutral result hasn’t given the USD a strong push, which may allow gold to maintain or even inch higher in the short term.
As long as the 3,265 support zone holds, the path remains open for a move toward the 3,449 target area. This might be the final consolidation before a powerful breakout. The question is: are you ready to ride the next leg up?
EURUSD – Weakness emerges at descending channel resistanceEURUSD remains within a well-defined descending channel and was recently rejected at the upper trendline – a key dynamic resistance zone. Price action shows the recovery is limited around 1.16600, with multiple FVG (Fair Value Gap) zones reinforcing the potential for further downside.
On the news front, the euro remains under pressure as Eurozone inflation data brought no surprises, while the US dollar is supported by June’s PPI rising exactly as expected at 0.2%. This combination leaves EURUSD with little momentum to break higher, making a move back toward the 1.15300 support area a scenario to watch.
If the price fails to break above 1.16600 and forms a lower high, the bearish trend will be further confirmed. Keep an eye on price behavior around the FVG zones to identify optimal entry points.

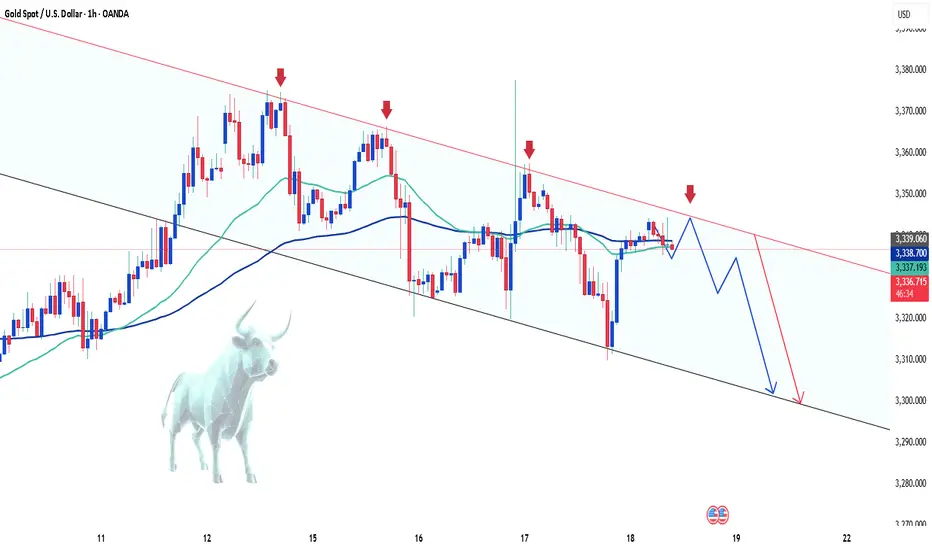
Gold's Downtrend: Is a Breakout Imminent?Hello traders, what do you think about the gold trend?
Let's set aside the news factors for now and focus on short-term technical analysis with a bearish outlook.
In the current technical picture, gold continues to trade below the trendline, lacking upward momentum, forming a descending wedge pattern. The behavior around the convergence of EMA 34 and 89 also indicates that sellers still control the market.
A sell strategy is favored, with attention to the support zone around 3,315 – 3,320 USD. If this level breaks, stronger sell-offs are likely to follow.
What do you think about gold’s price today? Leave your thoughts in the comments below!
Good luck!

FET - Perfect trade for beginner- FET is breaking out from the flag pattern and we have clear and confirmed breakout
- most of the like flag pattern breakout succeeds, this gives a high confidence trade
Entry Price: 0.775 (current price)
Stop Loss: 0.5307
TP1: 0.9072
TP2: 1.1495
TP3: 1.3791
TP4: 1.7927
TP5: 2.1468
Max Leverage 5x
Don't forget to keep stoploss
Cheers
GreenCrypto

UAL United Airlines Holdings Options Ahead of EarningsIf you haven`t exited UAL before the recent selloff:
Now analyzing the options chain and the chart patterns of UAL United Airlines Holdings prior to the earnings report this week,
I would consider purchasing the 92.5usd strike price Calls with
an expiration date of 2025-9-19,
for a premium of approximately $5.12.
If these options prove to be profitable prior to the earnings release, I would sell at least half of them.
