AUDUSD Potential UpsidesHey Traders, in today's trading session we are monitoring AUDUSD for a buying opportunity around 0.64600 zone, AUDUSD is trading in an uptrend and currently is in a correction phase in which it is approaching the trend at 0.64600 support and resistance area.
Trade safe, Joe.
Buy

EURUSD - Looking for the RTLooking for the RT on the upper supply zone, long term target for EURUSD is 1.200-1.2200. However, on RT we can potentially expect a larger pull back but will analyse PA.

XAUUSD – Clear Sideways Movement in a Narrow Price ChannelXAUUSD is moving within a parallel price channel, fluctuating between the 3,320–3,345 zone. Both the EMA 34 and EMA 89 are running flat and close together, indicating a balanced market with no strong momentum in either direction.
Recent highs and lows have formed within a narrow range, reflecting indecision from both buyers and sellers. The latest bounce also stalled at the channel resistance, lacking the strength to break out.
As long as price remains below 3,345 and above 3,320, the sideways trend is likely to continue. During this phase, a range-trading strategy is preferred – selling near the top, buying near the bottom – while waiting for a clear breakout to determine the next directional move.

USDCHF Will Go Up From Support! Buy!
Take a look at our analysis for USDCHF.
Time Frame: 12h
Current Trend: Bullish
Sentiment: Oversold (based on 7-period RSI)
Forecast: Bullish
The market is on a crucial zone of demand 0.794.
The oversold market condition in a combination with key structure gives us a relatively strong bullish signal with goal 0.809 level.
P.S
The term oversold refers to a condition where an asset has traded lower in price and has the potential for a price bounce.
Overbought refers to market scenarios where the instrument is traded considerably higher than its fair value. Overvaluation is caused by market sentiments when there is positive news.
Disclosure: I am part of Trade Nation's Influencer program and receive a monthly fee for using their TradingView charts in my analysis.
Like and subscribe and comment my ideas if you enjoy them!

GBPNZD Will Go Up! Long!
Here is our detailed technical review for GBPNZD.
Time Frame: 9h
Current Trend: Bullish
Sentiment: Oversold (based on 7-period RSI)
Forecast: Bullish
The market is trading around a solid horizontal structure 2.264.
The above observations make me that the market will inevitably achieve 2.285 level.
P.S
Overbought describes a period of time where there has been a significant and consistent upward move in price over a period of time without much pullback.
Disclosure: I am part of Trade Nation's Influencer program and receive a monthly fee for using their TradingView charts in my analysis.
Like and subscribe and comment my ideas if you enjoy them!

GOLD BUY M15 Gold (XAU/USD) 15-Minute Chart Analysis – July 7, 2025
Trade Setup: The chart shows a bullish trade setup based on a potential reversal from a "Weak Low" support area around 3304. After forming a BOS (Break of Structure) and a small consolidation (highlighted box), price is expected to move higher.
Entry:
Long position initiated slightly above the consolidation zone.
Stop Loss (SL):
Set at 3304, just below the recent weak low support.
Target (TP):
Final target at 3326, where a key resistance level lies.
Key Levels:
Support Zone: 3304 (Weak Low)
Resistance Levels:
3317.5
3222.9
3326.2 (Final Target)
Market Structure Notes:
CHoCH (Change of Character) indicates potential shift to bullish momentum.
Price is expected to form higher highs and higher lows on its way to the target.

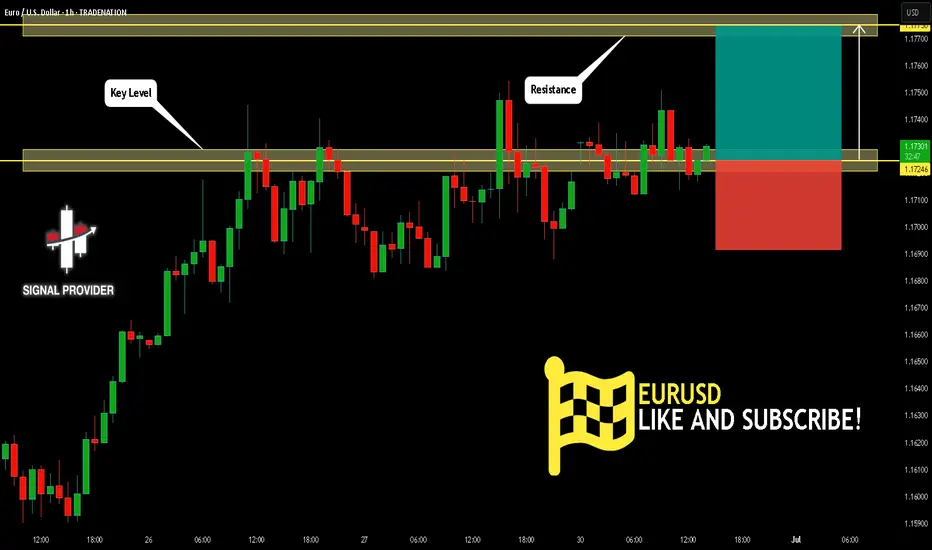
EURUSD Will Go Higher From Support! Long!
Take a look at our analysis for EURUSD.
Time Frame: 1h
Current Trend: Bullish
Sentiment: Oversold (based on 7-period RSI)
Forecast: Bullish
The market is on a crucial zone of demand 1.172.
The oversold market condition in a combination with key structure gives us a relatively strong bullish signal with goal 1.177 level.
P.S
We determine oversold/overbought condition with RSI indicator.
When it drops below 30 - the market is considered to be oversold.
When it bounces above 70 - the market is considered to be overbought.
Disclosure: I am part of Trade Nation's Influencer program and receive a monthly fee for using their TradingView charts in my analysis.
Like and subscribe and comment my ideas if you enjoy them!
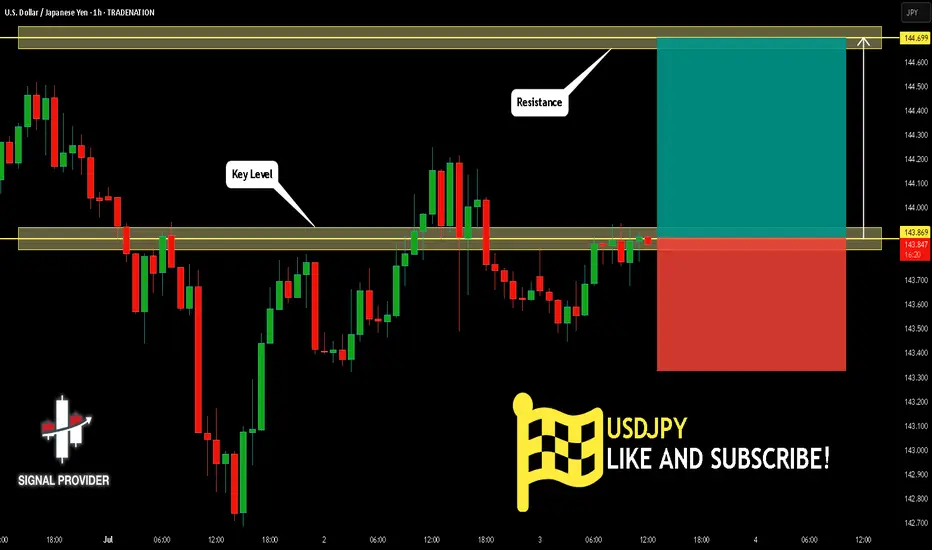
USDJPY Is Bullish! Buy!
Take a look at our analysis for USDJPY.
Time Frame: 1h
Current Trend: Bullish
Sentiment: Oversold (based on 7-period RSI)
Forecast: Bullish
The market is on a crucial zone of demand 143.869.
The oversold market condition in a combination with key structure gives us a relatively strong bullish signal with goal 144.699 level.
P.S
We determine oversold/overbought condition with RSI indicator.
When it drops below 30 - the market is considered to be oversold.
When it bounces above 70 - the market is considered to be overbought.
Disclosure: I am part of Trade Nation's Influencer program and receive a monthly fee for using their TradingView charts in my analysis.
Like and subscribe and comment my ideas if you enjoy them!
GOLD BEST PLACE TO BUY FROM|LONG
GOLD SIGNAL
Trade Direction: long
Entry Level: 3,312.57
Target Level: 3,353.45
Stop Loss: 3,285.24
RISK PROFILE
Risk level: medium
Suggested risk: 1%
Timeframe: 4h
Disclosure: I am part of Trade Nation's Influencer program and receive a monthly fee for using their TradingView charts in my analysis.
✅LIKE AND COMMENT MY IDEAS✅

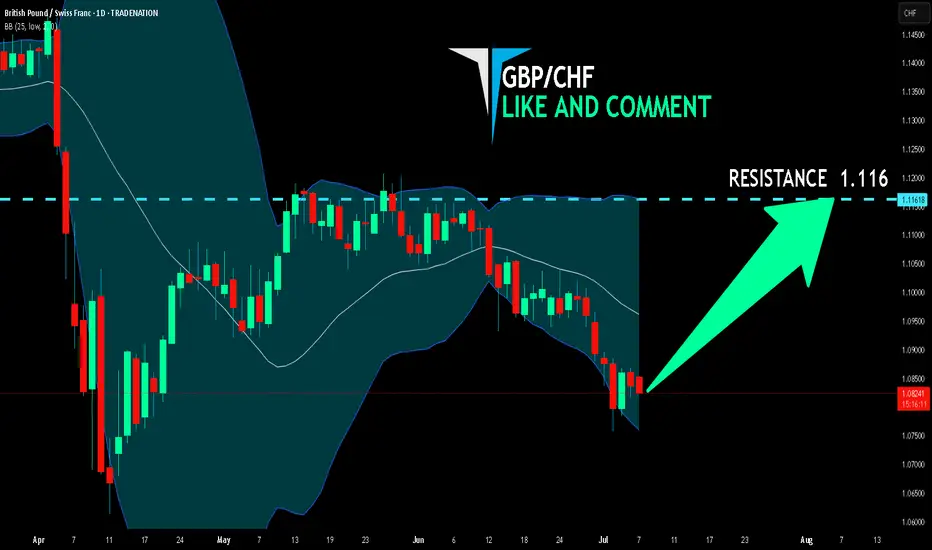
GBP/CHF LONG FROM SUPPORT
Hello, Friends!
GBP/CHF pair is in the downtrend because previous week’s candle is red, while the price is obviously falling on the 1D timeframe. And after the retest of the support line below I believe we will see a move up towards the target above at 1.116 because the pair oversold due to its proximity to the lower BB band and a bullish correction is likely.
Disclosure: I am part of Trade Nation's Influencer program and receive a monthly fee for using their TradingView charts in my analysis.
✅LIKE AND COMMENT MY IDEAS✅
US30 Will Move Higher! Buy!
Take a look at our analysis for US30.
Time Frame: 1h
Current Trend: Bullish
Sentiment: Oversold (based on 7-period RSI)
Forecast: Bullish
The market is testing a major horizontal structure 44,556.0.
Taking into consideration the structure & trend analysis, I believe that the market will reach 44,867.4 level soon.
P.S
Please, note that an oversold/overbought condition can last for a long time, and therefore being oversold/overbought doesn't mean a price rally will come soon, or at all.
Disclosure: I am part of Trade Nation's Influencer program and receive a monthly fee for using their TradingView charts in my analysis.
Like and subscribe and comment my ideas if you enjoy them!

EURNZD Is Bullish! Long!
Please, check our technical outlook for EURNZD.
Time Frame: 9h
Current Trend: Bullish
Sentiment: Oversold (based on 7-period RSI)
Forecast: Bullish
The market is approaching a key horizontal level 1.944.
Considering the today's price action, probabilities will be high to see a movement to 1.965.
P.S
The term oversold refers to a condition where an asset has traded lower in price and has the potential for a price bounce.
Overbought refers to market scenarios where the instrument is traded considerably higher than its fair value. Overvaluation is caused by market sentiments when there is positive news.
Disclosure: I am part of Trade Nation's Influencer program and receive a monthly fee for using their TradingView charts in my analysis.
Like and subscribe and comment my ideas if you enjoy them!

NG1! SENDS CLEAR BULLISH SIGNALS|LONG
NG1! SIGNAL
Trade Direction: long
Entry Level: 3.387
Target Level: 3.635
Stop Loss: 3.222
RISK PROFILE
Risk level: medium
Suggested risk: 1%
Timeframe: 9h
Disclosure: I am part of Trade Nation's Influencer program and receive a monthly fee for using their TradingView charts in my analysis.
✅LIKE AND COMMENT MY IDEAS✅

SWING IDEA - AJANTA PHARMAAjanta Pharma , a mid-cap pharma player with strong branded generics in ophthalmology, dermatology, and cardiology, is showing a compelling swing trade setup backed by a high-probability technical breakout.
Reasons are listed below :
Bullish engulfing candle on the weekly timeframe, indicating reversal strength
2,500 zone acting as a crucial support
Holding above 0.382 Fibonacci retracement level , suggesting healthy correction
Price trading above 50 & 200 EMA on the weekly chart – long-term strength intact
Breakout from narrow consolidation near the 50-week EMA
Target - 3080 // 3400
Stoploss - weekly close below 2415
DISCLAIMER -
Decisions to buy, sell, hold or trade in securities, commodities and other investments involve risk and are best made based on the advice of qualified financial professionals. Any trading in securities or other investments involves a risk of substantial losses. The practice of "Day Trading" involves particularly high risks and can cause you to lose substantial sums of money. Before undertaking any trading program, you should consult a qualified financial professional. Please consider carefully whether such trading is suitable for you in light of your financial condition and ability to bear financial risks. Under no circumstances shall we be liable for any loss or damage you or anyone else incurs as a result of any trading or investment activity that you or anyone else engages in based on any information or material you receive through TradingView or our services.
@visionary.growth.insights

GBPJPY Breakout and Potential RetraceHey Traders, in the coming week we are monitoring GBPJPY for a buying opportunity around 196.600 zone, GBPJPY was trading in a downtrend and successfully managed to break it out. Currently is in a correction phase in which it is approaching the retrace area at 196.600 support and resistance zone.
Trade safe, Joe.

CADCHF Is Going Up! Long!
Take a look at our analysis for CADCHF.
Time Frame: 1h
Current Trend: Bullish
Sentiment: Oversold (based on 7-period RSI)
Forecast: Bullish
The market is on a crucial zone of demand 0.583.
The oversold market condition in a combination with key structure gives us a relatively strong bullish signal with goal 0.585 level.
P.S
Please, note that an oversold/overbought condition can last for a long time, and therefore being oversold/overbought doesn't mean a price rally will come soon, or at all.
Disclosure: I am part of Trade Nation's Influencer program and receive a monthly fee for using their TradingView charts in my analysis.
Like and subscribe and comment my ideas if you enjoy them!

Gold Price Maintains Bullish MomentumGold is currently trading within a converging wedge pattern, following a strong rebound from the recent bottom near 3,210 USD.
If price holds above the 3,276 USD support zone and shows bullish confirmation, the next target will be a breakout above the descending trendline, aiming for the 3,359 USD resistance zone — a key level to confirm the continuation of the uptrend.
From a fundamental perspective, the weakening USD — driven by expectations of cautious Fed rate cuts — combined with lingering geopolitical risks and strong central bank demand (over 1,000 tons annually), continues to provide solid support for gold.
Overall Trend: Bullish
Confirmation Condition: Price holds above 3,276 USD and breaks the upper wedge
Mid-term Target: 3,359 to 3,400 USD

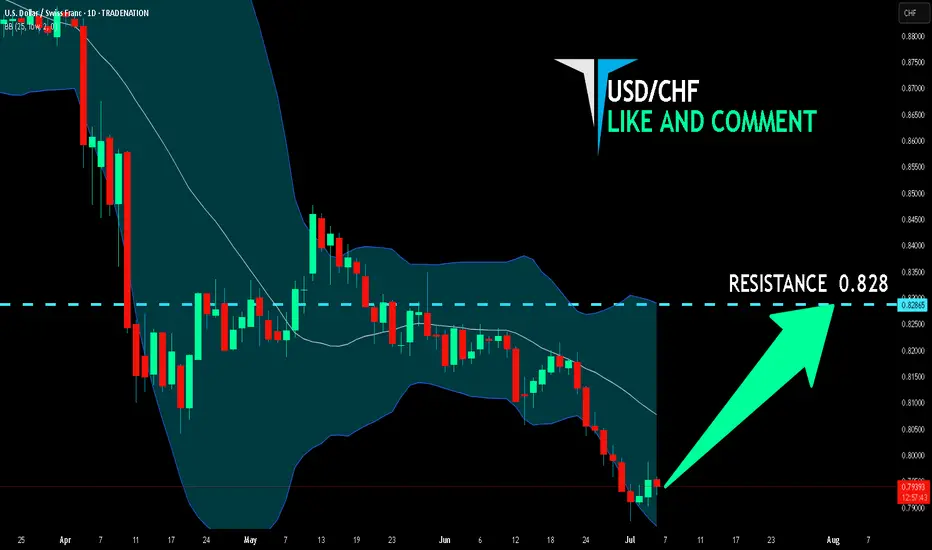
USD/CHF BULLS WILL DOMINATE THE MARKET|LONG
Hello, Friends!
Bullish trend on USD/CHF, defined by the green colour of the last week candle combined with the fact the pair is oversold based on the BB lower band proximity, makes me expect a bullish rebound from the support line below and a retest of the local target above at 0.828.
Disclosure: I am part of Trade Nation's Influencer program and receive a monthly fee for using their TradingView charts in my analysis.
✅LIKE AND COMMENT MY IDEAS✅
VKTX: Unusual Options Flow & a Breakthrough Weight-Loss DrugIf you haven`t bought CKTX before the recent rally:
Now you need to know that Viking Therapeutics (VKTX) is a speculative biotech stock in the GLP-1/GIP agonist space, aiming to challenge market leaders like Eli Lilly and Novo Nordisk. Recently, I noticed unusual options flow — specifically, Jan 16, 2026 $60 strike calls
Key Bullish Points
1) Riding the Obesity Drug Boom
VK2735 is Viking’s dual agonist candidate showing promising early weight-loss efficacy, with potential overlap benefits in NASH (liver disease). The obesity treatment space is expected to exceed $100B by 2030—huge upside if their trials continue positively.
2) Options Flow Tells a Story
Those Jan 2026 $60 calls caught my attention precisely because the stock currently trades in the mid-$60s. These aren’t cheap lottery plays—they’re strategically timed wrt trial readouts, partnerships, or acquisition interest. Essentially, someone anticipates meaningful upside in the near future.
3) Descending Wedge — Chart Looks Bullish
VKTX peaked near $100, then pulled back into a well-defined descending wedge. If it breaks out above $70–$72 with volume, that could kick off a classic reversal trade.
Smart Money Options Flow — Near-Term Bet:
Recently, I spotted unusual open interest in $60 strike calls expiring Jan 16, 2026 — that’s only about 7 months away.
This means someone is positioning for a big upside move relatively soon, likely betting on positive Phase 2b/3 data, a partnership deal, or even buyout chatter within the next few quarters.
Short-dated, out-of-the-money call flow like this often hints at near-term news — not just a long-dated hedge.

KWEB: China’s Internet Sector - AI Catch-Up and Cheap ValuationsChina’s internet and tech stocks have been hammered for years — regulatory crackdowns, slowing growth fears, and geopolitical tension have crushed sentiment. But as investors know, the best opportunities often hide in what everyone hates.
Enter KWEB, the KraneShares CSI China Internet ETF.
It’s a diversified, liquid way to play a bounce in major names like Alibaba, Tencent, JD .com, Baidu, Meituan and PDD.
Here’s why I think the risk/reward looks compelling now — especially if you believe in AI closing the gap.
Key Bullish Points:
1) Valuations at Rock-Bottom
Many big China internet stocks are still trading at single-digit P/E ratios, even as their cash flows recover. Compared to U.S. big tech trading at 30–50x, this is a huge valuation gap.
Regulatory fears seem largely priced in — Beijing wants growth, not stagnation, and some policies are easing.
2) China’s AI Push — Just “Months Behind”
Jansen Whang recently argued that China’s generative AI development is only “months behind” the U.S. Players like Baidu, Alibaba Cloud, Tencent, and SenseTime are all racing to launch new LLMs and integrated AI tools.
If you believe the gap closes, Chinese platforms could see a major earnings rebound as they roll out AI upgrades across search, cloud, e-commerce and social media.
3) Sentiment So Bad, It’s Good
When the headlines scream “China is uninvestable,” that’s often when big mean reversion trades set up. Even a small policy pivot, stimulus plan, or positive AI news cycle can spark a sharp rally.
KWEB is one of the cleanest ways to express this view because it holds a diversified basket — you don’t have to pick a single winner.

LCID: Could a Saudi Buyout Send This EV Stock Back to $10?If you haven`t sold LCID before the previous earnings:
Now you need to know that Lucid Motors (LCID) is one of the most polarizing EV stocks in the market — but it’s also one of the most interesting speculative turnarounds. Yes, the company faces production challenges, cash burn, and fierce competition from Tesla, BYD, and legacy automakers. But it has some unique wildcards that most other EV startups don’t:
1) The “Musk Factor”
Musk’s public comments about Lucid being “basically controlled by the Saudis” and that they make better-looking cars than Tesla might sound like trolling, but they highlight a real truth: Lucid isn’t just another budget EV player — it’s positioned as a luxury rival with design appeal that matters to high-end buyers.
2) Saudi PIF Is Deep In — Valuation Floor
The Saudi sovereign wealth fund has put billions into LCID already — and now owns around 60%+ of the shares. They’ve made no secret of their plans to expand the kingdom’s domestic EV production and see Lucid as a flagship partner.
Rumors have swirled for years about a possible full buyout to bring Lucid fully under the PIF umbrella — or merge it with other Middle East EV initiatives like the Ceer brand. Any credible news here could double or triple the stock overnight from these depressed levels.
3) Gravity SUV & Product Pipeline
The Lucid Air remains one of the few luxury EVs that truly competes with Tesla’s Model S in both design and range. The upcoming Gravity SUV could be the next big catalyst, especially as the luxury SUV segment has fatter margins and huge global demand.
Meanwhile, the new AMP-2 factory in Saudi Arabia will help Lucid localize production, get tax incentives, and serve the Middle East and Europe more cost-effectively.
4) Technical Setup: Double Bottom Pattern
Here’s what really makes this setup tradable: LCID is showing a clear double bottom on the daily chart around the $2–$2.20 zone. The stock tested that level twice and bounced, forming a W-shaped base that can signal a reversal.
Disclosure: I am part of Trade Nation's Influencer program and receive a monthly fee for using their TradingView charts in my analysis.

Why IonQ (IONQ) Could Be the NVDA of Quantum ComputingIf you haven`t bought IONQ before the rally:
Now you need to know that IonQ isn’t just another speculative quantum stock — The company is building a robust ecosystem around its best‑in‑class trapped‑ion architecture and targeting fault‑tolerant, networked quantum systems. With record bookings, major acquisitions, and a strong balance sheet, IonQ could emerge as the NVIDIA equivalent for quantum infrastructure.
Key Bullish Arguments
1) Superior Quantum Tech – Trapped‑Ion Advantage
IonQ’s trapped-ion processors boast 99.9% two-qubit fidelity, demonstrating higher accuracy and scalability than superconducting alternatives
These systems also operate at room temperature, meaning simpler deployment and lower costs
2) Ecosystem Strategy & Acquisitions
The $1.08B acquisition of Oxford Ionics (expected close in 2025) expands IonQ’s qubit control tech, pushing toward planned 80,000 logical‑qubit systems by decade’s end
Combined with ID Quantique and Lightsynq, IonQ is building a full-stack quantum and networking offering
3) Strong Revenue Growth & Cash Runway
Revenue soared from $22M in 2023 to $43.1M in 2024, with bookings of $95.6M
. Q1 2025 saw $7.6M revenue and EPS –$0.14, beating expectations; cash reserves near $697M provide years of runway
4) Real Commercial Deployments
IonQ sold its Forte Enterprise quantum system to EPB ($22M deal) for hybrid compute and networking, marking real-world commercial applications
5) AI & Quantum Synergy
Involvement in NVIDIA’s Quantum Day and hybrid quantum‑classical AI demos (e.g., blood pump simulation with Ansys, ~12 % faster) indicates strategic synergy and positions IonQ as a critical piece in the future AI stack
Recent Catalysts:
Texas Quantum Initiative passes – positions IonQ at forefront of U.S. state-backed innovation
Oxford Ionics acquisition pending – major expansion in qubit scale & tech
Barron’s analyst buys – industry analysts see long-term potential; IonQ among top quantum picks
Broader quantum optimism – McKinsey & Morgan Stanley forecasts highlight synergy between quantum and AI, benefiting IonQ

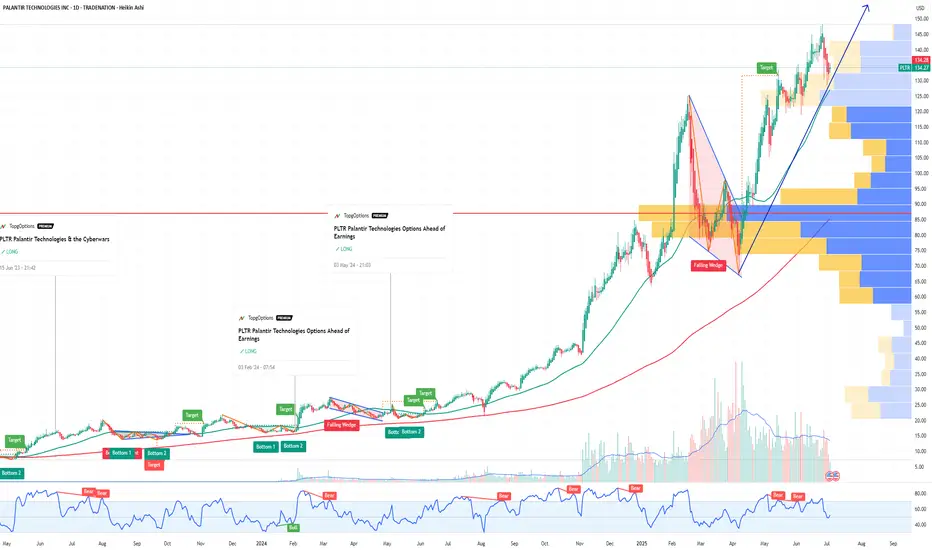
Why Palantir (PLTR) Could Be the NVDA of Government AI If you haven`t bought PLTR before the massive rally:
Palantir Technologies (PLTR) is proving it’s more than just another AI hype play — it’s becoming a core piece of the secure AI infrastructure for governments and large enterprises worldwide.
Key Bullish Arguments
1) Strong Government Moat
PLTR’s deep relationship with the U.S. government, NATO, and allies provides sticky, long-term revenue streams. In an age of geopolitical tension, this is exactly the type of mission-critical AI spending that stays funded.
2) Expanding Commercial Footprint
The commercial segment is no longer a side project. Palantir’s Foundry and Apollo platforms help enterprises deploy AI at scale — securely, in-house, and without sending sensitive data to open systems. Recent deals in healthcare, energy, and critical infrastructure show they’re broadening their customer base.
3) Profitability & Balance Sheet
Palantir is GAAP profitable for six consecutive quarters, with strong free cash flow and zero debt. For a growth stock in AI, this gives it rare staying power if macro conditions tighten.
4) Technical Strength
The stock broke out above ~$125–$130 support and is now testing key resistance in the $140–$148 range. Weekly momentum remains bullish, and institutional accumulation (A/D line) remains strong.
5) AI Tailwinds Remain
While the general AI trade has cooled for some names, PLTR’s unique moat in secure and domain-specific AI makes it more defensible than generic “AI SaaS” stocks. New contracts or AI platform updates could reignite momentum this summer.
Possible Summer Catalysts
New multi-year government deals — especially in defense and cybersecurity.
Major commercial partnerships — especially in healthcare or energy.
AI platform upgrades — more integrations with LLMs or domain-specific AI.
Inclusion in AI-focused ETFs — or further index rebalancing inflows.
Disclosure: I am part of Trade Nation's Influencer program and receive a monthly fee for using their TradingView charts in my analysis.