$PYPL - The time has come!NASDAQ:PYPL - The time has come! 🚀
Undervalued and breaking out.
Measured Move is $94 before November 🎯
Buy

AUDUSD Potential UpsidesHey Traders, in today's trading session we are monitoring AUDUSD for a buying opportunity around 0.65500 zone, AUDUSD is trading in an uptrend and currently is in a correction phase in which it is approaching the trend at 0.65500 support and resistance area.
Trade safe, Joe.

Stay above 2600 at all cost !!!Big push up as we all expected; now in 2600. All need is to stay above 2600 at all cost; heres why; if Ethereum stays above 2600 then the bulls will take over and dance around the zone and get to 2800 then lastly 3000. But if it doesnt stays above 2600 then big disappointment will spread around the community.
The most important target is 4000.. the altcoins will skyrocket and the Altseason will start.
Hold on your bags lads


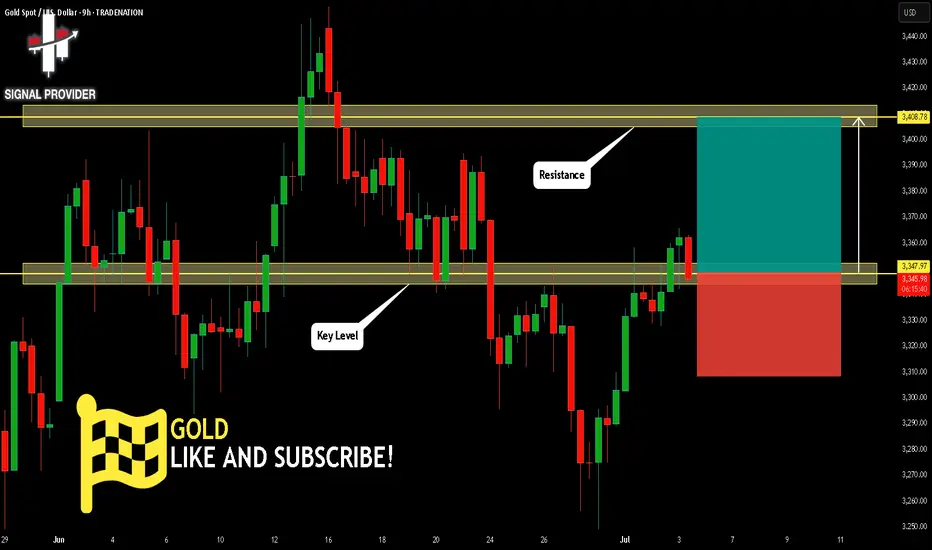
GOLD Will Move Higher! Long!
Here is our detailed technical review for GOLD.
Time Frame: 9h
Current Trend: Bullish
Sentiment: Oversold (based on 7-period RSI)
Forecast: Bullish
The market is approaching a significant support area 3,347.97.
The underlined horizontal cluster clearly indicates a highly probable bullish movement with target 3,408.78 level.
P.S
The term oversold refers to a condition where an asset has traded lower in price and has the potential for a price bounce.
Overbought refers to market scenarios where the instrument is traded considerably higher than its fair value. Overvaluation is caused by market sentiments when there is positive news.
Disclosure: I am part of Trade Nation's Influencer program and receive a monthly fee for using their TradingView charts in my analysis.
Like and subscribe and comment my ideas if you enjoy them!
EURUSD BULISH OR BEARISH DETAILED ANALYSISEURUSD has been playing out exactly as forecasted, now trading confidently above the key 1.17 handle. Price action has respected prior structure levels perfectly, with the recent bullish impulse forming clean higher highs and higher lows. After a minor corrective move and successful retest of the previous breakout zone, we’re now seeing continuation momentum build toward the 1.21 target. This pattern is a textbook bullish flag followed by a clean breakout and retest, confirming the strength behind this current upside leg.
Fundamentally, the euro has gained strength due to growing divergence between the ECB and the Fed. With inflation in the Eurozone stabilizing and recent data indicating a modest recovery in manufacturing and services PMI, there's increasing speculation the ECB may hold rates longer, while the Fed is seen leaning toward eventual rate cuts as US labor data softens. The June NFP miss and downward revisions in prior data have weakened the USD’s position, creating a favorable environment for EURUSD bulls.
The technical confluence with macro fundamentals is striking. Risk sentiment is improving across global markets as inflation fears ease and rate clarity emerges. The euro remains supported by strong capital inflows and demand for yield stability. Additionally, EURUSD has cleared multi-month resistance zones with conviction, signaling institutional interest and momentum-based positioning. The recent candle formations suggest buyers are in firm control.
We remain on track for the 1.21 level, which aligns with prior swing highs and a key Fibonacci extension target. Any pullback toward the 1.16–1.1650 region should be viewed as a high-probability buying opportunity. With the DXY under pressure and euro zone resilience improving, EURUSD continues to be one of the top-performing major pairs heading into Q3. Stay patient and ride the wave—this move has more room to run.

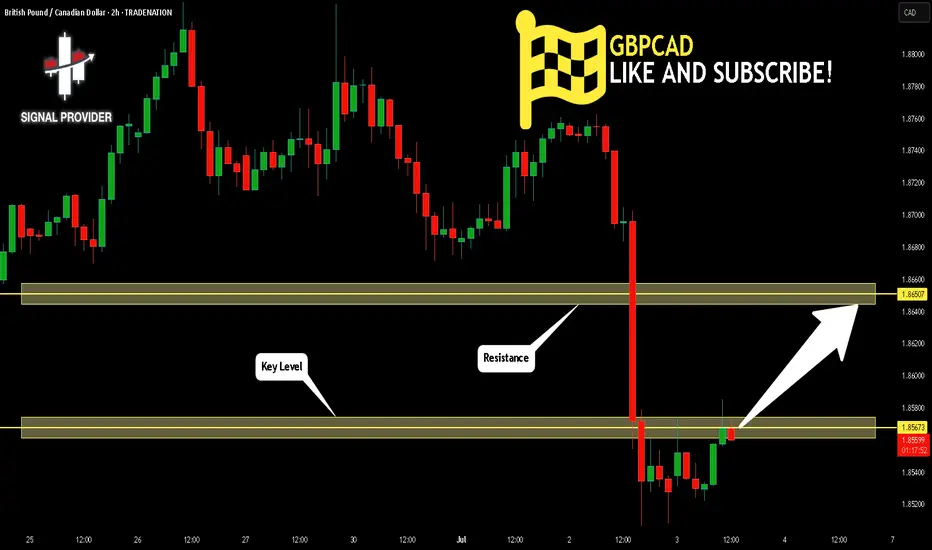
GBPCAD Is Going Up! Long!
Here is our detailed technical review for GBPCAD.
Time Frame: 2h
Current Trend: Bullish
Sentiment: Oversold (based on 7-period RSI)
Forecast: Bullish
The market is trading around a solid horizontal structure 1.856.
The above observations make me that the market will inevitably achieve 1.865 level.
P.S
Please, note that an oversold/overbought condition can last for a long time, and therefore being oversold/overbought doesn't mean a price rally will come soon, or at all.
Disclosure: I am part of Trade Nation's Influencer program and receive a monthly fee for using their TradingView charts in my analysis.
Like and subscribe and comment my ideas if you enjoy them!
GBPUSD LongLooking to the upside got BoS pull back into FVG with the second retest. Looking for the bullish extension to the upside.

Golden Opportunity with EURUSDEURUSD is maintaining a strong bullish structure, with a key support zone around 1.16600. Currently, the price is consolidating just below the 1.18100 resistance and may experience a short-term pullback before continuing higher.
Bullish Supporting Factors:
– The US dollar is weakening amid expectations that the Fed will act cautiously ahead of the upcoming jobs report.
– Eurozone PMI has shown signs of recovery, lending further strength to the euro.
Suggested Strategy:
Wait for buy opportunities around the 1.16600 – 1.17000 area if bullish reversal signals appear. The target remains 1.18100 and potentially higher if upward momentum continues.

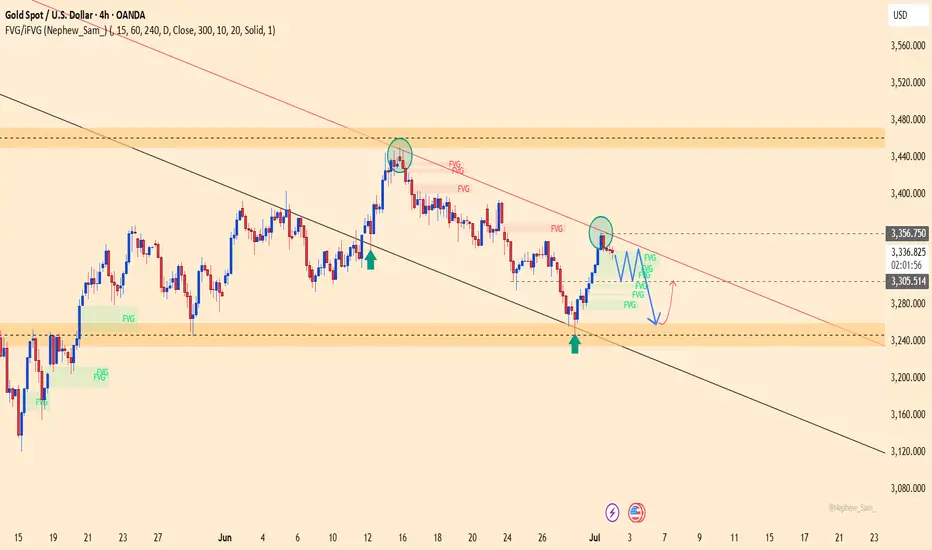
XAUUSD: Gold Surges on U.S. Fiscal Reform ExpectationsGold remains firmly within a short-term bullish structure after rebounding strongly from the $3,258 support zone and forming a consolidation pattern just below the $3,342 resistance. This area marks the confluence of a descending trendline and a fair value gap (FVG), where buyers may gather momentum to break through.
Fundamental news continues to favor the upside: concerns over the U.S. budget deficit and an upcoming tax reform package have boosted safe-haven demand for gold. Meanwhile, U.S. bond yields and the dollar remain low, further driving capital into precious metals.
Yesterday, gold rose by approximately $33.49, equivalent to 3,349 pips, confirming strong bullish inflows. If price breaks above the $3,342–$3,356 zone, the next target could extend beyond the $3,400 mark.
However, if short-term pullbacks occur, the $3,258 area remains a key support level to watch for potential bullish re-entry signals.
EURUSD: Uptrend Targeting 1.18600EURUSD is maintaining a solid bullish structure after breaking above the 1.17300 zone. The pair is currently consolidating around 1.1800 and may see a minor pullback before pushing toward the 1.18600 target.
The main support comes from a weaker USD following Fed Chair Powell’s “patient” remarks, along with strong PMI data from the EU. EURUSD has now posted 10 consecutive days of gains, signaling strong upward momentum.
As long as price holds above the FVG zone near 1.1780, the bullish trend remains intact, with 1.18600 as the next potential upside target.

USDJPY: Bearish Trend Remains in ControlUSDJPY continues to follow a clear downtrend on the H4 chart, respecting a descending trendline and forming consistent lower highs. The strong rejection at 144.800 and the presence of multiple FVGs further reinforce the bearish structure.
Price is currently retracing to test the FVG zone. If rejection occurs here, the downtrend could resume towards the 141.900 support level.
Trade Setup:
Sell near 144.700
TP: 141.900
SL: above 145.300
Supporting News:
"Risk-on" sentiment is back after strong manufacturing data from China and rising expectations that U.S. interest rates may soon peak, weakening the USD against the JPY.
Are you watching for a short setup like I am?

$AMSC - Small Cap Semi with 100% Upside!NASDAQ:AMSC - Could be the next $NVTS...👀
✅ Cup&Handle breakout
✅ Bullish H5 Indictor
✅ Bullish Flow
✅ Volume shelf launch
Only a 1.7B Market cap too! 😱

$ZS - Still room to run - 45% Upside!NASDAQ:ZS - Cybersecurity BEAST right here! 🚀
✅$260 ✅$313
🎯$378 🎯$445
Looking for a small pullback or even a CupnHandle retest then a move back to the upside to our PT's!

$IWM is set for a Blow-Off Top - 34% UpsdieAMEX:IWM is about to have a blow-off top moment!
Catch up mode engaged...
- Breakout of downward trend
- Volume shelf launch
- Rate cuts inbound
- Suppressed for 4 years
PTs: $244/ 259/ 276 (MM)

GOLD – Bullish Flag Breakout After Demand Zone Test
Price pulled back into the major demand zone (blue area), rejected with a strong wick, and formed a bullish flag structure. The breakout above the flag channel suggests continuation toward recent highs.
Trade Plan:
✅ Entry:
Above 3344 (breakout confirmation)
✅ Stop Loss:
Below 3332 (last swing low)
✅ Target:
3357–3360 (previous resistance zone)
Context:
• Demand zone respected
• EMA support aligning
• Clear breakout candle with volume
Risk Management:
Max risk per trade: 1%
Zoom in M5:
#Gold #XAUUSD #PriceAction #BreakoutTrading #MJTrading #ForexSignals #CommodityTrading

GBPUSD Will Go Up! Buy!
Take a look at our analysis for GBPUSD.
Time Frame: 8h
Current Trend: Bullish
Sentiment: Oversold (based on 7-period RSI)
Forecast: Bullish
The market is on a crucial zone of demand 1.370.
The oversold market condition in a combination with key structure gives us a relatively strong bullish signal with goal 1.378 level.
P.S
Please, note that an oversold/overbought condition can last for a long time, and therefore being oversold/overbought doesn't mean a price rally will come soon, or at all.
Disclosure: I am part of Trade Nation's Influencer program and receive a monthly fee for using their TradingView charts in my analysis.
Like and subscribe and comment my ideas if you enjoy them!

EURUSD Potential UpsidesHey Traders, in today's trading session we are monitoring EURUSD for a buying opportunity around 1.17600 zone, EURUSD is trading in an uptrend and currently is in a correction phase in which it is approaching the trend at 1.17600 support and resistance area.
Trade safe, Joe.

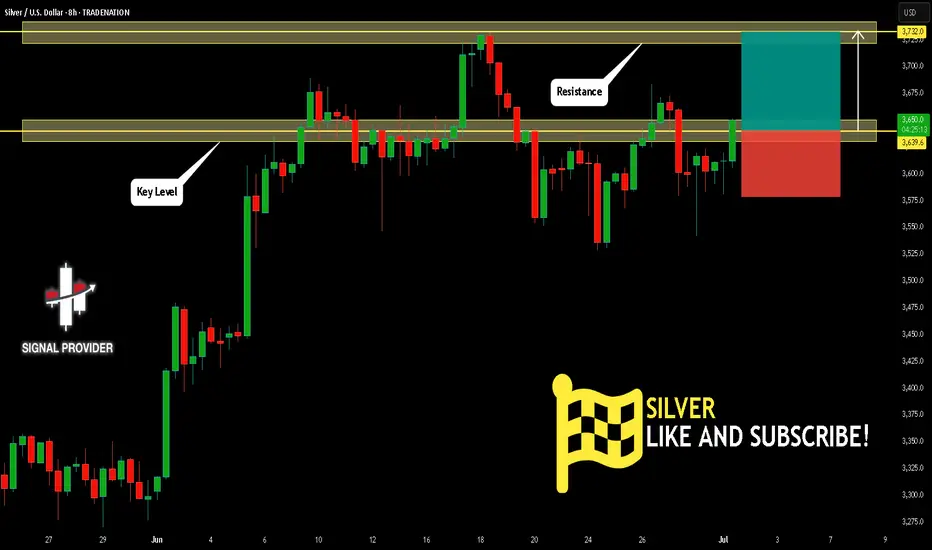
SILVER Will Move Higher! Long!
Please, check our technical outlook for SILVER.
Time Frame: 8h
Current Trend: Bullish
Sentiment: Oversold (based on 7-period RSI)
Forecast: Bullish
The price is testing a key support 3,639.6.
Current market trend & oversold RSI makes me think that buyers will push the price. I will anticipate a bullish movement at least to 3,732.0 level.
P.S
The term oversold refers to a condition where an asset has traded lower in price and has the potential for a price bounce.
Overbought refers to market scenarios where the instrument is traded considerably higher than its fair value. Overvaluation is caused by market sentiments when there is positive news.
Disclosure: I am part of Trade Nation's Influencer program and receive a monthly fee for using their TradingView charts in my analysis.
Like and subscribe and comment my ideas if you enjoy them!
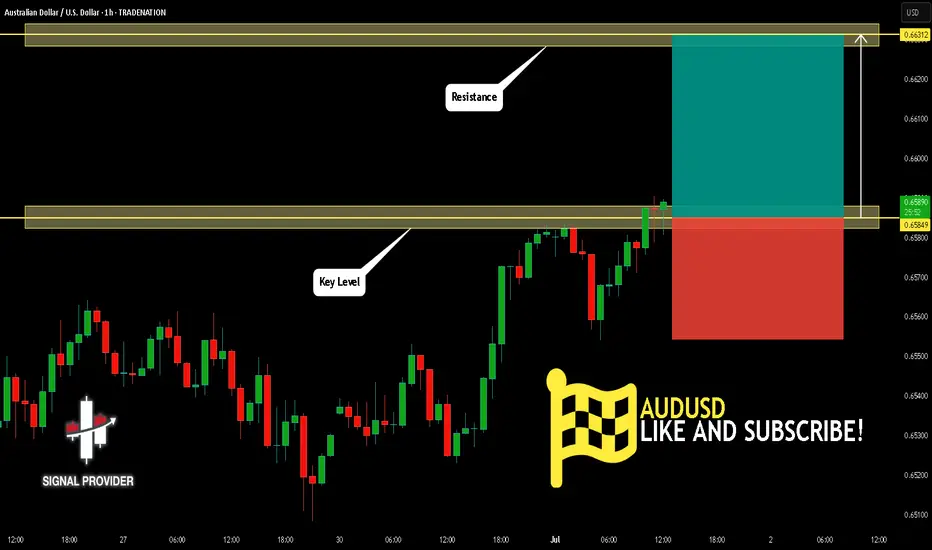
AUDUSD Is Bullish! Buy!
Here is our detailed technical review for AUDUSD.
Time Frame: 1h
Current Trend: Bullish
Sentiment: Oversold (based on 7-period RSI)
Forecast: Bullish
The market is trading around a solid horizontal structure 0.658.
The above observations make me that the market will inevitably achieve 0.663 level.
P.S
We determine oversold/overbought condition with RSI indicator.
When it drops below 30 - the market is considered to be oversold.
When it bounces above 70 - the market is considered to be overbought.
Disclosure: I am part of Trade Nation's Influencer program and receive a monthly fee for using their TradingView charts in my analysis.
Like and subscribe and comment my ideas if you enjoy them!
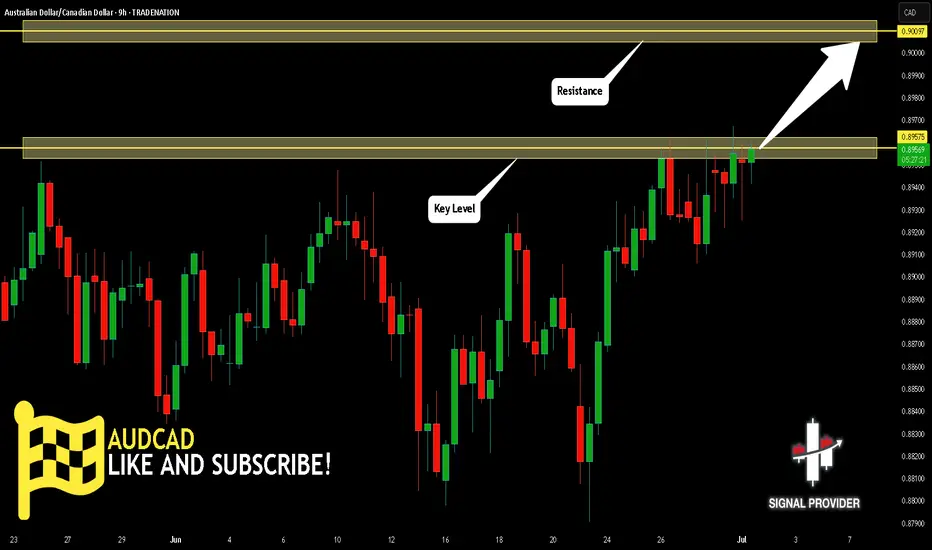
AUDCAD Is Going Up! Long!
Please, check our technical outlook for AUDCAD.
Time Frame: 9h
Current Trend: Bullish
Sentiment: Oversold (based on 7-period RSI)
Forecast: Bullish
The market is approaching a key horizontal level 0.895.
Considering the today's price action, probabilities will be high to see a movement to 0.900.
P.S
Please, note that an oversold/overbought condition can last for a long time, and therefore being oversold/overbought doesn't mean a price rally will come soon, or at all.
Disclosure: I am part of Trade Nation's Influencer program and receive a monthly fee for using their TradingView charts in my analysis.
Like and subscribe and comment my ideas if you enjoy them!
GBP/NZD BEST PLACE TO BUY FROM|LONG
Hello, Friends!
Bullish trend on GBP/NZD, defined by the green colour of the last week candle combined with the fact the pair is oversold based on the BB lower band proximity, makes me expect a bullish rebound from the support line below and a retest of the local target above at 2.267.
Disclosure: I am part of Trade Nation's Influencer program and receive a monthly fee for using their TradingView charts in my analysis.
✅LIKE AND COMMENT MY IDEAS✅

Buy IOC short term target 155, 165 & Medium Term tgt 185, 250 Indian Oil Corporation does business in the entire hydrocarbon value chain - from Refining, Pipeline transportation and marketing of Petroleum products to R&D, Exploration & production, marketing of natural gas and petrochemicals. It has the leadership position in the Oil refining & petroleum marketing sector of India.
The company aims to strengthen EV mobility infrastructure by setting up charging points and battery-swapping facilities at its fuel stations. It has also signed a binding term sheet with Panasonic Group to form a JV for manufacturing cells in India.
The company’s R&D is focused on emerging fields such as nanotechnology, Solar, Bioenergy, Hydrogen, etc. It has an effective patent portfolio of 1636. It spent Rs 946 Cr in FY24 on R&D.
The company’s R&D is focused on emerging fields such as nanotechnology, Solar, Bioenergy, Hydrogen, etc. It has an effective patent portfolio of 1636. It spent Rs 946 Cr in FY24 on R&D.
Market Cap ₹ 2,07,370 Cr.
Annual Sales - ₹ 758,106 Cr
Dividend Yield - 8.20 %
Stock P/E - 17.0
Industry PE - 29.2
Debt to equity - 0.82
ROCE - 7.37 %
EPS - ₹ 9.63
Fundamentally, this big company is trading at a very low valuation. The Crude Oil price is expected this year to be on lowest, so we can expect good profit margin and this company is into green energy business so it should have PE multiple of that business as well. We Expect growth in EPS by 30% to 12.5 And re-rating of PE multiple to 20 so that give the share price to ₹ 250 which gives return of 70.88% from current price level of 146.30.
Technically, this is very bullish on weekly, daily timeframe. Price is trading above all short term, medium term averages. It has formed a bullish candlestick pattern on daily and weekly chart, so we expect immediate strong upside to 155, 165 and eventually 185 level and investment target of 250 levels.
