USOIL Is Very Bullish! Long!
Take a look at our analysis for USOIL.
Time Frame: 1D
Current Trend: Bullish
Sentiment: Oversold (based on 7-period RSI)
Forecast: Bullish
The market is on a crucial zone of demand 73.546.
The oversold market condition in a combination with key structure gives us a relatively strong bullish signal with goal 79.365 level.
P.S
We determine oversold/overbought condition with RSI indicator.
When it drops below 30 - the market is considered to be oversold.
When it bounces above 70 - the market is considered to be overbought.
Disclosure: I am part of Trade Nation's Influencer program and receive a monthly fee for using their TradingView charts in my analysis.
Like and subscribe and comment my ideas if you enjoy them!
Buy

EURNZD Will Go Higher From Support! Buy!
Take a look at our analysis for EURNZD.
Time Frame: 1h
Current Trend: Bullish
Sentiment: Oversold (based on 7-period RSI)
Forecast: Bullish
The market is on a crucial zone of demand 1.922.
The oversold market condition in a combination with key structure gives us a relatively strong bullish signal with goal 1.930 level.
P.S
We determine oversold/overbought condition with RSI indicator.
When it drops below 30 - the market is considered to be oversold.
When it bounces above 70 - the market is considered to be overbought.
Disclosure: I am part of Trade Nation's Influencer program and receive a monthly fee for using their TradingView charts in my analysis.
Like and subscribe and comment my ideas if you enjoy them!

EURJPY Is Going Up! Long!
Please, check our technical outlook for EURJPY.
Time Frame: 4h
Current Trend: Bullish
Sentiment: Oversold (based on 7-period RSI)
Forecast: Bullish
The price is testing a key support 166.677.
Current market trend & oversold RSI makes me think that buyers will push the price. I will anticipate a bullish movement at least to 167.654 level.
P.S
The term oversold refers to a condition where an asset has traded lower in price and has the potential for a price bounce.
Overbought refers to market scenarios where the instrument is traded considerably higher than its fair value. Overvaluation is caused by market sentiments when there is positive news.
Disclosure: I am part of Trade Nation's Influencer program and receive a monthly fee for using their TradingView charts in my analysis.
Like and subscribe and comment my ideas if you enjoy them!

EURUSD Long As the war escalated over the weekend market gapped during Asia session invalidating our initial forecast. (Linked Idea). Looking for the long on EURUSD.

BITCOIN SENDS CLEAR BULLISH SIGNALS|LONG
BITCOIN SIGNAL
Trade Direction: long
Entry Level: 104,672.03
Target Level: 107,484.65
Stop Loss: 102,785.72
RISK PROFILE
Risk level: medium
Suggested risk: 1%
Timeframe: 3h
Disclosure: I am part of Trade Nation's Influencer program and receive a monthly fee for using their TradingView charts in my analysis.
✅LIKE AND COMMENT MY IDEAS✅

Gold Slumps Sharply – Has the Rate-Cut Hope Faded?Gold prices are under intense selling pressure after the Bank of England, the Swiss National Bank, and the Federal Reserve all decided to keep interest rates elevated. This unified stance underscores persistent inflation concerns, driving up the opportunity cost of holding non-yielding assets like gold. As a result, investors rushed to take profits, sending XAUUSD down over 200 pips in just one session.
Adding fuel to the fire, the Fed’s latest monetary policy report to Congress warned that inflation could rise to 3% by year-end, higher than previous projections. Moreover, the Fed trimmed expectations for rate cuts in 2025 and beyond, signaling a longer road to policy easing.
🔎 What does this mean for gold's short-term outlook?
With high rates here to stay and the Fed's cautious stance, gold remains vulnerable to further downside in the near term. However, if upcoming U.S. economic data shows signs of significant weakness, gold may regain favor as a safe-haven asset.
At the time of writing, XAUUSD is trading around $3,347, a critical zone that may determine whether the current drop continues or finds a bottom.
Do you believe this dip will deepen—or is it a golden opportunity to buy the pullback? Share your thoughts below!
New Week! New Opportunities on GOLD! With the recent activity in the middle east expecting prices to continue bullish. I was looking for this move last week but it seems the holiday delayed the process. If we can get a full breakout above the previous daily High level that will be confidence that we are moving bullish for the rest of the week.

"XAUUSD – Hidden Strength Within the Accumulation Zone"Hello everyone, how are you currently evaluating XAUUSD?
Yesterday, gold remained relatively stable without major volatility, yet continued to be supported by a favorable macro environment. Escalating tensions between Israel and Iran have sustained safe-haven demand. While the U.S. has yet to make a direct military move, President Trump’s emergency meeting and firm stance have increased market caution, which in turn boosted interest in gold.
At the time of writing, gold is trading around $3,368, and the long-term trend still favors the bulls. But why do I say that?
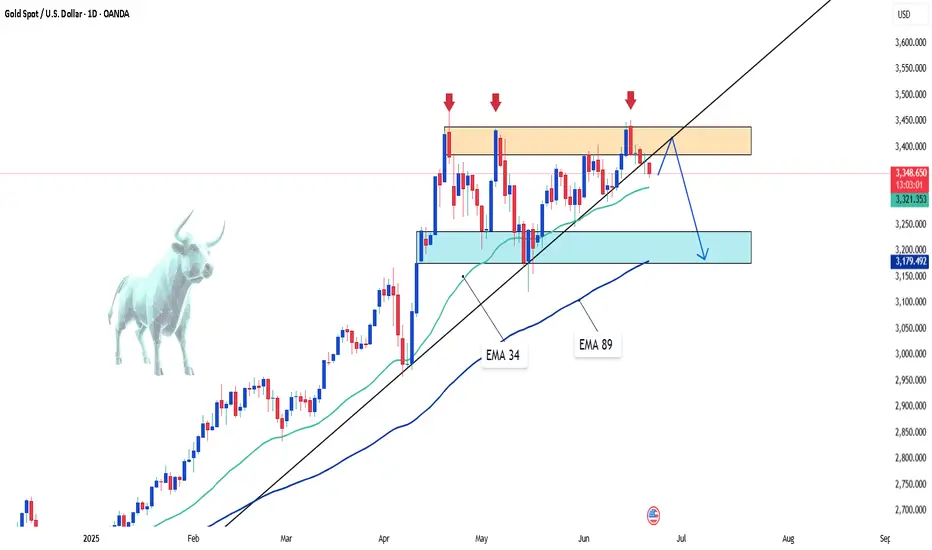
From both a technical and macro perspective, gold is in a healthy accumulation phase. Although it hasn’t broken above the record high, XAUUSD remains safely above key support zones — especially above the EMA 34 — which continues to affirm its bullish structure.
EMA 34 remains a strong dynamic support, with a clear separation from EMA 89, reinforcing the momentum. Even if we see short-term pullbacks in the next few sessions, they are more likely technical retests rather than signs of reversal.
Adding to that, the rising trendline, higher support levels, and bullish candlestick patterns all strengthen the case for continued upward movement. These combined factors paint a positive technical outlook for gold in the medium to long term.
From my perspective, I remain confident in gold’s long-term uptrend. What about you? Feel free to share your thoughts!

AUDUSD Potential Long - Dependent on PA Market openAUD/USD Long Setup – 15M Chart Analysis
Looking at a potential long on AUD/USD after price tapped into demand and swept liquidity. The area aligns with a fair value gap and previous order block, suggesting interest from larger players.
Two Entry Options:
1. Aggressive: Buy limit at the order block (riskier, no confirmation).
2. Conservative: Wait for break of structure, then retest into FVG with bullish price action for confirmation.
Targets:
Target 1: 0.6470
Target 2: 0.6480
Target 3: 0.6490
Extended Target: 0.6530 (only if 0.6490 is breached and price holds above)
Important Notes:
This setup is forecast-based and depends on how price opens and reacts.
Entry should follow a clear confirmation, especially after a liquidity sweep.
Ideal confirmation: Break of structure followed by a retest with bullish PA on lower timeframes (M5/M1).
Invalidation: A clean break and close below 0.6430 would invalidate this idea.
Stay disciplined. Trade the plan, not the prediction.

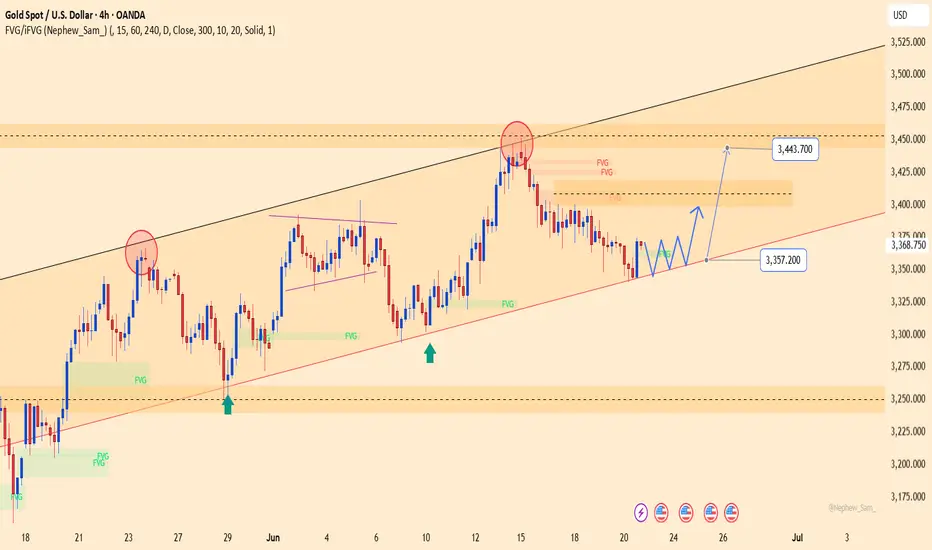
XAUUSD – Weak consolidation near 3,357, eyes on 3,443 retestYesterday, gold traded within the 3,344 to 3,371 USD range and closed at 3,368.75 USD (+0.72%). Despite the slight rebound, price action remains weakly consolidative within a broad ascending channel, repeatedly rejected at the 3,443 USD resistance area — where multiple FVGs (Fair Value Gaps) remain unfilled.
On the H4 chart, price is holding above the key confluence support at 3,357 USD, which aligns with the medium-term ascending trendline. If this level holds, a technical bounce back toward 3,443 USD is likely.
However, it's worth noting that recent upward moves have lost momentum near the upper FVG zones. Traders should wait for a clear confirmation signal — particularly a strong bullish candle at the current support — before considering entry.
EURUSD to Retest 1.16 regionWatching the 1.1490–1.1450 zone for a potential bullish reaction. This area includes a 4H Fair Value Gap and Order Block. If price gives a 15M CoCH within this range, I’ll look to enter long.
Targets: 1.1540, 1.1570, and 1.1610
Invalidation below 1.1440
Patience until price delivers a clear setup.

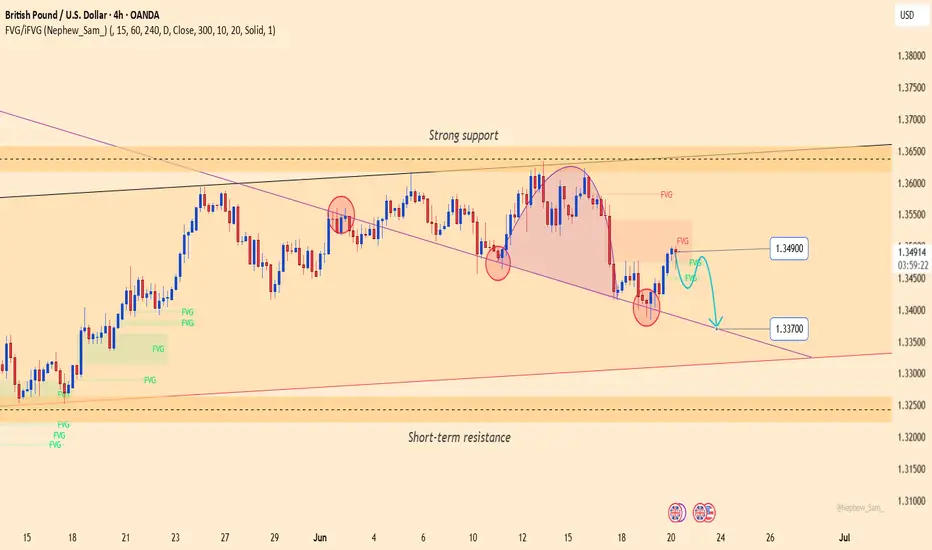
GBPUSD: Bearish pressure persistsGBPUSD is consolidating below a key medium-term resistance zone, with a rounding top and a minor head-and-shoulders pattern forming. The price is currently retesting the Fair Value Gap near 1.34900 — a potential reversal zone if it fails to break higher.
On the fundamental side, the Bank of England's decision to hold interest rates on June 19 disappointed the market. Meanwhile, the US dollar remains supported by safe-haven demand and the Federal Reserve’s hawkish tone, adding further pressure on GBP.
If GBPUSD fails to hold the trendline support near 1.33700, the risk of a deeper decline increases. Both the technical structure and macro fundamentals favor the bears.
$IREN could be next...100%+ UpsideNext Retail Darling... NASDAQ:IREN TA looks the part! 👀
Breakout 🎯$22 then $31
CupnHandle almost breaking out here with measured moves a lot higher!
Volume shelf acting as a launch pad.
WR% is uptrnding as well!
This one's looking good based on the TA.

SILVER Is Very Bullish! Long!
Take a look at our analysis for SILVER.
Time Frame: 4h
Current Trend: Bullish
Sentiment: Oversold (based on 7-period RSI)
Forecast: Bullish
The market is testing a major horizontal structure 3,603.0.
Taking into consideration the structure & trend analysis, I believe that the market will reach 3,697.2 level soon.
P.S
Overbought describes a period of time where there has been a significant and consistent upward move in price over a period of time without much pullback.
Disclosure: I am part of Trade Nation's Influencer program and receive a monthly fee for using their TradingView charts in my analysis.
Like and subscribe and comment my ideas if you enjoy them!

Gold Longlooking to the upside on Gold from Asia lows. This is a prelim entry (forecast) need to seek bullish PA around the FVG if we get a pull back. If a pull back does not form we will wait for a break and RT above 3,352 and plan entries accordingly.


XAUUSD - 4H Breakout and Retest Setup🟡🟡🟡
🕒 June 17, 2025
Bias: Medium-Term Bullish
Structure: Breakout → Retest → Continuation
Context: Trendline break + confluence with EMA + prior resistance turned support
🔍 Market Structure Insight:
Major descending trendline broken with strong impulsive momentum.
Pullback held at the intersection of:
Broken trendline retest
EMA 60 dynamic support
Bullish structure of HL-HH (Higher Low / Higher High)
Strong bullish candle at support
✅ Trade Plan – Buy Stop Setup
Entry (Buy Stop): 3402
SL: 3373 (below the pullback structure + EMAs)
TP1: 3430 (local resistance area)
TP2: 3470 (measured move from previous leg height)
#XAUUSD #Gold #TechnicalAnalysis #BreakoutSetup #Forex #EMA #SqueezePlay #TrianglePattern #tradingview #MJTrading

XAUUSD – Support Under Threat, Deeper Decline LoomsGold is stalling below the 3,444 USD resistance, forming a series of lower highs — a clear sign of weakening bullish momentum. The support area around 3,358 USD is under pressure, and a break below this level could trigger a drop toward 3,280 USD.
On the news front, the FOMC has reaffirmed its hawkish stance, making no mention of a rate cut despite signs of slowing economic growth. This has strengthened the USD, placing additional downward pressure on gold.
In summary, XAUUSD is on the verge of breaking its bullish structure. If current support fails, sellers may take full control of the market.
XAUUSD Trade Idea:
Position: SELL if price breaks below 3,358 USD
Target: 3,304 – 3,280 USD
Stop Loss: Above 3,400 USD

ETHUSD Is Very Bullish! Buy!
Take a look at our analysis for ETHUSD.
Time Frame: 10h
Current Trend: Bullish
Sentiment: Oversold (based on 7-period RSI)
Forecast: Bullish
The market is on a crucial zone of demand 2,508.60.
The oversold market condition in a combination with key structure gives us a relatively strong bullish signal with goal 2,717.66 level.
P.S
Please, note that an oversold/overbought condition can last for a long time, and therefore being oversold/overbought doesn't mean a price rally will come soon, or at all.
Disclosure: I am part of Trade Nation's Influencer program and receive a monthly fee for using their TradingView charts in my analysis.
Like and subscribe and comment my ideas if you enjoy them!

XAUUSD – Gold breaks trend: Is a deeper fall coming?Gold has officially broken the ascending trendline that had held since mid-May, confirming a breakdown in the bullish structure. After failing to breach the strong resistance at 3,445 USD, selling pressure intensified, driving the price down to 3,390 USD — yesterday’s closing level.
This move came right after the FOMC meeting, where the Fed held interest rates steady but maintained a hawkish tone, strengthening the USD and weighing heavily on gold.
While tensions in the Middle East continue to offer short-term support, U.S. monetary policy remains the dominant force. Without a fresh geopolitical shock, gold appears increasingly vulnerable to a deeper correction.

BTCUSDT – Price Poised to Break Descending ChannelBTCUSDT has been maintaining a series of higher lows since early May, consistently rebounding from its dynamic support trendline. Currently, the price is consolidating just below the descending channel resistance around the 108,000 USDT level. A clear double-bottom pattern accompanied by solid recovery momentum suggests a potential breakout from the prolonged correction phase that has persisted throughout June.
If BTC breaks above the descending trendline, the next target could be the major resistance zone near 113,000 USDT.
On the news front, the market is reacting positively to BlackRock’s announcement of expanding investment in crypto ETF products. At the same time, recent soft U.S. inflation data has strengthened expectations that the Fed may halt its tightening cycle. This combination is improving investor sentiment and driving renewed interest in risk assets like Bitcoin.

EURUSD – Bullish momentum fades, downside pressure intensifiesEURUSD formed a lower high near 1.1613, signaling weakening bullish momentum. Price is now testing a key trendline, and a break below 1.1473 could confirm a bearish move toward 1.1350.
Market sentiment is currently dominated by the Fed’s hawkish stance following the latest FOMC meeting, where the central bank kept rates unchanged but expressed readiness to hike further if necessary. Meanwhile, although tensions in the Middle East are escalating, they have yet to deliver a significant blow to the USD.
Given the current backdrop, EURUSD is under considerable pressure and may soon break its bullish structure unless strong buying interest re-emerges.

