CAD/JPY BULLS ARE STRONG HERE|LONG
Hello, Friends!
We are now examining the CAD/JPY pair and we can see that the pair is going down locally while also being in a downtrend on the 1W TF. But there is also a powerful signal from the BB lower band being nearby indicating that the pair is oversold so we can go long from the support line below and a target at 108.573 level.
Disclosure: I am part of Trade Nation's Influencer program and receive a monthly fee for using their TradingView charts in my analysis.
✅LIKE AND COMMENT MY IDEAS✅
Buy

EURUSD Holds Above 1.1600 – Where Will The Upside Go?Hey everyone, do you think EURUSD will continue to rise?
Yesterday, EUR/USD had a strong rally, breaking through the 1.1600 level, and it’s currently holding its gains in today’s European session.
The main reason behind this rise is an improved risk sentiment, making it harder for the US dollar to gain traction. Investors are awaiting comments from Fed officials, which is providing support to EURUSD.
In the short term, the market seems ready for another push higher. The next key resistance level to watch is 1.1800, and if it breaks through, the path towards 1.19XX could open up.
What do you think? Will EURUSD continue this strong upward momentum? Share your thoughts below!
Good luck with your trading!

EURUSD Short-Term Bullish Momentum - Buy ? Hello everyone, what do you think about EURUSD?
Yesterday, we discussed the sideways movement of this pair, and now, it seems that EUR/USD is showing a short-term bullish trend. The price is currently moving around 1.165, as marked on the chart.
In the short term, the market appears ready for further upward movement. With support at multiple levels (Support 1 and Support 2), and the possibility of forming a Support 3 to reach the target of 1.177, the overall outlook remains optimistic.
Keep an eye on how the market reacts at these important levels! Don’t forget to like if you agree with my view!
Good luck!

Gold Is Conquering New Highs!Hello everyone, what do you think about XAUUSD?
Gold has had an impressive week of growth, currently approaching its historical peak at 3,380 USD/ounce.
This is a clear sign of the precious metal's sustained strength amidst a volatile market. Weak U.S. employment data, along with expectations that the Federal Reserve (Fed) may cut interest rates in September, have weakened the USD, which in turn has propelled gold to new heights.
From a technical standpoint, gold is trading in an upward channel and continuously recovering from solid support levels, indicating strong buying momentum. Notably, we’ve seen a bearish crossover at the EMA 34 and 89 lines, along with a break below the previous uptrend line – both of which strengthen the current upward move.
If there is any pullback before the next leg up, Support 1 (which aligns with the lower boundary of the upward channel and the EMA lines) will be an important area to watch. This could be the ideal zone for potential trade setups.
Looking ahead, the next resistance target is around 3,440 USD. If this level is broken, nothing will hold gold back from pushing even higher, possibly heading toward the psychological 3,500 USD level.
What do you think? Will XAUUSD continue its breakout this week? Drop your thoughts in the comments below!

USD/JPY(20250807)Today's AnalysisMarket News:
Federal Reserve Chairman Kashkari: A rate cut may be appropriate in the short term, and two rate cuts this year are reasonable. Trump: The new Fed governor will likely be temporary, and the appointment will be announced within 2-3 days.
Technical Analysis:
Today's Buy/Sell Levels:
147.40
Support and Resistance Levels:
148.30
147.96
147.74
147.05
146.83
146.49
Trading Strategy:
If the market breaks above 147.40, consider a buy entry, with the first target price being 147.74. If the market breaks below 147.05, consider a sell entry, with the first target price being 146.83

Gold Continues Strong Bullish Move Hello everyone, wishing you a great trading day!
After a sharp decline from the recent highs, OANDA:XAUUSD quickly regained its strength and established a clear upward trend. The H4 chart shows the potential formation of a new upward trendline, with support positioned around the 3,350 USD zone.
This recent recovery is not just a technical bounce – it's supported by strong fundamental factors: weakening US bond yields, rising expectations that the Fed will cut interest rates in September, and a market sentiment that’s leaning towards safe-haven assets.
Currently, gold is trading around 3,380 USD and seems to be consolidating the momentum to approach the next resistance level at 3,433 USD. If the price holds above the new trendline and doesn’t break the marked support, the continuation of the upward trend is highly likely.
Personal view: The bullish trend remains intact – just a breakout confirmation and the 3,433 USD target will be within reach.
What do you think? Will gold continue its breakout this week? Leave your thoughts in the comments below!

BTCUSD: Is the Downtrend About to Accelerate?Hey everyone! What do you think about BTCUSD right now?
Yesterday, XAUUSD continued its downtrend and is currently trading around 114,089 USD.
The main reason for this is the US job data showing higher-than-expected unemployment, increasing the likelihood that the Federal Reserve will cut interest rates in September. This expectation has weakened the USD, making gold and other safe-haven assets more attractive, but at the same time, BTC/USD is facing negative pressure from the price channel.
In the short term, the price continues to maintain a bearish trend. Notably, we observe a bearish crossover between the EMA 34 and 89, along with a break of the previous uptrend line—both of which reinforce the current downtrend.
If there’s a pullback before the next drop, the Fibonacci retracement levels of 0.5–0.618 (which also align with resistance levels and the EMA) will be key zones to watch. This could be the ideal level for potential trade setups.
Looking ahead, the next support target is around 110,000 USD. If this level breaks, BTC could head towards the 10X,000 USD range.
What do you think? Share your thoughts in the comments!

ADBE LONGThis trade has reached the yearly low of 335 showing that there will be strong level of support.
It is against the trend however there is a bat pattern on H4 and daily
There is a double bottom on M30 and H1 showing divergence.
Stop loss below 333

Gold Trading Strategy XAUUSD August 6, 2025Gold Trading Strategy XAUUSD August 6, 2025:
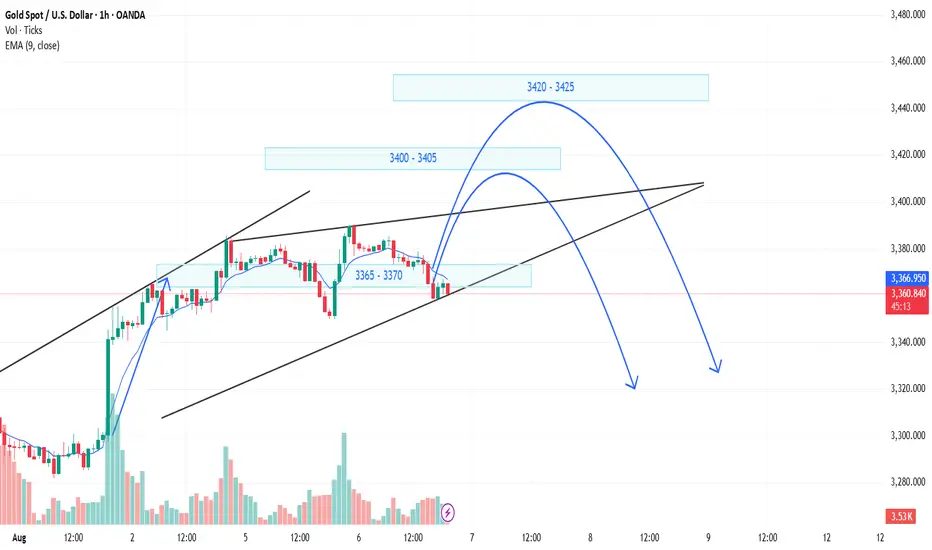
Spot gold edged lower in Asian trading yesterday (August 5), currently trading around $3,380/ounce. On Tuesday, the US ISM Services PMI came in at 50.1, below the forecast of 1.4 and below the previous month's reading of 0.7; the news sent gold prices soaring in the US session.
Fundamentals: Gold prices surged after weak jobs data increased the likelihood of a rate cut by the Federal Reserve. Data released last Friday showed that the number of new jobs in the US non-farm sector was much lower than expected, indicating a sharp deterioration in the labor market. The probability of the Fed cutting interest rates in September increased to 87%, up from 63% last week.
Technical analysis: Gold price is still in the uptrend channel in the H1 frame, the 3365 - 3370 area is supporting the gold price to continue following the price channel. If the gold price continues to fluctuate according to the price channel, the next prospective area could be 3400 - 3405 or even 3420 - 3425. However, the RSI and MA lines have shown signs that the buyers are weakening, so the gold price is very likely to have a strong correction from today until the end of the week.
Important price zones today: 3365 - 3370, 3400 - 3405 and 3420 - 3425.
Today's trading trend: SELL.
Recommended order:
Plan 1: SELL XAUUSD zone 3403 - 3405
SL 3408
TP 3400 - 3390 - 3380 - 3350 - OPEN.
Plan 2: SELL XAUUSD zone 3423 - 3425
SL 3428
TP 3420 - 3420 - 3400 - 3380 - OPEN.
Plan 3: BUY XAUUSD zone 3365 - 3367
SL 3362
TP 3370 - 3380 - 3390 - 3400.
Wish you a safe, successful and profitable trading day.🥰🥰🥰🥰🥰
Gold Trading Strategy XAUUSD August 6, 2025Gold Trading Strategy XAUUSD August 6, 2025:
Spot gold edged lower in Asian trading yesterday (August 5), currently trading around $3,380/ounce. On Tuesday, the US ISM Services PMI came in at 50.1, below the forecast of 1.4 and below the previous month's reading of 0.7; the news sent gold prices soaring in the US session.
Fundamentals: Gold prices surged after weak jobs data increased the likelihood of a rate cut by the Federal Reserve. Data released last Friday showed that the number of new jobs in the US non-farm sector was much lower than expected, indicating a sharp deterioration in the labor market. The probability of the Fed cutting interest rates in September increased to 87%, up from 63% last week.
Technical analysis: Gold price is still in the uptrend channel in the H1 frame, the 3365 - 3370 area is supporting the gold price to continue following the price channel. If the gold price continues to fluctuate according to the price channel, the next prospective area could be 3400 - 3405 or even 3420 - 3425. However, the RSI and MA lines have shown signs that the buyers are weakening, so the gold price is very likely to have a strong correction from today until the end of the week.
Important price zones today: 3365 - 3370, 3400 - 3405 and 3420 - 3425.
Today's trading trend: SELL.
Recommended order:
Plan 1: SELL XAUUSD zone 3403 - 3405
SL 3408
TP 3400 - 3390 - 3380 - 3350 - OPEN.
Plan 2: SELL XAUUSD zone 3423 - 3425
SL 3428
TP 3420 - 3420 - 3400 - 3380 - OPEN.
Plan 3: BUY XAUUSD zone 3365 - 3367
SL 3362
TP 3370 - 3380 - 3390 - 3400.
Wish you a safe, successful and profitable trading day.🥰🥰🥰🥰🥰

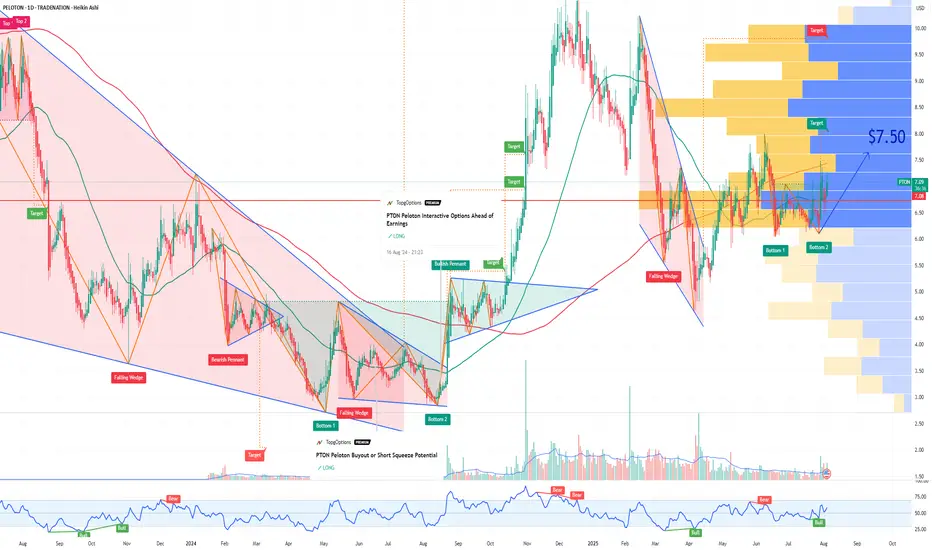
PTON Peloton Interactive Options Ahead of EarningsIf you haven`t bought the dip on PTON:
Now analyzing the options chain and the chart patterns of PTON Peloton Interactive prior to the earnings report this week,
I would consider purchasing the 7.50usd strike price Calls with
an expiration date of 2025-8-8,
for a premium of approximately $0.46.
If these options prove to be profitable prior to the earnings release, I would sell at least half of them.
Disclosure: I am part of Trade Nation's Influencer program and receive a monthly fee for using their TradingView charts in my analysis.
PINS Pinterest Options Ahead of EarningsIf you haven`t bought PINS before the previous earnings:
Now analyzing the options chain and the chart patterns of PINS Pinterest prior to the earnings report this week,
I would consider purchasing the 39usd strike price Calls with
an expiration date of 2025-8-8,
for a premium of approximately $2.22.
If these options prove to be profitable prior to the earnings release, I would sell at least half of them.

XAUUSD Gold Trading Strategy August 5, 2025
Yesterday's trading session, gold prices continued to increase sharply due to previous influences. However, the possibility of a short-term correction in gold prices at the end of the week will be very high.
Basic news: According to CME FEDWatch, the probability of the Fed cutting interest rates at its September meeting has now increased to about 84%, reflecting increasing concerns about economic weakness. The market is currently pricing in at least two 25 basis point cuts between now and the end of the year, showing a clear shift in investor sentiment after disappointing employment data.
Technical analysis: Gold's bullish momentum is currently showing signs of weakening. The peak area of 3383 - 3385 may create a double peak pattern on H1, but the possibility of gold prices correcting today is very low. Currently, gold prices are filling liquidity at support areas. The correction of gold prices may take place at the end of the week when buyers take profits.
Important price zones today: 3350 - 3355 and 3330 - 3335.
Today's trading trend: BUY.
Recommended orders:
Plan 1: BUY XAUUSD zone 3350 - 3352
SL 3347
TP 3355 - 3365 - 3375 - 3400.
Plan 2: BUY XAUUSD zone 3330 - 3332
SL 3327
TP 3335 - 3345 - 3365 - 3400.
Plan 3: SELL XAUUSD zone 3420 - 3422
SL 3425
TP 3417 - 3407 - 3387 - 3357 - OPEN (small volume).
Wish you a safe, successful and profitable trading day.🌟🌟🌟🌟🌟

NZD/JPY BEST PLACE TO BUY FROM|LONG
NZD/JPY SIGNAL
Trade Direction: long
Entry Level: 86.809
Target Level: 88.001
Stop Loss: 86.010
RISK PROFILE
Risk level: medium
Suggested risk: 1%
Timeframe: 8h
Disclosure: I am part of Trade Nation's Influencer program and receive a monthly fee for using their TradingView charts in my analysis.
✅LIKE AND COMMENT MY IDEAS✅

AUD/JPY LONG FROM SUPPORT
Hello, Friends!
The BB lower band is nearby so AUD-JPY is in the oversold territory. Thus, despite the downtrend on the 1W timeframe I think that we will see a bullish reaction from the support line below and a move up towards the target at around 96.130.
Disclosure: I am part of Trade Nation's Influencer program and receive a monthly fee for using their TradingView charts in my analysis.
✅LIKE AND COMMENT MY IDEAS✅

XAUUSD breaks out – bullish bias returnsGold has bounced from the bottom of the descending channel, initiating a clear upward move with a series of strong bullish candles. On the H2 chart, price has broken above the upper boundary of the medium-term downtrend channel and filled the nearest fair value gap, signaling a resurgence in buying pressure.
Current price action is approaching a previous resistance zone, aligned with recent swing highs. The chart suggests a potential consolidation before further upside, provided that the current bullish structure remains intact.
From a macro perspective, while the stronger-than-expected U.S. PMI data supports the USD in the short term, weak labor market figures and ongoing global geopolitical tensions continue to fuel demand for gold as a safe-haven asset. This environment is helping sustain XAUUSD’s current recovery structure.

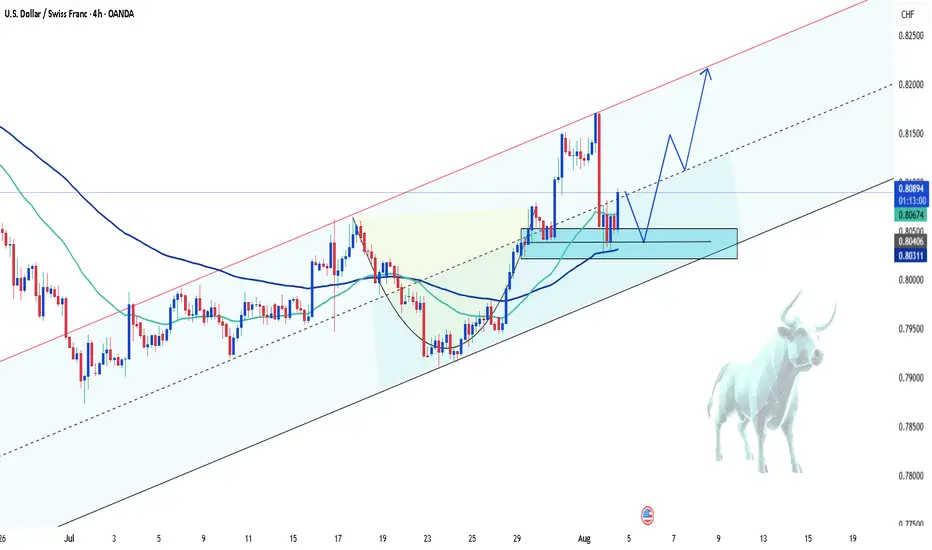
USDCHF – Bullish comeback in progress?Hey everyone! What’s your take on the current trend of USDCHF?
While the pair experienced a recent dip, take a step back and look at the bigger picture — doesn’t it still seem to be moving within an ascending channel?
Right now, USDCHF is hovering around 0.8092 and starting to bounce back. The recovery appears to be supported by a newly formed support zone and the confluence of the EMA 34 and 89. The pair seems to be eyeing the recent high, with potential to climb further toward the upper boundary of the channel.
My current bias? Bullish.
What about you — do you see the same opportunity?
Drop a comment and hit like if you’re on the same page!
XAUUSD (Next 24 Hours) Technical Analysis Forecast1. Japanese Candlestick Analysis
4H/1H: Price opened at 3374.13 near critical resistance (3375–3380). Recent candles show bearish harami and dark cloud cover, signaling rejection.
30M/15M: Gravestone doji at 3374.13 indicates bearish pressure. Failure to close above 3375 confirms weakness.
5M: Three black crows pattern emerging, suggesting strong short-term momentum.
Outlook: Bearish reversal likely if 3370 breaks.
2. Harmonic Patterns
4H/1H: Bearish Butterfly Pattern completing at 3374.13 (D-point).
PRZ: 3370–3375 (confluence of 127.2% XA and 161.8% BC).
Fibonacci Ratios: AB=CD symmetry (3370–3375).
30M: Bullish Crab forming at 3355, but secondary to larger bearish setup.
Outlook: High-probability short entry at 3374–3375 with target 3340.
3. Elliott Wave Theory
4H: Wave 5 of impulse cycle peaked at 3374.13.
Structure: Completed 5-wave sequence from 3320 → 3374.13.
Corrective Phase: ABC pullback targeting 3320–3340 (Wave A: 3340).
1H: Sub-wave (v) of 5 ending at 3374.13. RSI divergence confirms exhaustion.
Outlook: Bearish correction to 3320–3340 within 24 hours.
4. Wyckoff Theory
Phase: Distribution (after markup from 3320 → 3374.13).
Signs: High volume at 3374.13 (supply), upthrust above 3380 failed.
Schematic: Phase C (markdown) initiating.
1H/30M: Spring at 3365 failed to hold, indicating weak demand.
Outlook: Break below 3365 triggers markdown to 3320.
5. W.D. Gann Theory
Time Theory
24H Cycle: Key reversal windows:
UTC+4: 10:00–12:00 (resistance test), 16:00–18:00 (trend reversal).
Square of 9: 3374.13 aligns with 0° angle (resistance).
Square of 9
3374.13 → Resistance Angles:
0° (3375), 90° (3385), 180° (3400).
Support: 45° (3350), 315° (3330).
Price Forecast: Reversal at 3375 (0° angle).
Angle Theory
4H Chart: 1x1 Gann Angle (45°) from 3320 low at 3350. Price above angle = bullish, but overextended.
1H Chart: 2x1 Angle (63.75°) at 3374.13 acting as resistance.
Squaring of Price & Time
Price Range: 3320 → 3374.13 (54.13 points).
Time Squaring: 54 hours from 3320 low → 3375 resistance (54 points = 54 hours).
Harmony: 3374.13 = Time Cycle Peak (24H from open).
Ranges in Harmony
Primary Range: 3320–3400 (80 points).
50% Retracement: 3360 (support).
61.8% Retracement: 3340 (critical support).
Secondary Range: 3340–3380 (40 points).
Key Levels: 3360 (50%), 3340 (61.8%).
Price & Time Forecasting
Price Targets:
Short-Term: 3340 (61.8% Fib, Gann 45° angle).
Extension: 3320 (100% of prior correction).
Time Targets:
First Reversal: 10–14 hours from open (UTC+4 14:00–18:00).
Second Reversal: 22–24 hours (UTC+4 22:00–00:00 next day).
Synthesized 24H Forecast
Bearish Scenario (High Probability)
Trigger: Break below 3370 (confirmed by 1H/30M close).
Targets:
T1: 3340 (61.8% Fib, Gann 45° angle).
T2: 3320 (Wyckoff markdown, Elliott Wave A).
Timeline:
10–14H: Drop to 3340 (UTC+4 14:00–18:00).
22–24H: Test 3320 (UTC+4 22:00–00:00 next day).
Confirmation: RSI <50 on 1H, volume spike >25% average.
Bullish Scenario (Low Probability)
Trigger: Sustained close above 3380 (Gann 0° angle).
Targets: 3385 (90° angle), 3400 (180° angle).
Timeline: 14–18 hours (if 3380 breaks).
For those interested in further developing their trading skills based on these types of analyses, consider exploring the mentoring program offered by Shunya Trade.(world wide web shunya trade)
I welcome your feedback on this analysis, as it will inform and enhance my future work.
Regards,
Shunya.Trade
world wide web shunya trade
⚠️ Disclaimer: This post is educational content and does not constitute investment advice, financial advice, or trading recommendations. The views expressed here are based on technical analysis and are shared solely for informational purposes. The stock market is subject to risks, including capital loss, and readers should exercise due diligence before investing. We do not take responsibility for decisions made based on this content. Consult a certified financial advisor for personalized guidance.

USDJPY Will Grow! Buy!
Here is our detailed technical review for USDJPY.
Time Frame: 12h
Current Trend: Bullish
Sentiment: Oversold (based on 7-period RSI)
Forecast: Bullish
The market is testing a major horizontal structure 147.215.
Taking into consideration the structure & trend analysis, I believe that the market will reach 150.314 level soon.
P.S
The term oversold refers to a condition where an asset has traded lower in price and has the potential for a price bounce.
Overbought refers to market scenarios where the instrument is traded considerably higher than its fair value. Overvaluation is caused by market sentiments when there is positive news.
Disclosure: I am part of Trade Nation's Influencer program and receive a monthly fee for using their TradingView charts in my analysis.
Like and subscribe and comment my ideas if you enjoy them!

GBPUSD Will Go Higher From Support! Long!
Take a look at our analysis for GBPUSD.
Time Frame: 1h
Current Trend: Bullish
Sentiment: Oversold (based on 7-period RSI)
Forecast: Bullish
The market is approaching a key horizontal level 1.328.
Considering the today's price action, probabilities will be high to see a movement to 1.336.
P.S
We determine oversold/overbought condition with RSI indicator.
When it drops below 30 - the market is considered to be oversold.
When it bounces above 70 - the market is considered to be overbought.
Disclosure: I am part of Trade Nation's Influencer program and receive a monthly fee for using their TradingView charts in my analysis.
Like and subscribe and comment my ideas if you enjoy them!

GOLD Will Go Higher From Support! Buy!
Here is our detailed technical review for GOLD.
Time Frame: 12h
Current Trend: Bullish
Sentiment: Oversold (based on 7-period RSI)
Forecast: Bullish
The market is testing a major horizontal structure 3,311.57.
Taking into consideration the structure & trend analysis, I believe that the market will reach 3,369.04 level soon.
P.S
The term oversold refers to a condition where an asset has traded lower in price and has the potential for a price bounce.
Overbought refers to market scenarios where the instrument is traded considerably higher than its fair value. Overvaluation is caused by market sentiments when there is positive news.
Disclosure: I am part of Trade Nation's Influencer program and receive a monthly fee for using their TradingView charts in my analysis.
Like and subscribe and comment my ideas if you enjoy them!

GBP/JPY BULLS ARE GAINING STRENGTH|LONG
Hello, Friends!
Previous week’s red candle means that for us the GBP/JPY pair is in the downtrend. And the current movement leg was also down but the support line will be hit soon and lower BB band proximity will signal an oversold condition so we will go for a counter-trend long trade with the target being at 197.696.
Disclosure: I am part of Trade Nation's Influencer program and receive a monthly fee for using their TradingView charts in my analysis.
✅LIKE AND COMMENT MY IDEAS✅

EUR/GBP BULLS ARE STRONG HERE|LONG
EUR/GBP SIGNAL
Trade Direction: long
Entry Level: 0.863
Target Level: 0.872
Stop Loss: 0.857
RISK PROFILE
Risk level: medium
Suggested risk: 1%
Timeframe: 9h
Disclosure: I am part of Trade Nation's Influencer program and receive a monthly fee for using their TradingView charts in my analysis.
✅LIKE AND COMMENT MY IDEAS✅
