Gold Longlooking to the upside on Gold from Asia lows. This is a prelim entry (forecast) need to seek bullish PA around the FVG if we get a pull back. If a pull back does not form we will wait for a break and RT above 3,352 and plan entries accordingly.
Buy


XAUUSD - 4H Breakout and Retest Setup🟡🟡🟡
🕒 June 17, 2025
Bias: Medium-Term Bullish
Structure: Breakout → Retest → Continuation
Context: Trendline break + confluence with EMA + prior resistance turned support
🔍 Market Structure Insight:
Major descending trendline broken with strong impulsive momentum.
Pullback held at the intersection of:
Broken trendline retest
EMA 60 dynamic support
Bullish structure of HL-HH (Higher Low / Higher High)
Strong bullish candle at support
✅ Trade Plan – Buy Stop Setup
Entry (Buy Stop): 3402
SL: 3373 (below the pullback structure + EMAs)
TP1: 3430 (local resistance area)
TP2: 3470 (measured move from previous leg height)
#XAUUSD #Gold #TechnicalAnalysis #BreakoutSetup #Forex #EMA #SqueezePlay #TrianglePattern #tradingview #MJTrading

XAUUSD – Support Under Threat, Deeper Decline LoomsGold is stalling below the 3,444 USD resistance, forming a series of lower highs — a clear sign of weakening bullish momentum. The support area around 3,358 USD is under pressure, and a break below this level could trigger a drop toward 3,280 USD.
On the news front, the FOMC has reaffirmed its hawkish stance, making no mention of a rate cut despite signs of slowing economic growth. This has strengthened the USD, placing additional downward pressure on gold.
In summary, XAUUSD is on the verge of breaking its bullish structure. If current support fails, sellers may take full control of the market.
XAUUSD Trade Idea:
Position: SELL if price breaks below 3,358 USD
Target: 3,304 – 3,280 USD
Stop Loss: Above 3,400 USD

ETHUSD Is Very Bullish! Buy!
Take a look at our analysis for ETHUSD.
Time Frame: 10h
Current Trend: Bullish
Sentiment: Oversold (based on 7-period RSI)
Forecast: Bullish
The market is on a crucial zone of demand 2,508.60.
The oversold market condition in a combination with key structure gives us a relatively strong bullish signal with goal 2,717.66 level.
P.S
Please, note that an oversold/overbought condition can last for a long time, and therefore being oversold/overbought doesn't mean a price rally will come soon, or at all.
Disclosure: I am part of Trade Nation's Influencer program and receive a monthly fee for using their TradingView charts in my analysis.
Like and subscribe and comment my ideas if you enjoy them!

XAUUSD – Gold breaks trend: Is a deeper fall coming?Gold has officially broken the ascending trendline that had held since mid-May, confirming a breakdown in the bullish structure. After failing to breach the strong resistance at 3,445 USD, selling pressure intensified, driving the price down to 3,390 USD — yesterday’s closing level.
This move came right after the FOMC meeting, where the Fed held interest rates steady but maintained a hawkish tone, strengthening the USD and weighing heavily on gold.
While tensions in the Middle East continue to offer short-term support, U.S. monetary policy remains the dominant force. Without a fresh geopolitical shock, gold appears increasingly vulnerable to a deeper correction.

BTCUSDT – Price Poised to Break Descending ChannelBTCUSDT has been maintaining a series of higher lows since early May, consistently rebounding from its dynamic support trendline. Currently, the price is consolidating just below the descending channel resistance around the 108,000 USDT level. A clear double-bottom pattern accompanied by solid recovery momentum suggests a potential breakout from the prolonged correction phase that has persisted throughout June.
If BTC breaks above the descending trendline, the next target could be the major resistance zone near 113,000 USDT.
On the news front, the market is reacting positively to BlackRock’s announcement of expanding investment in crypto ETF products. At the same time, recent soft U.S. inflation data has strengthened expectations that the Fed may halt its tightening cycle. This combination is improving investor sentiment and driving renewed interest in risk assets like Bitcoin.

EURUSD – Bullish momentum fades, downside pressure intensifiesEURUSD formed a lower high near 1.1613, signaling weakening bullish momentum. Price is now testing a key trendline, and a break below 1.1473 could confirm a bearish move toward 1.1350.
Market sentiment is currently dominated by the Fed’s hawkish stance following the latest FOMC meeting, where the central bank kept rates unchanged but expressed readiness to hike further if necessary. Meanwhile, although tensions in the Middle East are escalating, they have yet to deliver a significant blow to the USD.
Given the current backdrop, EURUSD is under considerable pressure and may soon break its bullish structure unless strong buying interest re-emerges.


Leg Based Continuation Possible Play📈 USD/JPY – 15M Chart (Scalping to Intraday Play)
🕒 June 17, 2025 – Lower Time Frame Setup
Bias: Short-term Bullish Continuation
Structure: Leg-Based Impulse-Pullback-Impulse Model
🔹 Market Structure Insight:
Price recently completed a strong impulsive move (LEG 1) on increasing volume.
After a shallow correction into dynamic support (EMA 60), price is attempting a LEG 2 continuation.
EMAs (15 & 60) have bullish alignment and acted as dynamic support.
✅ Buy #1 – Market Execution
Entry: 144.91 (current or recent execution)
SL: 144.38
TP: 145.25
R:R ≈ 1
🧠 Entry based on continuation after bullish flag breakout
✅ Price held higher low structure + EMA confluence
✅ Buy Limit #2 – Pullback Opportunity
Entry: 144.59 (highlighted zone between EMAs)
SL: 144.37
TP: 145.25
R:R ≈ 3.0
🧠 Designed to catch a retest into the mid-range and volume base
➕ Risk minimized, reward optimized
➕ Matches possible HL (higher low) setup if price dips before pushing
⚠️ Risk Management Notes:
Overlap with prior resistance zone just above TP (145.20–145.40): partial TP or trail advised.
Invalidated if price closes below 144.30 on strong volume (breaks structure).
If LEG 2 matches or exceeds LEG 1 in strength, extended targets above 145.50 possible.

Another RR1 Buy Setup on Gold
TimeFrame: m30
Position Type: BUY
Entry Price: 3395
Stop Loss: 3372
Take Profit: 3417
R/R: 1
Please Manage Your Risk...
Trading is a risk management game...

BUY USDCADIn todays session we are anticipating a bullish dollar. Our entry for buys on USDCAD are at 1.35728 our targets are 1.36484 and stops below 1.35535. Use proper risk management. Stay safe

Gold holds above key zoneAfter breaking the major resistance at 3,392 USD — a level that had been rejected multiple times in the past — XAUUSD is undergoing a slight pullback to retest the newly established support. The bullish reaction in this area suggests that buyers are still in control of the trend.
In the current context, U.S. retail sales have fallen more than expected, reinforcing expectations that the Fed may cut interest rates soon. This puts pressure on the dollar and benefits gold.
The primary scenario is a bounce from the current support toward the next resistance area near 3,481 USD. The 3,392 USD level has now become a key support to sustain the ongoing bullish structure.

EURUSD: Awaiting Confirmation to Continue the UptrendThe EUR/USD pair closed yesterday at 1.1550, moving within the 1.1526–1.1558 range. The euro continues its bullish trend, driven by U.S. inflation data coming in lower than expected, which increases expectations of an upcoming rate cut by the Fed. In addition, geopolitical tensions in the Middle East—particularly between Israel and Iran—have slightly weakened the U.S. dollar, providing additional support to the euro.
From a technical perspective, the price is currently correcting toward the 1.1480 area, where the ascending trendline converges with the exponential moving average. This is a key support zone. If it holds and a clear bullish signal emerges, EURUSD could rebound and move toward the 1.1610 resistance level.
Main scenario: look for buying opportunities around 1.1480 if a bullish confirmation appears, targeting 1.1610.
Alternative scenario: if the 1.1480 level is broken, the short-term uptrend could be at risk.

Gold Soars – Heading Towards 3,500 USD/ounce?Gold prices closed yesterday at 3,457.7 USD/ounce, up 0.12% from the previous day, fluctuating between 3,453.7 USD and 3,458.1 USD/ounce, marking the highest level in the past two months.
XAU/USD is currently maintaining an uptrend within a well-defined price channel, with strong support at the 3,390–3,400 range. After a short correction, the price could continue to rise if it holds above the EMA34, with the next target towards the 3,445–3,460 range and further up to 3,500 USD/ounce.
This upward momentum is supported by geopolitical tensions in the Middle East, particularly between Israel and Iran, driving demand for gold as a safe-haven asset. U.S. CPI data lower than expected has also increased expectations of a Fed rate cut, alongside central banks increasing gold reserves, all contributing to the continued rise in gold prices.

$OSCR - Finally Breaking Out! 125% UpsideThis move is nothing when talking about what's to come for a company this undervalued!
NYSE:OSCR is going to go PARABOLIC!!!

GOLD Will Go Higher From Support! Buy!
Take a look at our analysis for GOLD.
Time Frame: 9h
Current Trend: Bullish
Sentiment: Oversold (based on 7-period RSI)
Forecast: Bullish
The market is testing a major horizontal structure 3,395.19.
Taking into consideration the structure & trend analysis, I believe that the market will reach 3,467.28 level soon.
P.S
Overbought describes a period of time where there has been a significant and consistent upward move in price over a period of time without much pullback.
Disclosure: I am part of Trade Nation's Influencer program and receive a monthly fee for using their TradingView charts in my analysis.
Like and subscribe and comment my ideas if you enjoy them!

AUDUSD Will Go Up From Support! Long!
Please, check our technical outlook for AUDUSD.
Time Frame: 2h
Current Trend: Bullish
Sentiment: Oversold (based on 7-period RSI)
Forecast: Bullish
The market is approaching a key horizontal level 0.653.
Considering the today's price action, probabilities will be high to see a movement to 0.657.
P.S
Please, note that an oversold/overbought condition can last for a long time, and therefore being oversold/overbought doesn't mean a price rally will come soon, or at all.
Disclosure: I am part of Trade Nation's Influencer program and receive a monthly fee for using their TradingView charts in my analysis.
Like and subscribe and comment my ideas if you enjoy them!

AUDJPY Will Go Higher! Buy!
Here is our detailed technical review for AUDJPY.
Time Frame: 6h
Current Trend: Bullish
Sentiment: Oversold (based on 7-period RSI)
Forecast: Bullish
The market is approaching a significant support area 94.496.
The underlined horizontal cluster clearly indicates a highly probable bullish movement with target 95.595 level.
P.S
The term oversold refers to a condition where an asset has traded lower in price and has the potential for a price bounce.
Overbought refers to market scenarios where the instrument is traded considerably higher than its fair value. Overvaluation is caused by market sentiments when there is positive news.
Disclosure: I am part of Trade Nation's Influencer program and receive a monthly fee for using their TradingView charts in my analysis.
Like and subscribe and comment my ideas if you enjoy them!

GBPAUD Will Go Up! Long!
Take a look at our analysis for GBPAUD.
Time Frame: 2h
Current Trend: Bullish
Sentiment: Oversold (based on 7-period RSI)
Forecast: Bullish
The market is on a crucial zone of demand 2.074.
The oversold market condition in a combination with key structure gives us a relatively strong bullish signal with goal 2.083 level.
P.S
We determine oversold/overbought condition with RSI indicator.
When it drops below 30 - the market is considered to be oversold.
When it bounces above 70 - the market is considered to be overbought.
Disclosure: I am part of Trade Nation's Influencer program and receive a monthly fee for using their TradingView charts in my analysis.
Like and subscribe and comment my ideas if you enjoy them!

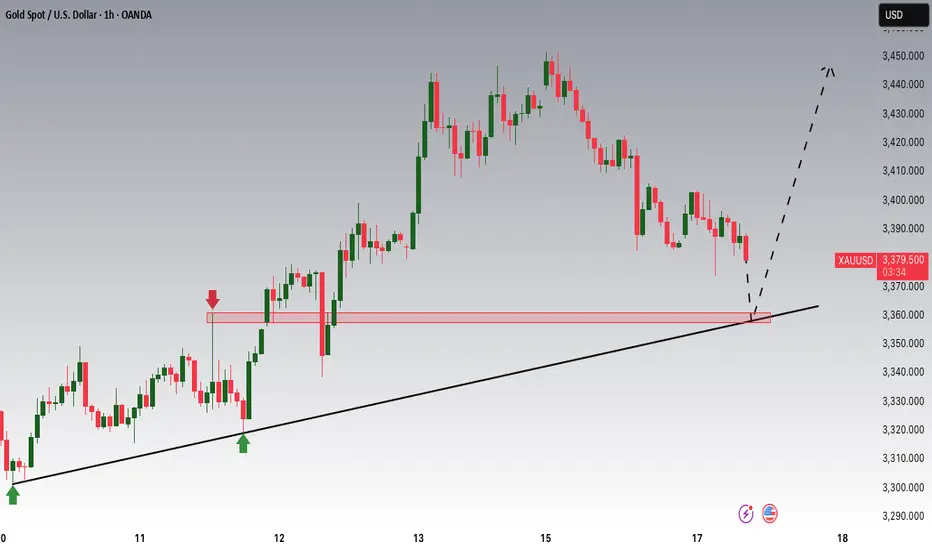
Gold is Nearing an Important Support!!Hey Traders, in today's trading session we are monitoring XAUUSD for a buying opportunity around 3,360 zone, Gold is trading in an uptrend and currently is in a correction phase in which it is approaching the trend at 3,360 support and resistance area.
Trade safe, Joe.
EURUSD – Healthy pullback within a strong uptrendEURUSD is undergoing a temporary correction after a strong bullish move, but the pair remains above key technical support levels such as the EMA34 and the ascending trendline. The 1.15070 zone now acts as a potential buy area—where demand may return if confirmation signals appear.
Market sentiment is leaning toward the expectation that the Fed may cut interest rates soon due to weaker-than-expected U.S. retail sales data, which has weighed on the USD and indirectly supported the euro. Meanwhile, the ECB continues to maintain a stable policy stance, further reinforcing the current bullish trend.
If the price holds above the green support zone, the next target could be around 1.15940. If this support breaks, traders should watch price behavior at the trendline before making the next trading decision.

Gold is giving up a Set up! Been waiting for this set up. But trying to remain disciplined on this one. I Need to see a sweep of lows at this point in order to be interested in the buy. Once we see that its on. Until then we sit on hands and wait.
