EUR/JPY BULLS WILL DOMINATE THE MARKET|LONG
Hello, Friends!
We are going long on the EUR/JPY with the target of 161.704 level, because the pair is oversold and will soon hit the support line below. We deduced the oversold condition from the price being near to the lower BB band. However, we should use low risk here because the 1W TF is red and gives us a counter-signal.
Disclosure: I am part of Trade Nation's Influencer program and receive a monthly fee for using their TradingView charts in my analysis.
✅LIKE AND COMMENT MY IDEAS✅
Buy

EURUSD Potential UpsidesHey Traders, in today's trading session we are monitoring EURUSD for a buying opportunity around 1.14400 zone, EURUSD is trading in an uptrend and currently is in a correction phase in which it is approaching the trend at 1.14400 support and resistance area.
Trade safe, Joe.

sand long longterm spot "🌟 Welcome to Golden Candle! 🌟
We're a team of 📈 passionate traders 📉 who love sharing our 🔍 technical analysis insights 🔎 with the TradingView community. 🌎
Our goal is to provide 💡 valuable perspectives 💡 on market trends and patterns, but 🚫 please note that our analyses are not intended as buy or sell recommendations. 🚫
Instead, they reflect our own 💭 personal attitudes and thoughts. 💭
Follow along and 📚 learn 📚 from our analyses! 📊💡"

Victorias Secret (VSCO) Bull Run Incoming? Insider Signals?Victorias Secret & Co. (VSCO) Based in Ohio, USA has recently seen a dip in asset value to $16, but recovery could be imminent.
On the 1 Day chart both a bullish RSI divergence and CVD divergence seems to be forming. The DMI appears to show the bearish directional movement is slowing, and the ADX still remains above 20.
In march Insiders were reported to have purchased 1.92M shares. Conversely only 20,000 shares were sold by Insiders (Robinhood Analytics). Insider activity may indicate undisclosed company confidence.
The order book shows a decent number of open interest for $25.00. Subsequently this price target is located near key resistance areas that in my opinion, price will most likely touch in the near future.
Earnings are set to be released in May and traders and institutions may begin to price in fundamental factors before the report .
Given the above technical and fundamental signals, insider activity, and approaching earnings report. My hypothesis is bullish with a price target of $25.00 before 06/20/2025.
Will tariffs and politics stop VSCO's upwards movement? Or do the technicals and Insider moves signal a current discounted buy?
Disclaimer: Not financial advice.

GOOG Alphabet Options Ahead of EarningsIf you haven`t bought GOOG before the previous rally:
Now analyzing the options chain and the chart patterns of GOOG Alphabet prior to the earnings report this week,
I would consider purchasing the 170usd strike price Calls with
an expiration date of 2025-7-18,
for a premium of approximately $4.35.
If these options prove to be profitable prior to the earnings release, I would sell at least half of them.

AAL American Airlines Group Options Ahead of EarningsIf you haven`t bought the dip on AAL:
Now analyzing the options chain and the chart patterns of AAL American Airlinesprior to the earnings report this week,
I would consider purchasing the 9usd strike price Puts with
an expiration date of 2025-5-2,
for a premium of approximately $0.44.
If these options prove to be profitable prior to the earnings release, I would sell at least half of them.

CMCSA Comcast Corporation Options Ahead of EarningsAnalyzing the options chain and the chart patterns of CMCSA Comcast Corporation prior to the earnings report this week,
I would consider purchasing the 37.5usd strike price Calls with
an expiration date of 2025-9-19,
for a premium of approximately $1.35.
If these options prove to be profitable prior to the earnings release, I would sell at least half of them.

MRK Merck Options Ahead of EarningsAnalyzing the options chain and the chart patterns of MRK Merck prior to the earnings report this week,
I would consider purchasing the 80usd strike price Calls with
an expiration date of 2026-1-16,
for a premium of approximately $8.50.
If these options prove to be profitable prior to the earnings release, I would sell at least half of them.

TSLA Tesla Options Ahead of EarningsIf you haven`t bought TSLA before the recent rally:
Now analyzing the options chain and the chart patterns of LMT Lockheed Martin Corporation prior to the earnings report this week,
I would consider purchasing the 230usd strike price Puts with
an expiration date of 2025-4-25,
for a premium of approximately $10.70.
If these options prove to be profitable prior to the earnings release, I would sell at least half of them.

MBLY Mobileye Global Options Ahead of EarningsAnalyzing the options chain and the chart patterns of MBLY Mobileye Global prior to the earnings report this week,
I would consider purchasing the 14usd strike price Calls with
an expiration date of 2026-1-16,
for a premium of approximately $2.12.
If these options prove to be profitable prior to the earnings release, I would sell at least half of them.

SLB Schlumberger Limited Options Ahead of EarningsIf you haven`t sold SLB before the previous earnings:
Now analyzing the options chain and the chart patterns of SLB Schlumberger Limited prior to the earnings report this week,
I would consider purchasing the 27.50usd strike price Puts with
an expiration date of 2026-3-20,
for a premium of approximately $2.01.
If these options prove to be profitable prior to the earnings release, I would sell at least half of them.

CHTR Charter Communications Options Ahead of EarningsAnalyzing the options chain and the chart patterns of CHTR Charter Communications prior to the earnings report this week,
I would consider purchasing the 360usd strike price Calls with
an expiration date of 2025-9-19,
for a premium of approximately $22.35.
If these options prove to be profitable prior to the earnings release, I would sell at least half of them.

USDCAD Will Go Up From Support! Long!
Take a look at our analysis for USDCAD.
Time Frame: 3h
Current Trend: Bullish
Sentiment: Oversold (based on 7-period RSI)
Forecast: Bullish
The market is on a crucial zone of demand 1.385.
The oversold market condition in a combination with key structure gives us a relatively strong bullish signal with goal 1.396 level.
P.S
Please, note that an oversold/overbought condition can last for a long time, and therefore being oversold/overbought doesn't mean a price rally will come soon, or at all.
Disclosure: I am part of Trade Nation's Influencer program and receive a monthly fee for using their TradingView charts in my analysis.
Like and subscribe and comment my ideas if you enjoy them!

GBPAUD Will Go Up! Buy!
Here is our detailed technical review for GBPAUD.
Time Frame: 1D
Current Trend: Bullish
Sentiment: Oversold (based on 7-period RSI)
Forecast: Bullish
The market is trading around a solid horizontal structure 2.090.
The above observations make me that the market will inevitably achieve 2.149 level.
P.S
We determine oversold/overbought condition with RSI indicator.
When it drops below 30 - the market is considered to be oversold.
When it bounces above 70 - the market is considered to be overbought.
Disclosure: I am part of Trade Nation's Influencer program and receive a monthly fee for using their TradingView charts in my analysis.
Like and subscribe and comment my ideas if you enjoy them!

Gold accelerates thanks to US-China tensions and a weakening USDGold prices continued to show their strength when breaking through the old peak of 3,434 USD and moving up to 3,460 USD/ounce, equivalent to an increase of more than 61 USD in less than a day, showing that safe-haven buying is overwhelming the entire market. On the 1H chart, the bullish structure is clear with EMA34 and EMA89 maintaining a strong slope, the price continuously increased after short technical corrections, confirming that the uptrend is still very sustainable. In terms of news, gold is being supported by two factors: trade tensions between the US and China escalated after Beijing decided to sharply reduce crude oil imports from the US and shift to Canada, increasing global risk concerns.
At the same time, global stock markets fell sharply, while President Donald Trump's controversial statement asking the FED to immediately cut interest rates sent the USD to a 3-year low. The combination of political uncertainty, risk aversion and a weak greenback has created a strong catalyst for gold to continue to be sought after by investors. In the short term, the $3,440–$3,450 zone could be new support, and if it holds above this zone, gold could continue to extend its rally towards the psychological $3,500 level.

Gold targets $3,475: Strong wave has not stoppedThe world gold price's uptrend continues to hold steady after a technical correction to the support zone around $3,336 - $3,369 (Fibonacci 0.5 - 0.618), coinciding with EMA34 on the H4 frame, showing that buying power is still dominant in the main trend. The price has now recovered to around $3,395/ounce and continues to maintain a strong uptrend pattern with the target of expanding to the $3,475 zone - the 100% Fibonacci level of the most recent uptrend. The convergence between the technical structure and macro news creates a solid foundation for the uptrend: safe-haven money continues to flow into gold amid geopolitical instability, a weakening USD and market sentiment worried about risks from US economic policy.
Comments from experts such as Sean Lusk and Christopher Vecchio also reinforce the bullish outlook, especially as speculative money and central bank buying have yet to show signs of cooling off. With the EMA34 and EMA89 maintaining a positive slope, the possibility of the price continuing to climb to the target area of $3,475 is very high, before a short-term correction to test the breakout zone may appear. In the short term, any correction to the $3,370–$3,390 area is seen as an opportunity to increase long positions following the trend.

LMT Lockheed Martin Corporation Options Ahead of EarningsIf you haven`t bought LMT before the recent rally:
Now analyzing the options chain and the chart patterns of LMT Lockheed Martin Corporation prior to the earnings report this week,
I would consider purchasing the 490usd strike price Calls with
an expiration date of 2025-9-19,
for a premium of approximately $18.35.
If these options prove to be profitable prior to the earnings release, I would sell at least half of them.

USOIL Will Move Higher! Long!
Take a look at our analysis for USOIL.
Time Frame: 12h
Current Trend: Bullish
Sentiment: Oversold (based on 7-period RSI)
Forecast: Bullish
The market is testing a major horizontal structure 63.114.
Taking into consideration the structure & trend analysis, I believe that the market will reach 68.050 level soon.
P.S
Overbought describes a period of time where there has been a significant and consistent upward move in price over a period of time without much pullback.
Disclosure: I am part of Trade Nation's Influencer program and receive a monthly fee for using their TradingView charts in my analysis.
Like and subscribe and comment my ideas if you enjoy them!

GOLD Is Very Bullish! Long!
Please, check our technical outlook for GOLD.
Time Frame: 1h
Current Trend: Bullish
Sentiment: Oversold (based on 7-period RSI)
Forecast: Bullish
The price is testing a key support 3,327.58.
Current market trend & oversold RSI makes me think that buyers will push the price. I will anticipate a bullish movement at least to 3,360.10 level.
P.S
The term oversold refers to a condition where an asset has traded lower in price and has the potential for a price bounce.
Overbought refers to market scenarios where the instrument is traded considerably higher than its fair value. Overvaluation is caused by market sentiments when there is positive news.
Disclosure: I am part of Trade Nation's Influencer program and receive a monthly fee for using their TradingView charts in my analysis.
Like and subscribe and comment my ideas if you enjoy them!

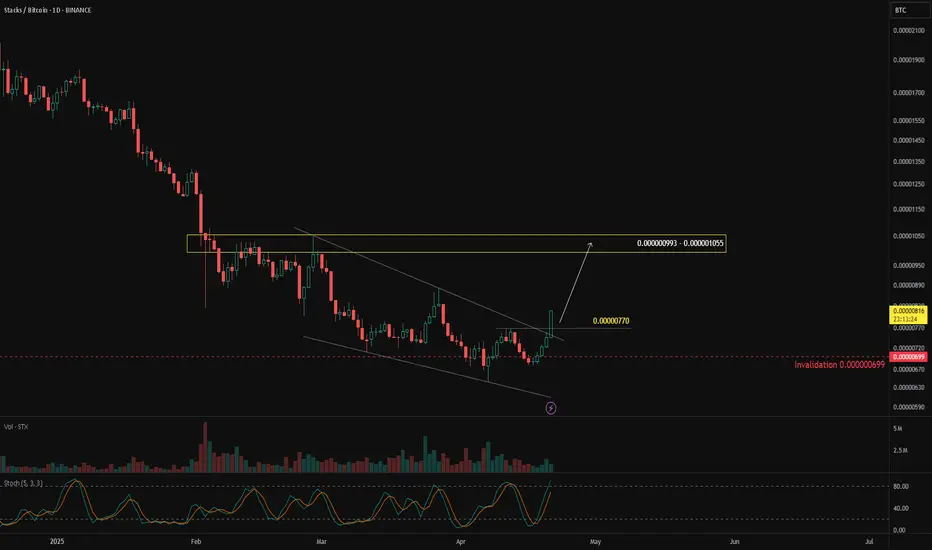
Will STX Outperform Bitcoin?In the crypto market, if you want to beat the market, your benchmark is $CRYPTO:BTCUSD. That means to outperform the crypto market, you need to outperform Bitcoin.
One way to measure this is by watching crypto/BTC pairs, such as $BINANCE:STXBTC. If $BINANCE:STXBTCgoes up, it means STX is stronger than BTC. If it goes down, BTC is stronger than STX.
On the daily chart, BINANCE:STXBTC has been moving downward, but over the past month, sellers seem to be losing momentum—indicated by a falling wedge reversal pattern.
A bullish breakout above 0.000000770 would confirm the pattern, with a potential upside target at 0.000000993 – 0.000001055. This scenario remains valid as long as price holds above 0.000000699.
Ripple Breakout and Potential RetraceHey Traders, in today's trading session we are monitoring Ripple for a buying opportunity around 1.9800 zone, XRP was trading in a downtrend and successfully managed to break it out. Currently is in a correction phase in which it is approaching the retrace area at 1.98000 support and resistance area.
Trade safe, Joe.

Avalanche Potential UpsidesHey Traders, in today's trading session we are monitoring Avalanche for a buying opportunity around 19.20 zone, Avalanche is trading in an uptrend and currently is in a correction phase in which it is approaching the trend at 19.20 support and resistance area.
Trade safe, Joe.

NG1! BUYERS WILL DOMINATE THE MARKET|LONG
NG1! SIGNAL
Trade Direction: long
Entry Level: 3.247
Target Level: 3.717
Stop Loss: 2.932
RISK PROFILE
Risk level: medium
Suggested risk: 1%
Timeframe: 1D
Disclosure: I am part of Trade Nation's Influencer program and receive a monthly fee for using their TradingView charts in my analysis.
✅LIKE AND COMMENT MY IDEAS✅
