EURJPY Is Going Up! Buy!
Here is our detailed technical review for EURJPY.
Time Frame: 6h
Current Trend: Bullish
Sentiment: Oversold (based on 7-period RSI)
Forecast: Bullish
The market is trading around a solid horizontal structure 161.112.
The above observations make me that the market will inevitably achieve 162.396 level.
P.S
Please, note that an oversold/overbought condition can last for a long time, and therefore being oversold/overbought doesn't mean a price rally will come soon, or at all.
Disclosure: I am part of Trade Nation's Influencer program and receive a monthly fee for using their TradingView charts in my analysis.
Like and subscribe and comment my ideas if you enjoy them!
Buy
EUR/USD BULLS WILL DOMINATE THE MARKET|LONG
Hello, Friends!
The BB lower band is nearby so EUR-USD is in the oversold territory. Thus, despite the downtrend on the 1W timeframe I think that we will see a bullish reaction from the support line below and a move up towards the target at around 1.110.
Disclosure: I am part of Trade Nation's Influencer program and receive a monthly fee for using their TradingView charts in my analysis.
✅LIKE AND COMMENT MY IDEAS✅
CAD/CHF SENDS CLEAR BULLISH SIGNALS|LONG
Hello, Friends!
Previous week’s red candle means that for us the CAD/CHF pair is in the downtrend. And the current movement leg was also down but the support line will be hit soon and lower BB band proximity will signal an oversold condition so we will go for a counter-trend long trade with the target being at 0.613.
Disclosure: I am part of Trade Nation's Influencer program and receive a monthly fee for using their TradingView charts in my analysis.
✅LIKE AND COMMENT MY IDEAS✅
gold after the inertviez of jerome todayAs of April 4, 2025, gold prices have experienced significant volatility amid escalating trade tensions and market uncertainties. Following President Trump's announcement of new tariffs and China's subsequent retaliation with 34% tariffs on U.S. goods, investors have increasingly turned to gold as a safe-haven asset. This surge in demand propelled gold prices to record highs, surpassing $3,130 per troy ounce
NAS100 Will Go Up From Support! Long!
Please, check our technical outlook for NAS100.
Time Frame: 1h
Current Trend: Bullish
Sentiment: Oversold (based on 7-period RSI)
Forecast: Bullish
The market is approaching a key horizontal level 18,411.4.
Considering the today's price action, probabilities will be high to see a movement to 18,773.6.
P.S
We determine oversold/overbought condition with RSI indicator.
When it drops below 30 - the market is considered to be oversold.
When it bounces above 70 - the market is considered to be overbought.
Disclosure: I am part of Trade Nation's Influencer program and receive a monthly fee for using their TradingView charts in my analysis.
Like and subscribe and comment my ideas if you enjoy them!
AUD/CAD BUYERS WILL DOMINATE THE MARKET|LONG
AUD/CAD SIGNAL
Trade Direction: long
Entry Level: 0.880
Target Level: 0.889
Stop Loss: 0.874
RISK PROFILE
Risk level: medium
Suggested risk: 1%
Timeframe: 1h
Disclosure: I am part of Trade Nation's Influencer program and receive a monthly fee for using their TradingView charts in my analysis.
✅LIKE AND COMMENT MY IDEAS✅
NZD/JPY BEST PLACE TO BUY FROM|LONG
Hello, Friends!
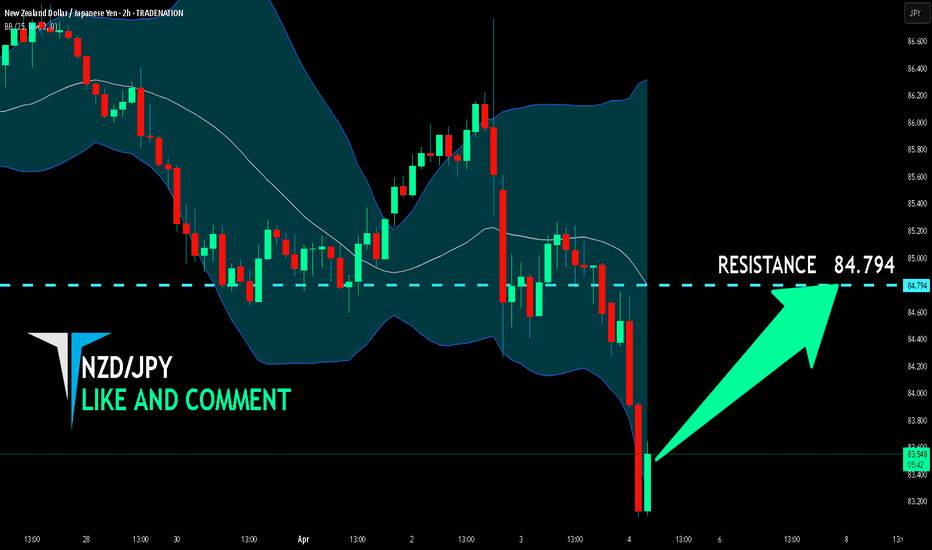
NZD/JPY pair is in the uptrend because previous week’s candle is green, while the price is evidently falling on the 2H timeframe. And after the retest of the support line below I believe we will see a move up towards the target above at 84.794 because the pair is oversold due to its proximity to the lower BB band and a bullish correction is likely.
Disclosure: I am part of Trade Nation's Influencer program and receive a monthly fee for using their TradingView charts in my analysis.
✅LIKE AND COMMENT MY IDEAS✅
OptionsMastery: Looks like a good buy on GOOGLE!🔉Sound on!🔉
📣Make sure to watch fullscreen!📣
Thank you as always for watching my videos. I hope that you learned something very educational! Please feel free to like, share, and comment on this post. Remember only risk what you are willing to lose. Trading is very risky but it can change your life!
Gbpcad SellPrice has been making LL pointing to strength in downtrend and now price closed below the oh so very important 1.85172. the stop i wouldve like to put it above the last high but its ok im still is comfortable with it due to the volume nice scalp based on how fast the trade should hit tp or sl.
atom buy midterm"🌟 Welcome to Golden Candle! 🌟
We're a team of 📈 passionate traders 📉 who love sharing our 🔍 technical analysis insights 🔎 with the TradingView community. 🌎
Our goal is to provide 💡 valuable perspectives 💡 on market trends and patterns, but 🚫 please note that our analyses are not intended as buy or sell recommendations. 🚫
Instead, they reflect our own 💭 personal attitudes and thoughts. 💭
Follow along and 📚 learn 📚 from our analyses! 📊💡"
Driven Brands Holdings: Dominating North America's Auto ServicesKey arguments in support of the idea.
A potential rise in U.S. car prices may positively impact the company’s sales.
DRVN is expanding its footprint in the essential automotive services market, simultaneously reducing its car wash segment with more cyclical sales.
Investment Thesis
Driven Brands Holdings Inc. (DRVN) is the largest automotive services company in North America, operating an increasing network of approximately 5,200 franchise, independently owned businesses operated by the company across 49 U.S. states and 13 other countries. The company has a footprint in all major automotive service areas, catering to both retail and commercial customers. Its main business segments include car maintenance and repair, express car wash, bodywork and paint services.
U.S. car import tariffs, introduced in March, support the trend of an increasing average age of cars on U.S. roads and may lead to higher car prices. These factors may contribute positively to DRVN’s revenue growth. On April 3, a 25% tariff on cars imported to the U.S. will take effect, and by May 3, equivalent tariffs on automotive components will be implemented. These tariffs may disrupt automakers’ production processes due to a reconfiguration of production chains. Only half of the 16 million new cars sold annually in the U.S. are produced domestically, while other autos could be subject to these tariffs. Production disruptions may result in price increases for both new and used cars. Many consumers may delay purchasing new cars, opting instead to spend more on maintaining their current vehicles. The new factors support the general long-term trend to an increasing average age of cars on U.S. roads. In 2000, the average vehicle age in the U.S. was 8.9 years; it has now grown to 12.6 years and continues to rise annually. Despite this, the total number of vehicles on U.S. roads is also steadily increasing at an average annual rate of about 1% over the past two decades. Combined with the new tariffs, the overall growth of the automotive aftermarket is likely to boost DRVN’s revenue in the upcoming years.
Driven Brands continues successfully shifting its focus to essential automotive services. After 2023, the company began reducing its ownership of standalone car washes while expanding its Take 5 Oil Change locations. Take 5 Oil Change provides rapid oil change services within 10 minutes, allowing drivers to remain in their cars. In March, reports have indicated that Driven Brands plans to sell its Take 5 Car Wash chain. We suppose this deal will accelerate the expansion of the Take 5 Oil Change segment and enable the company to allocate some proceeds toward debt reduction, potentially decreasing debt service expenses by up to 20%.
The valuation of DRVN stock, compared to its peers, shows potential for growth. DRVN’s valuation corresponds to 14 projected earnings for 2025, aligning with the average valuation among U.S. car dealers. Nonetheless, DRVN’s potential for revenue growth in the coming years is anticipated to surpass that of its peers. In the last three quarters alone, the Take 5 segment has demonstrated a sequential revenue increase of 10%, accounting for about 60% of the company’s total sales.
We suppose that Driven Brands Holdings Inc. (DRVN) shares may exhibit positive momentum in the near term.
The target price for DRVN shares over a two-month horizon is $19.90, with a “Buy” rating. We suggest setting a stop-loss at $15.50.
GOLD Is Bullish! Buy!
Here is our detailed technical review for GOLD.
Time Frame: 3h
Current Trend: Bullish
Sentiment: Oversold (based on 7-period RSI)
Forecast: Bullish
The market is trading around a solid horizontal structure 3,128.13.
The above observations make me that the market will inevitably achieve 3,167.36 level.
P.S
We determine oversold/overbought condition with RSI indicator.
When it drops below 30 - the market is considered to be oversold.
When it bounces above 70 - the market is considered to be overbought.
Disclosure: I am part of Trade Nation's Influencer program and receive a monthly fee for using their TradingView charts in my analysis.
Like and subscribe and comment my ideas if you enjoy them!
EURUSD Is Very Bullish! Long!
Take a look at our analysis for EURUSD.
Time Frame: 1D
Current Trend: Bullish
Sentiment: Oversold (based on 7-period RSI)
Forecast: Bullish
The market is testing a major horizontal structure 1.101.
Taking into consideration the structure & trend analysis, I believe that the market will reach 1.123 level soon.
P.S
Overbought describes a period of time where there has been a significant and consistent upward move in price over a period of time without much pullback.
Disclosure: I am part of Trade Nation's Influencer program and receive a monthly fee for using their TradingView charts in my analysis.
Like and subscribe and comment my ideas if you enjoy them!
USDJPY Is Going Up! Buy!
Please, check our technical outlook for USDJPY.
Time Frame: 1D
Current Trend: Bullish
Sentiment: Oversold (based on 7-period RSI)
Forecast: Bullish
The market is approaching a key horizontal level 146.824.
Considering the today's price action, probabilities will be high to see a movement to 149.538.
P.S
Please, note that an oversold/overbought condition can last for a long time, and therefore being oversold/overbought doesn't mean a price rally will come soon, or at all.
Disclosure: I am part of Trade Nation's Influencer program and receive a monthly fee for using their TradingView charts in my analysis.
Like and subscribe and comment my ideas if you enjoy them!
GBPJPY Will Grow! Long!
Here is our detailed technical review for GBPJPY.
Time Frame: 1D
Current Trend: Bullish
Sentiment: Oversold (based on 7-period RSI)
Forecast: Bullish
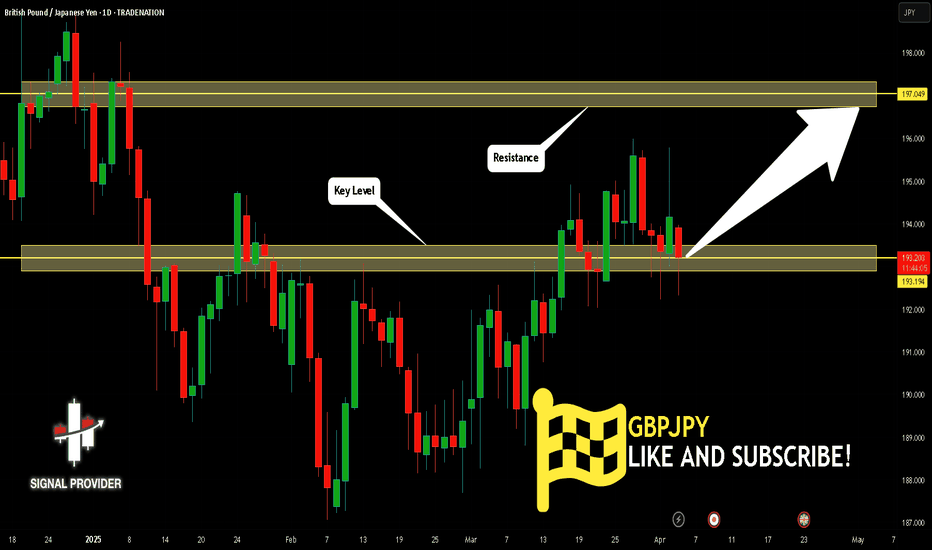
The market is approaching a significant support area 193.194.
The underlined horizontal cluster clearly indicates a highly probable bullish movement with target 197.049 level.
P.S
The term oversold refers to a condition where an asset has traded lower in price and has the potential for a price bounce.
Overbought refers to market scenarios where the instrument is traded considerably higher than its fair value. Overvaluation is caused by market sentiments when there is positive news.
Disclosure: I am part of Trade Nation's Influencer program and receive a monthly fee for using their TradingView charts in my analysis.
Like and subscribe and comment my ideas if you enjoy them!
USOIL BULLS ARE STRONG HERE|LONG
USOIL SIGNAL
Trade Direction: long
Entry Level: 69.37
Target Level: 70.64
Stop Loss: 68.53
RISK PROFILE
Risk level: medium
Suggested risk: 1%
Timeframe: 2h
Disclosure: I am part of Trade Nation's Influencer program and receive a monthly fee for using their TradingView charts in my analysis.
✅LIKE AND COMMENT MY IDEAS✅
AUD/JPY BULLS WILL DOMINATE THE MARKET|LONG
Hello, Friends!
AUD/JPY pair is trading in a local downtrend which we know by looking at the previous 1W candle which is red. On the 8H timeframe the pair is going down too. The pair is oversold because the price is close to the lower band of the BB indicator. So we are looking to buy the pair with the lower BB line acting as support. The next target is 93.929 area.
Disclosure: I am part of Trade Nation's Influencer program and receive a monthly fee for using their TradingView charts in my analysis.
✅LIKE AND COMMENT MY IDEAS✅
GBP/AUD BEST PLACE TO BUY FROM|LONG
Hello, Friends!
It makes sense for us to go long on GBP/AUD right now from the support line below with the target of 2.061 because of the confluence of the two strong factors which are the general uptrend on the previous 1W candle and the oversold situation on the lower TF determined by it’s proximity to the lower BB band.
Disclosure: I am part of Trade Nation's Influencer program and receive a monthly fee for using their TradingView charts in my analysis.
✅LIKE AND COMMENT MY IDEAS✅
GBP/NZD BULLISH BIAS RIGHT NOW| LONG
Hello, Friends!
GBP/NZD is making a bearish pullback on the 1H TF and is nearing the support line below while we are generally bullish biased on the pair due to our previous 1W candle analysis, thus making a trend-following long a good option for us with the target being the 2.264 level.
Disclosure: I am part of Trade Nation's Influencer program and receive a monthly fee for using their TradingView charts in my analysis.
✅LIKE AND COMMENT MY IDEAS✅


