BNB/USDT – Bullish Channel Breakout in Play?
#BNB/USDT #Analysis
Description
---------------------------------------------------------------
📉 Pair: BNB/USDT (Binance, 1W Chart)
📊 Analysis by: VectorAlgo
Binance Coin (BNB) has been trading within a well-defined ascending channel, showing strong bullish momentum since mid-2023. The price is currently near the mid-range of the channel and is attempting to push higher.
- Ascending Channel: BNB is trending upwards, respecting both support and resistance levels within this channel.
- Moving Averages: The price is holding above key EMAs, reinforcing bullish sentiment.
- Potential Upside Target: If the trend continues, the next major resistance could be between $900–$1,100.
- Support Levels: If a pullback occurs, watch for support near $500–$550 as a potential buy zone.
Long Entry: Dips into the lower trendline (~$550) could be buying opportunities.
Breakout Play: If BNB clears the mid-channel resistance around $730, a move toward $900+ is likely.
Risk Management: A breakdown below the channel (~$500) could invalidate the bullish setup.
📢 What’s Your Outlook?
Is BNB heading toward new highs, or will we see a deeper pullback? Drop your thoughts below!
---------------------------------------------------------------
Enhance, Trade, Grow
---------------------------------------------------------------
Feel free to share your thoughts and insights. Don't forget to like and follow us for more trading ideas and discussions.
Best Regards,
VectorAlgo
Buy

SOL/USDT – Key Support Test: Will It Hold or Break?#SOL/USDT #Analysis
Description
---------------------------------------------------------------
Solana (SOL) has been in a strong uptrend since late 2023, but recent price action suggests a key test of support around the $115–$135 zone. This level was previously a major resistance and is now being retested as support.
Moving Averages: The price has dipped below the shorter EMAs but is still above the long-term moving average.
Bearish Momentum: The recent sharp drop suggests selling pressure, but the support zone could lead to a reversal.
Two Scenarios:
🔼 Bullish: If the support holds, SOL could bounce back towards $180+ and continue its uptrend.
🔽 Bearish: If support breaks, a deeper correction to $43–$60 is possible.
📊 Trading Strategy
Long Entry: If a strong bounce occurs from the $115–$135 zone, targeting $180+.
Short Entry: A confirmed breakdown below $115 could trigger a move toward $60 or lower.
---------------------------------------------------------------
Enhance, Trade, Grow
---------------------------------------------------------------
Feel free to share your thoughts and insights. Don't forget to like and follow us for more trading ideas and discussions.
Best Regards,
VectorAlgo

USD/JPY BULLS ARE GAINING STRENGTH|LONG
Hello, Friends!
Previous week’s red candle means that for us the USD/JPY pair is in the downtrend. And the current movement leg was also down but the support line will be hit soon and lower BB band proximity will signal an oversold condition so we will go for a counter-trend long trade with the target being at 150.465.
Disclosure: I am part of Trade Nation's Influencer program and receive a monthly fee for using their TradingView charts in my analysis.
✅LIKE AND COMMENT MY IDEAS✅

NZD/USD BEST PLACE TO BUY FROM|LONG
Hello, Friends!
NZD/USD is trending up which is clear from the green colour of the previous weekly candle. However, the price has locally plunged into the oversold territory. Which can be told from its proximity to the BB lower band. Which presents a classical trend following opportunity for a long trade from the support line below towards the supply level of 0.573.
Disclosure: I am part of Trade Nation's Influencer program and receive a monthly fee for using their TradingView charts in my analysis.
✅LIKE AND COMMENT MY IDEAS✅

SEI Poised for a Breakout After Bold 23andMe Acquisition Bid !Sei (SEI), the innovative layer-1 blockchain designed for high-speed trading and decentralized finance (DeFi), is flashing strong bullish signals both fundamentally and technically. The recent news that the Sei Foundation is exploring the acquisition of 23andMe, the leading personal genomics company, has sparked excitement in the market. If successful, this strategic move could position Sei at the forefront of the multi-billion-dollar genomic data industry — combining blockchain’s security and transparency with the rapidly growing demand for data privacy.
Why This Is Huge
23andMe recently filed for Chapter 11 bankruptcy protection, opening the door for a potential buyout. The Sei Foundation’s plan to migrate genetic data onto the blockchain would give individuals direct control over their data, allowing them to decide how it’s used and even monetize it. This taps into a massive and underserved market where data security and privacy are becoming critical issues.
Bullish Chart Setup
From a technical perspective, Sei’s chart is showing signs of a major breakout:
✅ Double Bottom: SEI has recently formed a clear double bottom pattern, signaling a strong reversal from recent lows. This is a classic bullish pattern that suggests the selling pressure has been exhausted and buyers are stepping in.
✅ Falling Wedge: SEI is also breaking out of a falling wedge, a high-probability bullish formation. Falling wedges typically lead to strong upside moves as downward momentum fades and buying pressure builds up.
✅ Volume Increasing: Recent spikes in volume confirm that smart money could be accumulating in anticipation of a breakout.
Perfect Storm for a Rally
With a bullish technical setup aligning with a game-changing fundamental catalyst, Sei could be on the verge of a major breakout. A successful acquisition of 23andMe would not only give Sei real-world utility in the health data sector but also drive increased adoption and network activity. If SEI clears key resistance levels, this combination of technical strength and strategic growth could send the token to new highs.
Sei isn’t just another DeFi project — it's positioning itself to be a leader at the intersection of blockchain, health data, and privacy.
This could be the beginning of a powerful new trend for SEI. 🚀

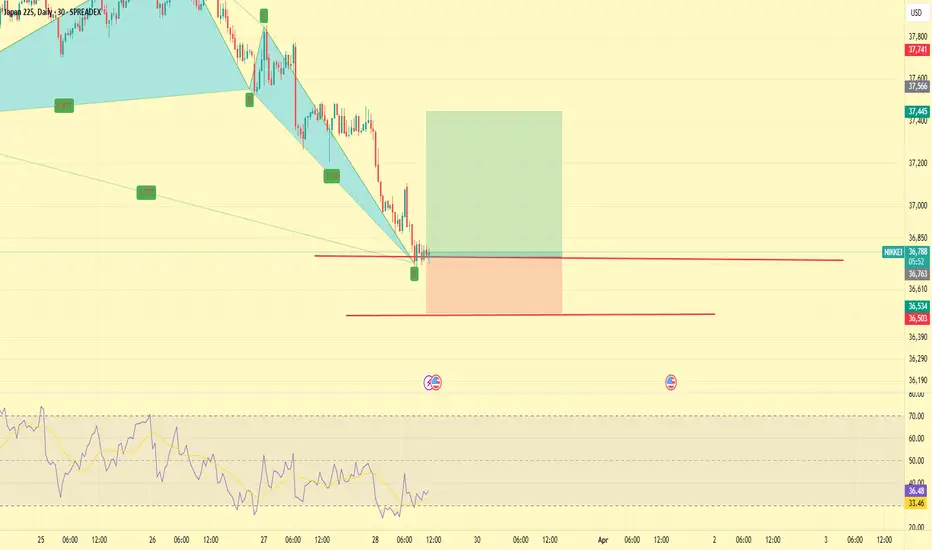
JPN225 Short 1. This trade is against the trend
2. There are multiple patterns on all timeframes
3. This trade is oversold on all timeframes
4. There is a triple bottom on M15 with divergence
5. 200 Pip stop loss
6. First target at M15 overbought since this is counter trend
GOLD Will Go Up From Support! Buy!
Here is our detailed technical review for GOLD.
Time Frame: 3h
Current Trend: Bullish
Sentiment: Oversold (based on 7-period RSI)
Forecast: Bullish
The market is approaching a significant support area 3,076.15.
The underlined horizontal cluster clearly indicates a highly probable bullish movement with target 3,102.53 level.
P.S
Overbought describes a period of time where there has been a significant and consistent upward move in price over a period of time without much pullback.
Disclosure: I am part of Trade Nation's Influencer program and receive a monthly fee for using their TradingView charts in my analysis.
Like and subscribe and comment my ideas if you enjoy them!

AUD/USD BULLISH BIAS RIGHT NOW| LONG
AUD/USD SIGNAL
Trade Direction: long
Entry Level: 0.629
Target Level: 0.631
Stop Loss: 0.627
RISK PROFILE
Risk level: medium
Suggested risk: 1%
Timeframe: 1h
Disclosure: I am part of Trade Nation's Influencer program and receive a monthly fee for using their TradingView charts in my analysis.
✅LIKE AND COMMENT MY IDEAS✅

POTENTIAL LONG ENTRY - 3100 MAJOR ALGORITHMIC TARGETPrice is likely to re-test NY's lunch break range and grab liquidity below the 13:30PM NY EST low.
Asia should distribute strongly toward new ATHs and London would likely retest current resistance levels and bounce as well.
NY might enter at fest highs to create yet another manipulation to the downside to grab a discount price level.
I'm expecting price to reach 3100 within the next 2 weeks.
--
GOOD LUCK

3100 - 3150 NEXTClassic bullish continuation pattern.
Expect accumulation phases along the way, BUT NOT retracements.
Good luck

From MAGA to DEFI: The Trump Crypto ConnectionThe relationship between decentralized finance (DeFi), the Trump family, and Kevin O’Leary in 2025 centers around their public involvement in the crypto and blockchain space, particularly highlighted by their participation in events like DeFi World 2025 and specific DeFi projects tied to their names or influence.
The Trump family, notably Donald Trump Jr. and former President Donald Trump, has increasingly engaged with DeFi and cryptocurrency. Donald Trump Jr. spoke at the DeFi World 2025 Conference in Denver on February 26, alongside Kevin O’Leary, signaling a growing interest in blockchain’s potential to shape finance. Posts on X from DeFi confirm their appearances, with Trump Jr. scheduled at 3:00 PM and O’Leary at 3:45 PM, reflecting a shared platform to promote DeFi’s future. Beyond this event, the Trump family is linked to World Liberty Financial (WLFI), a DeFi project launched in September 2024. WLFI aims to democratize crypto lending and borrowing while reinforcing the U.S. dollar’s dominance, operating on Aave’s v3 protocol.
Although Donald Trump and his family are not direct operators of WLFI, the project leverages the Trump brand, with 70% of its token supply held by insiders and 75% of revenues directed to DT Marks DEFI LLC, a Trump-connected entity. Trump himself has pushed pro-crypto policies, including banning central bank digital currencies and exploring a national crypto stockpile, aligning with DeFi’s ethos of decentralization.
Kevin O’Leary, a Canadian investor and “Shark Tank” star, has been a vocal DeFi advocate since at least 2021, when he invested heavily in DeFi Ventures (later renamed WonderFi), targeting 4.5–8% yields on crypto assets. His participation in DeFi World 2025 alongside Trump Jr. underscores his ongoing commitment. O’Leary sees DeFi as a way to bypass financial middlemen, predicting it could transform trading within years. His practical involvement contrasts with the Trump family’s more symbolic and policy-driven engagement, though both share a bullish stance on crypto’s future.
I`m extremely bullish on this coin at this level.

BTC Bitcoin Price Target by Year EndSeveral factors support a bullish outlook for Bitcoin (BTC) to reach $97,500 by the end of the year:
Institutional Adoption and Treasury Investments: Companies like GameStop are incorporating Bitcoin into their treasury reserves, following the lead of firms such as MicroStrategy. GameStop plans to raise $1.3 billion for Bitcoin purchases, indicating growing corporate confidence in BTC as a store of value.
Supportive Regulatory Environment: The U.S. administration has pledged to make the country the "undisputed Bitcoin superpower and crypto capital of the world." Plans include introducing clear regulations for stablecoins and market structures, aiming to stimulate investment and innovation in the crypto sector.
Positive Price Forecasts: Analysts have set bullish targets for Bitcoin, with some predicting prices ranging from $120,000 to $150,000 by year-end. These projections are based on factors like supply shocks and increased institutional adoption.
Seasonal Trends and Market Liquidity: Historically, the second quarter has been favorable for Bitcoin, with increased market liquidity and investor interest. Currently, approximately $31.8 billion in "dry powder" is poised to enter the crypto markets, potentially driving prices higher.
Finite Supply and Growing Demand: Bitcoin's capped supply of 21 million coins, coupled with rising global demand, supports its long-term value appreciation. Its growing acceptance and technological advancements, despite evolving regulatory landscapes, bolster its investment appeal.
These factors collectively suggest a favorable environment for Bitcoin to approach or surpass the $97,500 mark by year-end.

NVDA NVIDIA Price Target by Year-EndNVIDIA Corporation (NVDA) remains a dominant force in the AI and semiconductor markets, with its forward price-to-earnings (P/E) ratio currently at 19.37—a reasonable valuation considering its growth trajectory and market position.
NVIDIA’s leadership in the AI sector, particularly through its cutting-edge GPUs, has driven strong demand from data centers, cloud providers, and AI developers. The company’s recent product launches, including the Hopper and Blackwell architectures, have further solidified its competitive edge.
Despite recent market volatility, NVIDIA's consistent revenue growth and expanding profit margins support the bullish case. The current P/E of 19.37 reflects a balanced risk-reward profile, suggesting that the stock is not overvalued despite its impressive performance.
A price target of $145 by year-end reflects approximately 15% upside from current levels, driven by sustained AI demand and growing market penetration. Investors should watch for quarterly earnings reports and updates on AI chip demand, as these will likely act as key catalysts for upward momentum.

BNB - New Higher High is formingBINANCE:BNBUSDT (1W CHART) Technical Analysis Update
BNB is currently trading at $639 and showing overall bullish sentiment. Price is trading inside the channel and new Higher High is expected to formed soon if this bullish trend continues.
Entry level: $639
Stop Loss Level: $
TakeProfit 1: $685
TakeProfit 2: $750
TakeProfit 3: $850
TakeProfit 4: $900
TakeProfit 5: $999
Max Leverage: 2x
Position Size: 1% of capital
Remember to set your stop loss.
Follow our TradingView account for more technical analysis updates. | Like, share, and comment your thoughts.
Cheers
GreenCrypto

SUI - Falling Wedge - Confirmed BreakoutBINANCE:SUIUSDT (1D CHART) Technical Analysis Update
SUI is currently trading at $2.77 and showing overall bullish sentiment
Price has formed nice falling wedge and we see a clear breakout from the falling wedge pattern. I'm expecting this trend to hold and read the resistance level around $5.3
Entry level: $2.7
Stop Loss Level: $1.8
TakeProfit 1: $3.1
TakeProfit 2: $4
TakeProfit 3: $5.3
Max Leverage: 2x
Position Size: 1% of capital
Remember to set your stop loss.
Follow our TradingView account for more technical analysis updates. | Like, share, and comment your thoughts.
Cheers
GreenCrypto

AMD Advanced Micro Devices Price TargetAdvanced Micro Devices (AMD) has positioned itself as a major player in the semiconductor industry, capitalizing on growing demand for high-performance computing, artificial intelligence (AI), and data center solutions. As of now, AMD’s forward price-to-earnings (P/E) ratio stands at 17.12, indicating that the stock is trading at a reasonable valuation compared to its growth potential.
AMD has benefited from the increasing adoption of AI-driven solutions, particularly through its MI300 series of AI accelerators, which have gained traction among major cloud service providers. The company’s expansion into the data center market has also been a key growth driver, with strong sales in EPYC processors contributing to revenue growth.
Furthermore, AMD's strategic acquisition of Xilinx has strengthened its position in the FPGA (Field-Programmable Gate Array) market, enhancing its ability to offer diversified and high-margin products. This, combined with improving margins and consistent product innovation, positions AMD for steady financial performance in the coming quarters.
Given AMD’s solid fundamentals, growing market share in AI and data centers, and attractive valuation at a 17.12 forward P/E, a price target of $125 by the end of the year appears achievable. This would represent approximately 15% upside from current levels, driven by continued revenue growth and expanding profit margins.
