AUDCAD Is Going Up! Long!
Take a look at our analysis for AUDCAD.
Time Frame: 12h
Current Trend: Bullish
Sentiment: Oversold (based on 7-period RSI)
Forecast: Bullish
The market is approaching a key horizontal level 0.896.
Considering the today's price action, probabilities will be high to see a movement to 0.905.
P.S
Please, note that an oversold/overbought condition can last for a long time, and therefore being oversold/overbought doesn't mean a price rally will come soon, or at all.
Disclosure: I am part of Trade Nation's Influencer program and receive a monthly fee for using their TradingView charts in my analysis.
Like and subscribe and comment my ideas if you enjoy them!
Buy

EUR/USD BULLISH BIAS RIGHT NOW| LONG
Hello, Friends!
EUR/USD pair is in the uptrend because previous week’s candle is green, while the price is obviously falling on the 1D timeframe. And after the retest of the support line below I believe we will see a move up towards the target above at 1.179 because the pair is oversold due to its proximity to the lower BB band and a bullish correction is likely.
Disclosure: I am part of Trade Nation's Influencer program and receive a monthly fee for using their TradingView charts in my analysis.
✅LIKE AND COMMENT MY IDEAS✅

AUDUSD Analysis – Bullish Structure Still IntactAUDUSD is trading within a clear ascending channel on the H4 chart. After dropping from the FVG zone around 0.65800, price has reacted well to the lower boundary support near 0.64650.
Currently, price action suggests the potential formation of a short-term bottom. If this level holds and the pair rebounds, the next target could be the red FVG zone near 0.65400.
Recent Supporting News:
U.S. consumer confidence slightly weakened, causing the dollar to cool off — offering technical rebound support for AUD.
Trading Strategy:
Prefer short-term Buys near 0.64650 if a confirmed bounce appears, with target around 0.65400. Be cautious if price breaks below the ascending channel.
Do you think AUD will continue to rise within this bullish channel?

XAUUSD – Is gold getting ready to bounce?Right now, gold is reacting around the 3,280 support zone after breaking down from its previous ascending channel. While the broader trend is still under bearish pressure, the recently released JOLTS data came in lower than expected, signaling that the U.S. labor market may be cooling — a mildly positive sign for gold.
From a technical view, price is showing signs of forming a short-term bottom near 3,229 and is starting to rebound. If gold can hold above this support and break through 3,339, a recovery toward the 3,360–3,400 zone could unfold.
That said, this bounce is likely just a technical correction. Without more bearish news for the dollar, gold still risks being rejected around the FVG area and heading lower again.
Trading idea: Consider short-term Buy opportunities if price stays above 3,280 and forms a clear reversal pattern. Stop-loss below 3,229. Short-term targets: 3,339–3,360.
What about you? Leaning towards buying the dip or staying with the downtrend?

USDJPY – Bearish Pressure Builds Near Channel TopUSDJPY is approaching strong resistance around 149.900, a level that has repeatedly triggered price rejections. The ABCD structure suggests the current bullish correction may be nearing completion. If price fails to break above this zone, selling pressure could emerge.
On the news front, Japan’s core inflation remains elevated, reinforcing expectations that the BOJ will maintain its current stance. Meanwhile, the U.S. dollar is losing momentum after a series of mixed economic data releases.
Strategy: Consider SELL opportunities if clear reversal signals appear near 149.900. A short-term target lies around the 148.200 support zone. A confirmed break below this level could signal the start of a deeper bearish move.

GBPJPY – Bearish pressure returns near ascending channel supportGBPJPY is trading close to the lower trendline of the ascending channel, with the 197.400 zone acting as a key support. A breakdown below this level could trigger stronger bearish momentum.
On the news front, Japan’s CPI remains solid, strengthening the yen. Meanwhile, the British pound is under pressure after recent consumer spending data showed signs of weakness, raising concerns over the UK’s economic outlook.
Strategy: If the price breaks below 197.400 and fails to bounce back, consider SELL setups in line with the bearish trend. If it rebounds, watch the reaction around the 199.100 zone for signs of recovery confirmation.

EUR/USD Slips Again – Just a Pullback or More to Come?Hey everyone! Great to have you back for another market chat today.
As of writing, EUR/USD remains under significant bearish pressure, currently trading near 1.154 — marking a rather gloomy start to the new trading week. The euro is clearly struggling to attract buying interest as traders reassess the ECB’s stance and digest the newly announced EU–US trade agreement. Meanwhile, the U.S. dollar is gaining momentum, flipping the trend unexpectedly.
From a technical perspective, EUR/USD is showing clear weakness. The pair has broken below both its rising wedge and previous uptrend line, with candles closing firmly lower — a strong sign that the bears are in control.
In my personal view, I expect EUR/USD to continue sliding toward the next two support zones, although a minor pullback could occur first as part of a typical correction.
But what do you think? Is this just a dip… or the start of something bigger for EUR/USD? Let me know your take in the comments!

DeFi’s Make-or-Break MomentThe spotlight today is on TOTALDEFI, an index that could become one of the most exciting charts in the crypto market.
While many altcoins look heavy under selling pressure, TOTALDEFI is holding firmly at the 61.8% Fibonacci support near 116B. This zone is often a turning point where strong reversals begin. If the level continues to hold, we might see a 20% move to the upside, signaling renewed strength in the DeFi sector.
This price action could be a sign that decentralized finance projects are ready to lead the next market phase.

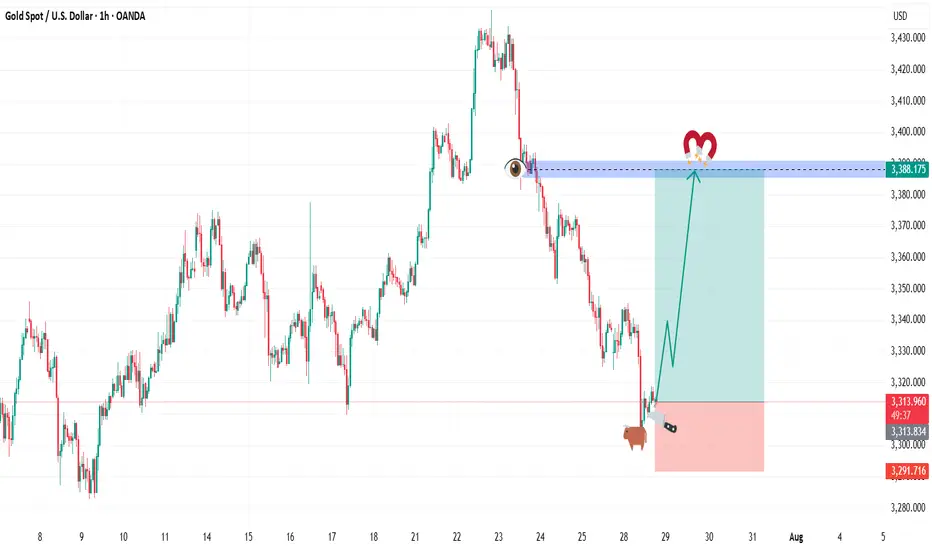
BUY GOLDIn todays session we are monitoring GOLD for buy opportunities. We have out entry at 3313.600 and stops below 3291 our target is at 3388.175 and higher. Use proper risk management. Cheers to you all.
SILVER Will Grow! Buy!
Please, check our technical outlook for SILVER.
Time Frame: 8h
Current Trend: Bullish
Sentiment: Oversold (based on 7-period RSI)
Forecast: Bullish
The market is approaching a significant support area 3,817.6.
The underlined horizontal cluster clearly indicates a highly probable bullish movement with target 3,930.1 level.
P.S
The term oversold refers to a condition where an asset has traded lower in price and has the potential for a price bounce.
Overbought refers to market scenarios where the instrument is traded considerably higher than its fair value. Overvaluation is caused by market sentiments when there is positive news.
Disclosure: I am part of Trade Nation's Influencer program and receive a monthly fee for using their TradingView charts in my analysis.
Like and subscribe and comment my ideas if you enjoy them!

XAUUSD under pressure – Is the downtrend just beginning?Hello everyone! What do you think about XAUUSD right now?
Yesterday, XAUUSD extended its decline and is currently trading around 3,315 USD.
The recent drop in gold prices was mainly triggered by a stronger US dollar, following a trade agreement between the US and the European Union (EU).
From a technical perspective, the short-term outlook shows the beginning of a new downtrend. Notably, we see a bearish crossover in the EMA 34 and 89, along with a break of the previous upward trendline—both reinforcing the current bearish momentum.
If there’s a pullback before the next leg down, the 0.5–0.618 Fibonacci retracement zone (which also aligns with resistance and the EMAs) will be a key area to watch. This could be an ideal level for potential trade setups.
Looking ahead, the next support target is around 3,300 USD. If that level breaks, gold might aim for the 32XX region.
Do you think XAUUSD will continue to fall? Drop your thoughts in the comments!
Wishing you successful and profitable trades!

USOIL LONG FROM SUPPORT
USOIL SIGNAL
Trade Direction: long
Entry Level: 65.00
Target Level: 66.37
Stop Loss: 64.09
RISK PROFILE
Risk level: medium
Suggested risk: 1%
Timeframe: 2h
Disclosure: I am part of Trade Nation's Influencer program and receive a monthly fee for using their TradingView charts in my analysis.
✅LIKE AND COMMENT MY IDEAS✅

XAUUSD – Technical rebound, but downside risks remainOn the H4 chart, gold is bouncing slightly from the 3,323 support zone after a sharp drop. However, price remains within a large descending channel and is approaching a dense cluster of bearish FVGs around 3,360–3,374.
News context:
– US GDP and ADP data beat expectations, boosting the USD and adding pressure on gold.
– JOLTS dipped but remains above 7 million → limited support for gold.
– Thailand–Cambodia conflict provides only short-term impact.
Strategy: Favor SELL if price retests 3,360–3,374 and gets rejected. Downside targets: 3,323 or lower.
Main trend remains bearish, unless gold breaks above the descending channel.

Bullish Sentiment Returns to Gold?Hello everyone, what are your thoughts on XAUUSD?
From a technical perspective, XAUUSD has just retested its long-term ascending trendline and formed a bullish reaction candle, suggesting that buying pressure may be returning.
Recently, a survey of 206 investors revealed that market sentiment remains optimistic, with 66% expecting gold prices to continue rising, 19% predicting a decline, and 15% anticipating a sideways market.
What do you think? Share your opinion in the comments!

Gold Under Pressure – Temporary Pullback or Start of a DowntrendHello everyone, great to see you again.
Today, let’s focus on the bearish factors surrounding gold. At the time of writing, gold is trading around 3,331 USD, down 50 pips on the day, continuing its downward correction since the end of last week.
Within just a few days, gold has plunged from its peak of 3,433 USD—losing nearly 100 USD per ounce.
This sharp drop is largely driven by profit-taking and market anticipation ahead of key economic data next week, including U.S. interest rate decisions, inflation, and job reports.
This week is packed with critical updates: growth figures, inflation stats, employment numbers, and monetary policy decisions from major central banks—all of which could significantly impact gold’s next move.
According to a recent survey, 36% of analysts expect gold to fall further, while retail investors remain optimistic about a rebound.
For now, the market is clearly in a correction phase. Caution is advised.
What do you think—will gold bounce back or continue to drop?

USD/JPY(20250729)Today's AnalysisMarket news:
After gold prices soared to an all-time high of more than $3,500 an ounce in April, the latest report from the Commodity Futures Trading Commission (CFTC) showed that fund managers have increased their bullish bets to the highest level in 16 weeks.
Technical analysis:
Today's buy and sell boundaries:
148.19
Support and resistance levels:
149.23
148.84
148.59
147.78
147.53
147.14
Trading strategy:
If the price breaks through 148.59, consider buying, the first target price is 148.84
If the price breaks through 148.19, consider selling, the first target price is 147.78

EURUSD Potential UpsidesHey Traders, in today's trading session we are monitoring EURUSD for a buying opportunity around 1.16 zone, EURUSD is trading in an uptrend and currently is in a correction phase in which it is approaching the trend at 1.16 support and resistance area.
Trade safe, Joe.

Potentially, A Safer Way To Long The EURUSDIn contrast to my previous outlook, the current price action suggests an increased probability of a deeper bearish move—potentially invalidating the buy zone marked out in the previous analysis. This sudden change is largely driven by the prospect of untapped liquidity residing beneath that zone, reinforcing the well-known market principle that price seeks out liquidity before committing to directional moves.
Given this development, the newly identified zone on the chart emerges as a more technically sound and reliable area from which to anticipate bullish interest. It aligns better with the broader liquidity profile and offers a stronger base for accumulation. Traders may opt to wait for confirmations within this zone or, depending on their risk appetite, consider executing buy positions upon price entry.
As always, patience and clarity are key as we allow price to reveal its intention.
Fingers crossed 🤞
Wishing you all a focused and profitable trading week.
Catch you on the next one. 🫡

GBPAUD Is Going Up! Long!
Here is our detailed technical review for GBPAUD.
Time Frame: 6h
Current Trend: Bullish
Sentiment: Oversold (based on 7-period RSI)
Forecast: Bullish
The market is on a crucial zone of demand 2.055.
The oversold market condition in a combination with key structure gives us a relatively strong bullish signal with goal 2.070 level.
P.S
Please, note that an oversold/overbought condition can last for a long time, and therefore being oversold/overbought doesn't mean a price rally will come soon, or at all.
Disclosure: I am part of Trade Nation's Influencer program and receive a monthly fee for using their TradingView charts in my analysis.
Like and subscribe and comment my ideas if you enjoy them!

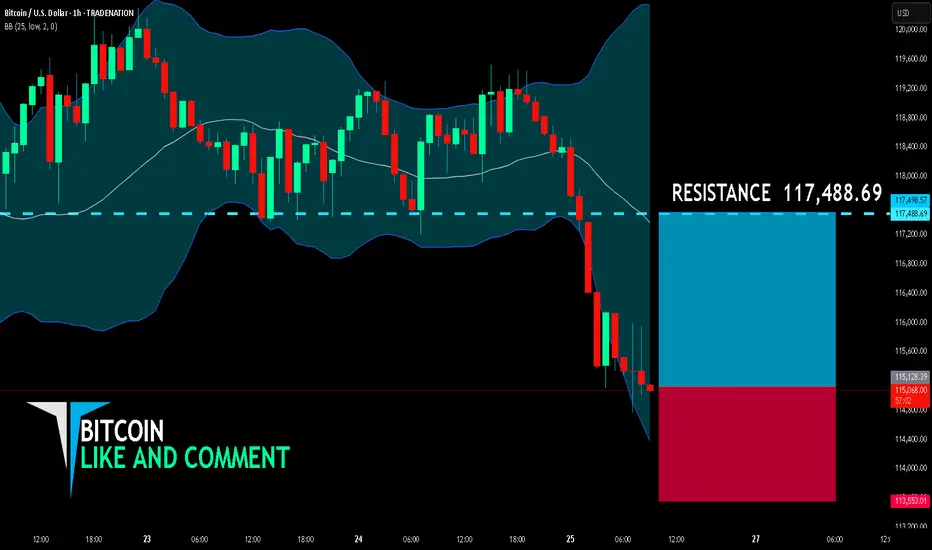
BITCOIN BULLS ARE GAINING STRENGTH|LONG
BITCOIN SIGNAL
Trade Direction: long
Entry Level: 115,128.39
Target Level: 117,488.69
Stop Loss: 113,553.01
RISK PROFILE
Risk level: medium
Suggested risk: 1%
Timeframe: 1h
Disclosure: I am part of Trade Nation's Influencer program and receive a monthly fee for using their TradingView charts in my analysis.
✅LIKE AND COMMENT MY IDEAS✅
NZD/CAD BULLS ARE GAINING STRENGTH|LONG
NZD/CAD SIGNAL
Trade Direction: long
Entry Level: 0.820
Target Level: 0.824
Stop Loss: 0.817
RISK PROFILE
Risk level: medium
Suggested risk: 1%
Timeframe: 2h
Disclosure: I am part of Trade Nation's Influencer program and receive a monthly fee for using their TradingView charts in my analysis.
✅LIKE AND COMMENT MY IDEAS✅

XAUUSD – The assassin returnsGold is showing a weak reaction around the 3,375 zone — a previous supply area — with RSI dipping into oversold territory but failing to bounce significantly. The chart reveals layered FVG traps, hinting at a potential -1.5% drop toward 3,324 within the next 18 hours.
Bearish catalyst: The U.S. jobless claims have dropped to a 3-month low → labor market remains strong → Fed likely to keep interest rates high → stronger USD, weaker gold.
Preferred setup:
SELL if price gets rejected at 3,375
SL: 3,390
TP: 3,324 – 3,310

USD/JPY(20250728)Today's AnalysisMarket news:
Trump announced that the US and Europe reached a trade agreement: 15% tariffs on the EU, $600 billion in investment in the US, zero tariffs on the US by EU countries, the EU will purchase US military equipment, and will purchase US energy products worth $750 billion. However, the US and Europe have different opinions on whether the 15% tariff agreement covers medicines and steel and aluminum. Von der Leyen: 15% tariff rate is the best result that the European Commission can achieve.
US Secretary of Commerce: The deadline for tariff increase on August 1 will not be extended. The United States will determine the tariff policy on chips within two weeks.
Technical analysis:
Today's buying and selling boundaries:
147.47
Support and resistance levels:
148.58
148.17
147.90
147.04
146.77
146.35
Trading strategy:
If the price breaks through 147.90, consider buying, the first target price is 148.17
If the price breaks through 147.47, consider selling, the first target price is 147.04
