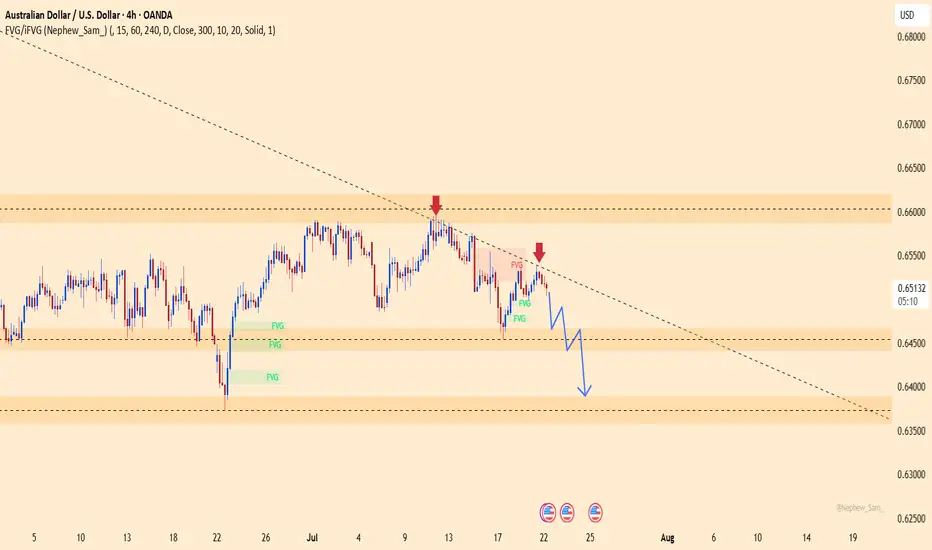
AUDUSD – Sellers taking over, the drop is on!This pair just got slapped hard at the descending trendline, right as it hit a familiar resistance zone. No more doubts – buyers are losing steam, and sellers are waiting to strike.
Market sentiment from Down Under is shaking, with weak economic signals piling up. Meanwhile, the mighty U.S. dollar is reclaiming the spotlight after gold’s flashy surge. The tide has turned!
Unless a miracle shows up, AUDUSD is set to dive deeper – and this is the perfect stage for traders who thrive on strong downtrends.
Sellers are in position – are you ready to join the ride?
Buy
Gold Sees Mild Increase as USD WeakensGold ended Friday's session with a slight increase, regaining the 3350 USD level and recovering over 100 pips by the end of the day.
The weakening of the US Dollar (USD) allowed XAU/USD to rise modestly. Concerns about US President Donald Trump's erratic trade policies and their potential impact on the global economy further supported the precious metal.
In the short term, the technical chart shows gold breaking out of the downward channel and starting an upward wave. The price is currently adjusting at 3350 USD, which coincides with the 0.618 Fibonacci retracement level and the EMA zone, suggesting the potential for further price increases from this level, with targets towards key resistance levels.
Key resistance levels: 3160, 3172, and 3378 USD.
Support zones: 3350, 3340, 3331 USD.
Gold rallies to 4-week high as dollar and yields tumbleHello traders, what are your thoughts on gold today?
Gold prices are heating up again in the global market as the US dollar weakens and Treasury yields drop. At the time of writing, gold has surged by 50 dollars, reaching 3,390 USD per ounce — its highest level in four weeks.
The sharp decline in the US dollar is one of the main drivers behind gold’s impressive rally. The USD Index, which had risen significantly last week, lost momentum and fell sharply in overnight trading. Meanwhile, the yield on 10-year US Treasury bonds has dropped to around 4.3%, down from recent highs, increasing gold's appeal as a non-yielding asset.
Market sentiment is also being shaped by broader macroeconomic factors. Crude oil futures have dipped slightly, trading around 67 USD per barrel, reflecting investor caution amid global economic uncertainty. These combined forces have created a favorable environment for gold's strong upward movement.
If the dollar continues to weaken and bond yields remain low, gold could sustain its bullish trend. However, traders should remain alert to potential volatility driven by upcoming US Federal Reserve policy moves and key economic data releases, such as inflation reports and GDP growth figures, which may impact gold's trajectory.
NZDUSD Will Go Higher From Support! Long!
Please, check our technical outlook for NZDUSD.
Time Frame: 12h
Current Trend: Bullish
Sentiment: Oversold (based on 7-period RSI)
Forecast: Bullish
The market is trading around a solid horizontal structure 0.596.
The above observations make me that the market will inevitably achieve 0.602 level.
P.S
Please, note that an oversold/overbought condition can last for a long time, and therefore being oversold/overbought doesn't mean a price rally will come soon, or at all.
Disclosure: I am part of Trade Nation's Influencer program and receive a monthly fee for using their TradingView charts in my analysis.
Like and subscribe and comment my ideas if you enjoy them!

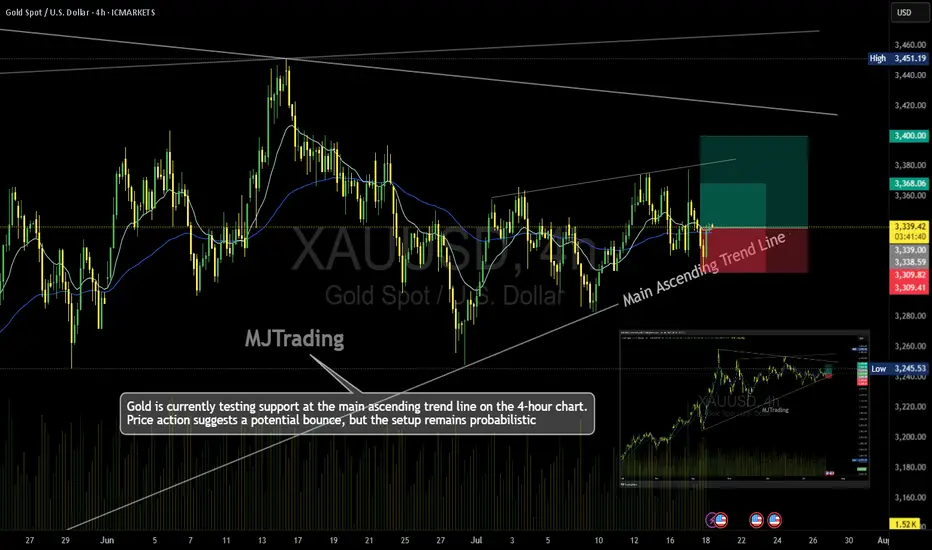
Gold (XAU/USD) – 4H Time Frame Trade Idea📈MJTrading:
Gold is currently testing support at the main ascending trend line on the 4-hour chart. Price action suggests a potential bounce, but the setup remains probabilistic—ideal for traders who operate on higher time frames and manage risk with discipline.
🔹 Trade Setup
Entry: 3340
Stop Loss: 3309
Take Profit 1: 3368
Take Profit 2: 3400
🔍 Technical Context
Price is respecting the long-standing trend line, hinting at bullish continuation.
Risk-reward ratio is favorable, especially for swing traders.
A break below the trend line invalidates the setup—hence the tight SL.
⚠️ Note: While the trend supports upside potential, failure to hold the trend line could trigger deeper retracement. Trade the probabilities, not the certainties.
In case it's not shown properly on your monitor because of different resolutions:
Psychology Always Maters:
#MJTrading #Gold #XAUUSD #Trend #Trendline #Forex #Chart #ChartAnalysis #Buy #Long
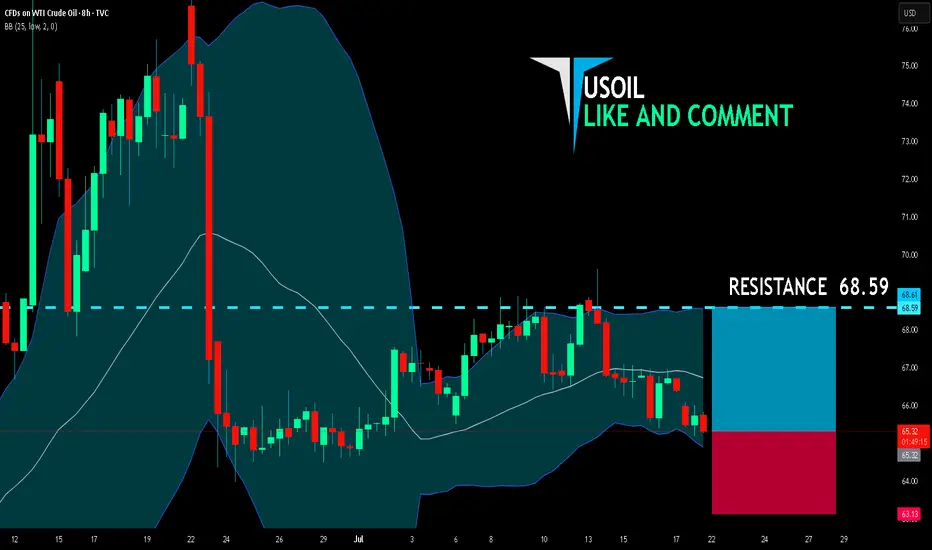
USOIL BULLS ARE STRONG HERE|LONG
USOIL SIGNAL
Trade Direction: long
Entry Level: 65.32
Target Level: 68.59
Stop Loss: 63.13
RISK PROFILE
Risk level: medium
Suggested risk: 1%
Timeframe: 8h
Disclosure: I am part of Trade Nation's Influencer program and receive a monthly fee for using their TradingView charts in my analysis.
✅LIKE AND COMMENT MY IDEAS✅
USD/CAD BULLS WILL DOMINATE THE MARKET|LONG
Hello, Friends!
USD/CAD pair is in the uptrend because previous week’s candle is green, while the price is clearly falling on the 4H timeframe. And after the retest of the support line below I believe we will see a move up towards the target above at 1.374 because the pair is oversold due to its proximity to the lower BB band and a bullish correction is likely.
Disclosure: I am part of Trade Nation's Influencer program and receive a monthly fee for using their TradingView charts in my analysis.
✅LIKE AND COMMENT MY IDEAS✅

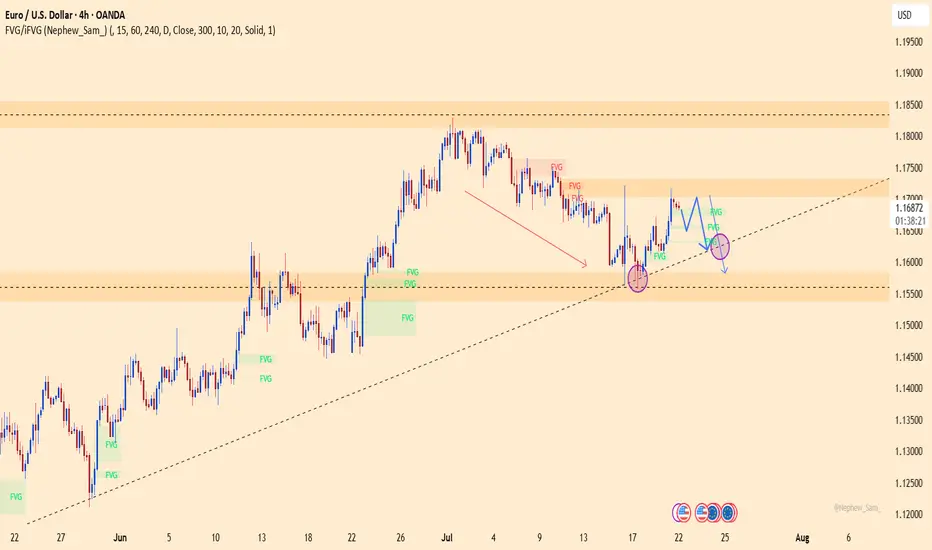
EURUSD – Is the rally over? Time for a collapse?The technical picture reveals that EURUSD is losing momentum after a brief rebound. The 1.1700 level stands as a key resistance – if bulls fail to break it, the bears will take the wheel! A clear scenario is forming: lower highs, FVGs filled, and a potential drop toward the 1.1580 support zone this week.
The bad news for the euro isn’t over: yesterday’s Eurozone PMI data disappointed heavily, signaling stagnating growth. Meanwhile, the USD is gaining traction from strong labor data and hawkish Fed remarks, putting EURUSD under double pressure.
If the ascending trendline breaks, EURUSD could plunge even further – get ready for a potential breakdown!
Suggested strategy: Prioritize SELL below 1.1700, with a short-term target at 1.1580.
Stop-loss: Above 1.1720 – a breakout here would invalidate the bearish setup.
XAUUSD – Strong bullish structure, buyers in control!Gold is trading within a well-defined ascending channel, with each higher low being consistently respected – indicating strong buying pressure. The recent move broke through a fair value gap (FVG) and is approaching short-term resistance. High-probability scenario: a pullback toward the rising trendline, followed by a strong rebound aiming for the previous highs.
RSI remains in a positive zone, supporting the bullish bias. If the trendline support holds, the next target is the upper resistance area.
Supporting news: The US dollar has stalled after a sharp rally, while persistent inflation concerns and renewed hopes for a mild Fed rate cut are boosting gold’s appeal.

EUR/USD: Bearish Trend in FocusHello everyone, what are your thoughts on EUR/USD?
From my personal analysis, it's clear that EUR/USD is extending its downtrend. The pair is trading around 1.164 and is under pressure from sellers after breaking below both the EMA 34 and EMA 89, with EMA 34 already turning downward — a classic bearish signal.
On the macro side, the European Central Bank is set to announce its monetary policy decision on Thursday. Meanwhile, U.S. President Donald Trump's ongoing trade tensions may add further uncertainty to the market. This corrective downtrend in EUR/USD could very well continue in the weeks ahead.
What do you think — will EUR/USD keep falling?
USD/JPY Drops as Market Awaits Powell's RemarksIn today’s trading session, the USD/JPY pair is showing renewed weakness, currently trading around 147.76 — down more than 0.68% from the previous session. The decline is driven by falling U.S. Treasury yields and cautious investor sentiment ahead of an upcoming speech by Federal Reserve Chair Jerome Powell, which is weighing on the U.S. dollar.
From a technical perspective, USD/JPY has broken its short-term uptrend and is approaching a key support level at 147.60. If this level fails to hold, the bearish momentum could extend further.

Latest Gold Price Update TodayHello everyone, what do you think about the price of gold today?
As the new week begins, gold continues the upward trend started at the end of Friday’s session. As of now, the precious metal is trading around 3356 USD, with the uptrend still being supported.
From a carefully analyzed technical perspective, gold successfully broke out of the downward channel, taking advantage of the weakening USD. The price increase is convincing in the short term, especially after testing and confirming the previous breakout as a new support zone (around 3345 USD).
The upward target is expected to continue, with key levels to watch being 3372 USD and the H4 resistance at 3390 USD.
What do you think about the price of gold today? Feel free to share your thoughts in the comments!
Good luck!

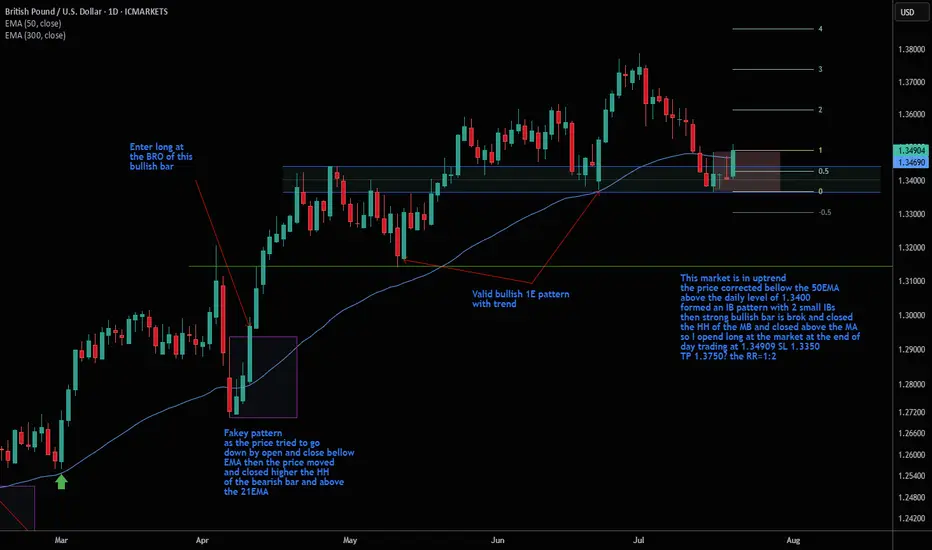
IB pattern after correction bellow the 50EMAThis market is in uptrend
it has been in a correction phase
it reached bellow the 50EMA and near the strong
daily support zone of 1.34000
then it formed a nice IB pattern
which is triggered after the breakout and close the
HH of the MB and above the 50EMA
so I opend at the end of day a buy order at the market
at 1.34909
SL 1.33500
TP 1.37500
so the RR=1:2
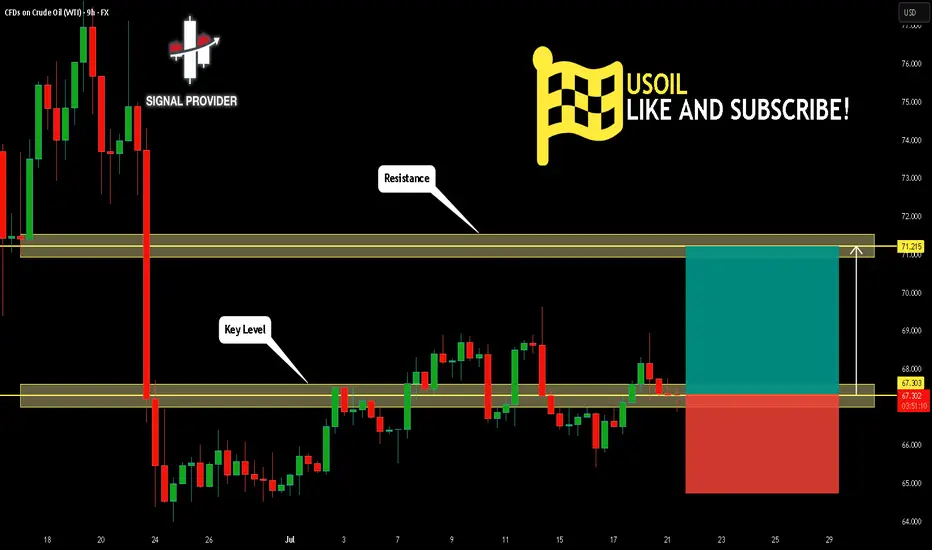
USOIL Will Go Higher! Buy!
Take a look at our analysis for USOIL.
Time Frame: 9h
Current Trend: Bullish
Sentiment: Oversold (based on 7-period RSI)
Forecast: Bullish
The market is approaching a key horizontal level 67.303.
Considering the today's price action, probabilities will be high to see a movement to 71.215.
P.S
We determine oversold/overbought condition with RSI indicator.
When it drops below 30 - the market is considered to be oversold.
When it bounces above 70 - the market is considered to be overbought.
Disclosure: I am part of Trade Nation's Influencer program and receive a monthly fee for using their TradingView charts in my analysis.
Like and subscribe and comment my ideas if you enjoy them!
EURUSD Will Go Up! Long!
Please, check our technical outlook for EURUSD.
Time Frame: 2h
Current Trend: Bullish
Sentiment: Oversold (based on 7-period RSI)
Forecast: Bullish
The market is approaching a significant support area 1.166.
The underlined horizontal cluster clearly indicates a highly probable bullish movement with target 1.170 level.
P.S
Overbought describes a period of time where there has been a significant and consistent upward move in price over a period of time without much pullback.
Disclosure: I am part of Trade Nation's Influencer program and receive a monthly fee for using their TradingView charts in my analysis.
Like and subscribe and comment my ideas if you enjoy them!

USDJPY Is Very Bullish! Buy!
Here is our detailed technical review for USDJPY.
Time Frame: 1D
Current Trend: Bullish
Sentiment: Oversold (based on 7-period RSI)
Forecast: Bullish
The market is approaching a significant support area 144.493.
The underlined horizontal cluster clearly indicates a highly probable bullish movement with target 148.651 level.
P.S
Overbought describes a period of time where there has been a significant and consistent upward move in price over a period of time without much pullback.
Disclosure: I am part of Trade Nation's Influencer program and receive a monthly fee for using their TradingView charts in my analysis.
Like and subscribe and comment my ideas if you enjoy them!

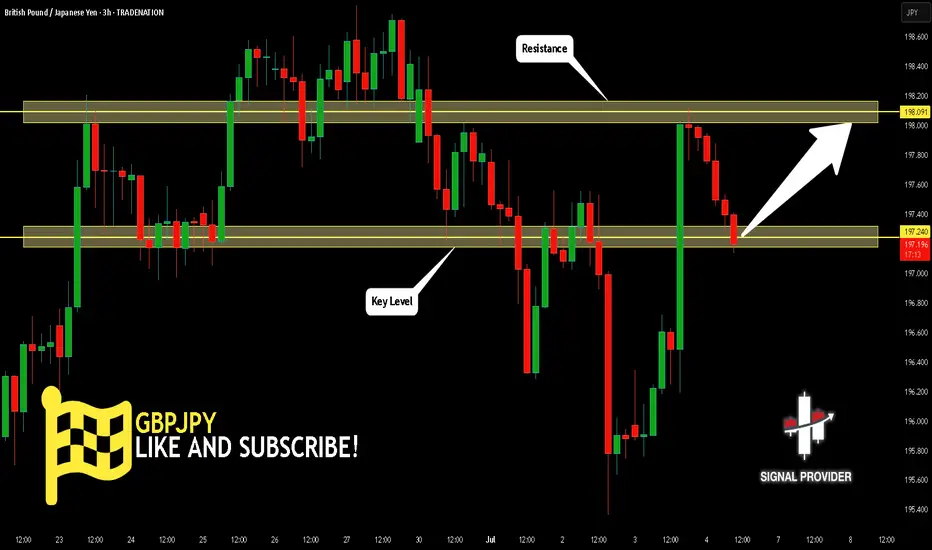
GBPJPY Will Go Up! Buy!
Please, check our technical outlook for GBPJPY.
Time Frame: 3h
Current Trend: Bullish
Sentiment: Oversold (based on 7-period RSI)
Forecast: Bullish
The market is approaching a key horizontal level 197.240.
Considering the today's price action, probabilities will be high to see a movement to 198.091.
P.S
Please, note that an oversold/overbought condition can last for a long time, and therefore being oversold/overbought doesn't mean a price rally will come soon, or at all.
Disclosure: I am part of Trade Nation's Influencer program and receive a monthly fee for using their TradingView charts in my analysis.
Like and subscribe and comment my ideas if you enjoy them!
USDCAD Will Move Higher! Long!
Take a look at our analysis for USDCAD.
Time Frame: 2h
Current Trend: Bullish
Sentiment: Oversold (based on 7-period RSI)
Forecast: Bullish
The market is testing a major horizontal structure 1.368.
Taking into consideration the structure & trend analysis, I believe that the market will reach 1.373 level soon.
P.S
We determine oversold/overbought condition with RSI indicator.
When it drops below 30 - the market is considered to be oversold.
When it bounces above 70 - the market is considered to be overbought.
Disclosure: I am part of Trade Nation's Influencer program and receive a monthly fee for using their TradingView charts in my analysis.
Like and subscribe and comment my ideas if you enjoy them!

USDCHF Will Grow! Long!
Here is our detailed technical review for USDCHF.
Time Frame: 9h
Current Trend: Bullish
Sentiment: Oversold (based on 7-period RSI)
Forecast: Bullish
The market is approaching a significant support area 0.796.
The underlined horizontal cluster clearly indicates a highly probable bullish movement with target 0.804 level.
P.S
We determine oversold/overbought condition with RSI indicator.
When it drops below 30 - the market is considered to be oversold.
When it bounces above 70 - the market is considered to be overbought.
Disclosure: I am part of Trade Nation's Influencer program and receive a monthly fee for using their TradingView charts in my analysis.
Like and subscribe and comment my ideas if you enjoy them!

NZD/USD BUYERS WILL DOMINATE THE MARKET|LONG
NZD/USD SIGNAL
Trade Direction: long
Entry Level: 0.595
Target Level: 0.608
Stop Loss: 0.587
RISK PROFILE
Risk level: medium
Suggested risk: 1%
Timeframe: 1D
Disclosure: I am part of Trade Nation's Influencer program and receive a monthly fee for using their TradingView charts in my analysis.
✅LIKE AND COMMENT MY IDEAS✅

Technical Analysis: NIFTY50 (Closing: ₹24,968.40 on 18-Jul-2025)*Analysis as of 21-Jul-2025 (Monday)*
1. Candlestick Patterns
Daily: A bearish engulfing pattern formed on 18-Jul-2025, closing below the prior candle’s low. Signals short-term reversal risk.
Weekly: Doji formation (indecision) near all-time highs. Weekly close below ₹25,000 warns of exhaustion.
Intraday (4H): Bearish pin bars at ₹25,100 resistance. Watch for follow-through selling below ₹24,900.
2. Harmonic Patterns
Daily: Potential Bearish Bat pattern in development:
XA: ₹23,200 → ₹25,200 (100%)
B: 61.8% retracement at ₹24,400 (pending)
Confirmation below ₹24,400 targets ₹23,800 (0.886XA).
3. Elliott Wave Theory
Weekly: Final waves of Wave 5 (impulse) likely complete at ₹25,200.
Daily: Starting ABC corrective wave:
Wave A: ₹25,200 → ₹24,800 (if breaks ₹24,900)
Wave B: Rally to ₹25,000–25,100 (short opportunity)
Wave C: Target ₹24,300 (1.618xA).
Intraday (1H): Minute wave iii down in progress below ₹24,950.
4. Wyckoff Theory
Phase: Potential distribution near highs:
Upthrust (18-Jul high ₹25,120) failed to hold.
Spring Level: ₹24,900. Break confirms downtrend (test supply).
Downside target: ₹24,500 (fall after distribution).
5. W.D. Gann Analysis
Square of 9:
Key support: √24,968 ≈ 158.0 → 158² = 24,964 (critical pivot).
Close below 24,964 opens ₹24,650 (next square).
Time Cycles:
21-Jul is 180° from 21-Jan 2025 high. Watch for trend change.
Gann Angle: 1x1 angle from Jul-2025 high at ₹25,200 → breaks below imply ₹400/day decline.
6. Ichimoku Kinko Hyo (Daily)
Tenkan: ₹24,950 (resistance)
Kijun: ₹24,800 (support)
Cloud: Lagging span below price; cloud thinning (bearish momentum).
Signal: Price below Kijun → trend weakness.
7. Key Indicators
RSI (Daily): 62 → declining from overbought (70). Bearish divergence.
Bollinger Bands (4H): Price testing lower band (₹24,900). Break targets ₹24,600 (2σ lower).
VWAP (1H): ₹25,050 → intraday resistance.
Moving Averages:
Death Cross (50-DMA/200-DMA): Not triggered, but 5-DMA (₹25,020) crossed below 20-DMA (₹25,050).
Timeframe Summary
Timeframe Key Levels Bias Pattern/Thesis
5M/15M Res: ₹24,990 Bearish Scalp shorts below VWAP (₹25,050)
30M/1H Res: ₹25,050 Sup: ₹24,900 Bearish Bearish EW wave iii; RSI < 50
4H Res: ₹25,100 Sup: ₹24,800 Neutral Break below ₹24,800 confirms Wyckoff distribution
Daily Res: ₹25,200 Sup: ₹24,400 Bearish Bearish Bat + ABC correction
Weekly Res: ₹25,500 Sup: ₹24,000 Neutral Doji warns of reversal; hold ₹24,400 key
Actionable Outlook
Intraday (21-Jul):
Short below ₹24,900 (SL: ₹25,050) → Target ₹24,800.
Break below ₹24,800 extends to ₹24,650.
Swing (1–2 Weeks):
Sell rallies near ₹25,100 (SL: ₹25,250) → Target ₹24,400.
Weekly close > ₹25,200 invalidates bearish view.
Critical Supports: ₹24,800 (Wyckoff spring) → ₹24,400 (Harmonic/EW target) → ₹24,000 (psychological).
Key Resistances: ₹25,050 (VWAP) → ₹25,200 (ATH) → ₹25,500 (Gann square).

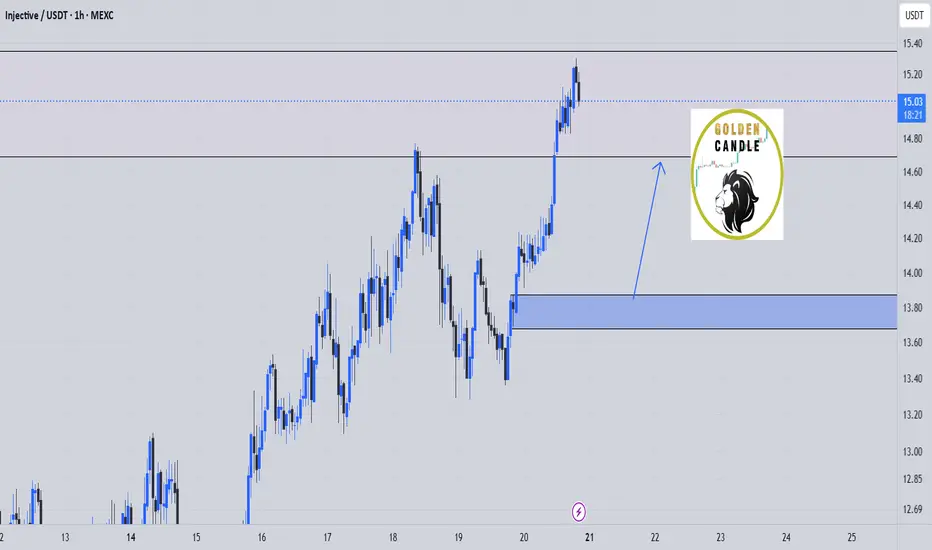
inj buy midterm"🌟 Welcome to Golden Candle! 🌟
We're a team of 📈 passionate traders 📉 who love sharing our 🔍 technical analysis insights 🔎 with the TradingView community. 🌎
Our goal is to provide 💡 valuable perspectives 💡 on market trends and patterns, but 🚫 please note that our analyses are not intended as buy or sell recommendations. 🚫
Instead, they reflect our own 💭 personal attitudes and thoughts. 💭
Follow along and 📚 learn 📚 from our analyses! 📊💡"
XAUUSD 24-Hour Technical Analysis Forecast - UTC+4 Current Price: $3,350.095 (Close: Friday, July 18th, 2025) UTC+4
Analysis Period : Next 24 Hours (July 21-22, 2025) UTC+4
Market Status: Weekend - Preparing for Monday Open 02:00AM 21st July 2025
EXECUTIVE SUMMARY - 24H OUTLOOK
Primary Bias: Neutral to Bearish (Short-term)
Key Resistance: $3,375 - $3,390
Critical Support: $3,285 - $3,300
Expected Range: $3,300 - $3,380
Volatility Level: Moderate to High
CANDLESTICK PATTERN ANALYSIS
Friday's Close Formation
Pattern: Doji-like formation at resistance zone
Significance: Indecision after testing $3,350+ levels
Volume: Moderate - no strong conviction breakout
Context: Failed to close decisively above $3,375 resistance
Expected 24H Patterns
Monday Gap: Potential gap down to $3,320-3,330 area
Reversal Patterns: Watch for hammer/doji at support levels
Continuation Signals: Break below $3,300 could trigger bearish continuation
HARMONIC PATTERN ANALYSIS
Current Harmonic Setup
Primary Pattern: Potential Bearish Bat completing
X: $3,285 (previous low)
A: $3,390 (recent high)
B: $3,320 (61.8% retracement)
C: $3,375 (78.6% projection - current area)
D (Target): $3,300-3,285 (88.6% completion zone)
Fibonacci Levels (24H Focus)
Golden Ratio Resistance: $3,375 (current test area)
61.8% Support: $3,320
78.6% Support: $3,300
88.6% Critical Support: $3,285
Pattern Completion Probabilities
Bearish Bat Completion: 70% probability targeting $3,285-3,300
Bullish Cypher Setup: 30% if break above $3,390
ELLIOTT WAVE THEORY - 24H COUNT
Primary Wave Count
Macro Structure: Wave 5 of larger impulse possibly topping
Current Sub-wave: Wave (c) of corrective structure
Mini Count: 5-wave decline from $3,390 high in progress
24-Hour Wave Projection
Wave 1: $3,390 → $3,320 (Completed)
Wave 2: $3,320 → $3,360 (Completed - 50% retrace)
Wave 3: $3,360 → $3,285 (In Progress - Target Area)
Wave 4: $3,285 → $3,310 (Projected)
Wave 5: $3,310 → $3,260 (Extended target)
Critical Levels
Wave 3 = 1.618 × Wave 1: $3,285 (Primary target)
Invalidation: Above $3,390 (Wave 2 high)
WYCKOFF THEORY - 24H PHASE
Current Market Phase
Phase Assessment: Distribution Phase C (Testing Supply)
Composite Operator Action: Testing demand at $3,350 area
Volume Analysis: Declining volume on recent rallies (bearish)
Expected 24H Wyckoff Action
Phase Transition: Moving toward Phase D (Markdown begins)
Supply Test: Failed test at $3,375 confirms distribution
Target: Initial markdown to $3,285-3,300 area
Key Wyckoff Signals (24H)
No Demand: Expected at current levels
Selling Climax: Possible if break below $3,285 with high volume
Automatic Rally: Dead cat bounce to $3,320-3,330
W.D. GANN THEORY - 24H ANALYSIS
Square of Nine Analysis
Current Position: 3350° on Gann wheel
Next Cardinal Point: 3375° (90° angle - strong resistance)
Support Angles: 3300° (natural support), 3285° (critical angle)
Geometric Progression: $3,285 = perfect square root relationship
Time Theory - 24H Cycle
Natural Time Window: 24-hour cycle from Friday's high
Critical Time: 14:00-16:00 UTC Monday (historical turning point)
Lunar Influence: New moon phase approaching (bearish for commodities)
Angle Theory
45° Line: Currently at $3,320 (rising support)
63.75° Line: $3,285 (steep support angle)
26.25° Line: $3,375 (resistance angle)
Price Forecasting (Gann Methods)
Primary Target: $3,285 (Square root of 81²)
Secondary Target: $3,240 (Square root of 80²)
Resistance: $3,375 (Square root of 82.5²)
Time Forecasting
Turn Time 1: 06:00 UTC Monday (18 hours from Friday close)
Turn Time 2: 14:00 UTC Monday (26 hours from Friday close)
Major Turn: 22:00 UTC Monday (34 hours - Fibonacci time)
MULTI-TIMEFRAME INTRADAY ANALYSIS
5-Minute Chart Analysis
Trend: Bearish momentum building
Pattern: Lower highs, lower lows since Friday high
Key Levels:
Resistance: $3,360-3,365
Support: $3,330-3,335
RSI: Approaching oversold (35-40 range)
Volume: Increasing on down moves
15-Minute Chart Analysis
Structure: Bearish flag formation
Breakdown Level: Below $3,340
Target: $3,300-3,310 (flag pole projection)
Moving Averages: Price below EMA 20 ($3,358)
MACD: Bearish crossover confirmed
30-Minute Chart Analysis
Primary Trend: Corrective phase active
Chart Pattern: Descending triangle
Apex: Around $3,335-3,340
Breakout Direction: 65% probability downward
Volume Profile: Heavy selling at $3,350-3,375
1-Hour Chart Analysis
Major Structure: ABC correction in progress
Current Position: C-wave development
Fibonacci Target: $3,285 (127.2% extension)
Bollinger Bands: Price touching lower band
Stochastic: Oversold but no divergence yet
4-Hour Chart Analysis
Macro Trend: Still bullish above $3,200
Correction Depth: 23.6% retracement maximum expected
Support Zone: $3,280-3,300 (confluences)
Resistance Zone: $3,375-3,390 (proven strong)
Ichimoku: Price approaching cloud support
TECHNICAL INDICATORS MATRIX
Momentum Indicators
RSI (4H): 42 (Neutral-Bearish)
RSI (1H): 35 (Oversold approaching)
Stochastic: %K: 28, %D: 35 (Oversold)
Williams %R: -75 (Strong oversold)
Trend Indicators
MACD (4H): Bearish crossover pending
ADX: 28 (Moderate trend strength)
Parabolic SAR: $3,365 (Sell signal if broken)
Volume Indicators
OBV: Declining (distribution pattern)
Volume Rate of Change: Negative
Accumulation/Distribution: Slight distribution
KEY SUPPORT & RESISTANCE LEVELS (24H)
Immediate Resistance Levels
R1: $3,365 (Previous support turned resistance)
R2: $3,375 (Major psychological & Gann resistance)
R3: $3,390 (Recent swing high)
R4: $3,410 (Extended resistance)
Critical Support Levels
S1: $3,330 (Immediate support)
S2: $3,300 (Psychological & Fibonacci)
S3: $3,285 (Major harmonic & Gann target)
S4: $3,260 (Extended support)
24-HOUR TRADING SCENARIOS
Scenario 1: Bearish Breakdown (60% Probability)
Trigger: Break below $3,330 with volume
Target 1: $3,300-3,310
Target 2: $3,285-3,290
Extended Target: $3,260-3,270
Stop Loss (Shorts): Above $3,370
Scenario 2: Range-Bound Consolidation (25% Probability)
Range: $3,320-3,375
Strategy: Fade extremes
Buy Zone: $3,320-3,330
Sell Zone: $3,365-3,375
Breakout Confirmation: Volume spike
Scenario 3: Bullish Reversal (15% Probability)
Trigger: Break above $3,375 with volume
Target 1: $3,390-3,400
Target 2: $3,410-3,420
Invalidation: Below $3,285
RISK FACTORS & CATALYSTS (24H)
Bearish Catalysts
US Dollar strength continuation
Risk-off sentiment from geopolitical tensions
Profit-taking ahead of weekend
Technical breakdown confirmation
Bullish Catalysts
Safe-haven demand surge
US Dollar weakness
Central bank buying speculation
Technical oversold bounce
High-Impact Events (Next 24H)
Asian market opening sentiment
US Dollar Index movement
Cryptocurrency correlation effects
Weekend gap analysis
TRADING RECOMMENDATIONS (24H)
For Scalpers (5M-15M)
Strategy: Fade bounces to resistance
Entry: $3,355-3,365 area
Target: $3,335-3,340
Stop: $3,375
Risk/Reward: 1:2
For Swing Traders (1H-4H)
Primary Setup: Short on retracement
Entry Zone: $3,350-3,360
Target 1: $3,300
Target 2: $3,285
Stop Loss: $3,385
Conservative Approach
Wait for: Clear breakdown below $3,330
Entry: $3,325 (confirmation)
Target: $3,285-3,290
Stop: $3,345
CONFLUENCE FACTORS
Bearish Confluence at $3,285
Harmonic Bat pattern completion (88.6% level)
Gann Square of Nine critical angle
Elliott Wave 3 = 1.618 × Wave 1 target
Fibonacci 78.6% retracement level
Previous significant support area
Wyckoff markdown initial target
Resistance Confluence at $3,375
Gann 90-degree angle resistance
Harmonic pattern resistance
Elliott Wave corrective high
Previous breakout level
Psychological round number
FINAL 24H FORECAST SUMMARY
Expected Price Action: Controlled decline toward $3,285-3,300 support zone with potential for brief consolidation before further weakness.
Primary Targets (Downside):
First: $3,300-3,310
Second: $3,285-3,290
Extended: $3,260-3,270
Key Invalidation: Sustained break above $3,375 would shift bias bullish toward $3,390-3,410.
Risk Management: Position sizing should be conservative due to high volatility expectations and weekend gap risks.
Probability Assessment:
60% - Bearish scenario
25% - Sideways consolidation
15% - Bullish reversal
Disclaimer: This analysis is for educational purposes only. Gold trading involves substantial risk. Always use proper risk management and never risk more than you can afford to lose.
Volume profile resistance
