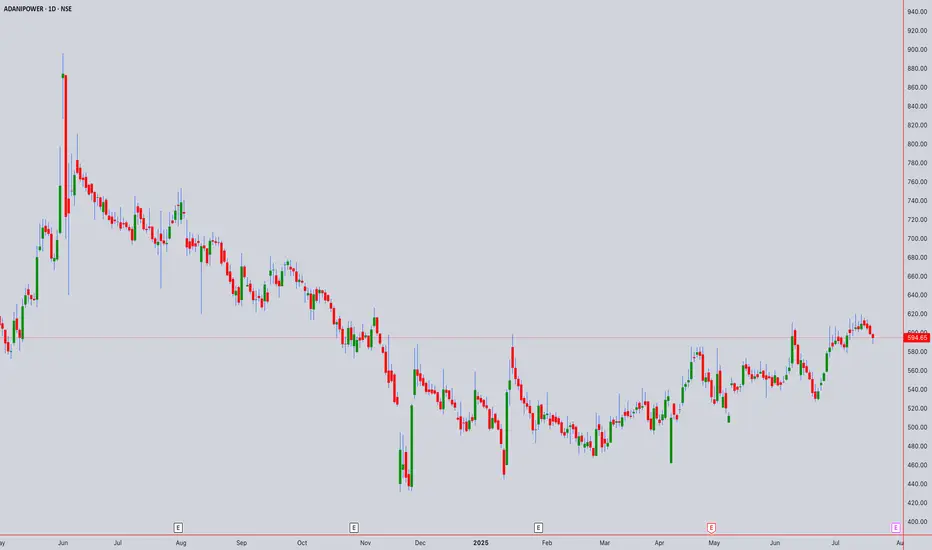
Adani Power (NSE:ADANIPOWER) Technical Analysis July 18th, 2025Current Price : ₹594.65 (as of July 18th, 2025, 02:00PM UTC+4)
Target Price: ₹633.67 (+6.56% upside potential)
Executive Summary
Adani Power is currently showing mixed signals across different timeframes. The stock has broken through key resistance levels but is facing overhead resistance. Multiple technical theories suggest a consolidation phase with potential for upward movement.
1. CANDLESTICK PATTERN ANALYSIS
Intraday Patterns (5M-1H)
Current Formation: Doji/Spinning top patterns indicating indecision
Key Pattern: Inside bar formations suggest consolidation
Volume Profile: Moderate volume with no significant breakout confirmation
Swing Patterns (4H-Weekly)
Primary Pattern: Rectangle/Channel formation identified
Support Zone: ₹513-520 (Strong support)
Resistance Zone: ₹588-600 (Current testing area)
2. HARMONIC PATTERN ANALYSIS
Potential Patterns
ABCD Pattern: Incomplete - monitoring for completion around ₹630-650 zone
Gartley Pattern: Potential bearish setup if rejection occurs at current levels
Fibonacci Levels:
Support: ₹450 (S1), ₹300 (S2), ₹200 (S3)
Resistance: ₹700 (R1), ₹850 (R2), ₹1,000 (R3)
3. ELLIOTT WAVE THEORY
Wave Count Analysis
Primary Wave: Currently in Wave 3 of a larger impulse structure
Sub-wave: Wave 4 correction potentially completing around ₹580-590
Target: Wave 5 projection towards ₹700-750 zone
Invalidation Level: Below ₹513 would negate current count
Time Cycles
Short-term: 5-8 day correction cycle
Medium-term: 21-34 day impulse cycle active
4. WYCKOFF THEORY ANALYSIS
Current Phase Assessment
Phase: Potential Mark-up Phase (Phase D-E transition)
Volume Analysis: Accumulation patterns visible on weekly charts
Smart Money: Institutional interest evident from volume profiles
Composite Operator: Testing supply around ₹600 levels
Key Levels
Spring Test: ₹513 level held as key support
Supply Line: ₹588-600 acting as resistance
Upthrust Potential: Break above ₹605 could trigger mark-up
5. W.D. GANN THEORY ANALYSIS
Square of Nine Analysis
Current Position: 594° on the wheel
Next Resistance: 625° (₹625) - significant Gann angle
Support Level: 576° (₹576) - 45-degree angle support
Cardinal Points: 600° represents a critical decision point
Time Theory
Natural Time Cycles: 90-day cycle completion expected by August 2025
Anniversary Dates: Historical significant dates align with current timeframe
Time Windows: July 25-30, 2025 represents important time cluster
Angle Theory
1x1 Angle: Currently trading above the 1x1 rising angle from ₹513 low
2x1 Angle: Resistance at ₹630 level (steep angle)
Price/Time Squares: Next square at ₹625 (25²)
Forecasting
Price Target: ₹625-650 based on geometric progressions
Time Target: 15-20 trading days for next significant move
Harmony Level: ₹594 is in harmony with previous swing levels
6. ICHIMOKU KINKO HYO ANALYSIS
Cloud (Kumo) Analysis
Current Position: Price trading above the cloud (bullish)
Cloud Thickness: Thin cloud ahead suggests easier breakout potential
Cloud Color: Green cloud in coming periods (bullish bias)
Line Analysis
Tenkan-sen (9): ₹587 - price above (bullish)
Kijun-sen (26): ₹571 - price above (strong bullish)
Chikou Span: Clear of price action (no interference)
Senkou Span A: ₹579 (support)
Senkou Span B: ₹562 (key support)
7. TECHNICAL INDICATORS
RSI Analysis
Current RSI: 58-62 range (neutral to slightly bullish)
Divergence: No major divergences detected
Overbought/Oversold: Not in extreme zones
Bollinger Bands
Position: Price in upper half of bands
Squeeze: Bands expanding, indicating increased volatility
Signal: Potential for continued upward movement
VWAP Analysis
Daily VWAP: ₹591 (price above - bullish)
Weekly VWAP: ₹584 (strong support)
Volume Profile: Heavy volume around ₹570-580 zone
Moving Averages
SMA 20: ₹583 (bullish crossover)
EMA 20: ₹586 (price above)
SMA 50: ₹567 (strong support)
EMA 50: ₹569 (upward sloping)
SMA 200: ₹524 (long-term bull market)
8. MULTI-TIMEFRAME ANALYSIS
Intraday Timeframes
5-Minute Chart
Trend: Sideways with bullish bias
Key Level: ₹592-596 range bound
Signal: Wait for breakout above ₹600
15-Minute Chart
Trend: Consolidating triangle pattern
Volume: Decreasing (typical in consolidation)
Target: ₹605-610 on upside breakout
30-Minute Chart
Trend: Higher highs and higher lows intact
Support: ₹590-592
Resistance: ₹598-602
1-Hour Chart
Trend: Bullish flag pattern forming
Breakout Level: Above ₹602
Target: ₹625-630
4-Hour Chart
Trend: Strong uptrend since ₹513 low
Pattern: Bull flag consolidation
Key Level: ₹588 as crucial support
Swing Timeframes
Daily Chart
Trend: Primary uptrend intact
Pattern: Rectangle between ₹513-588 broken upside
Target: Next resistance at ₹700 zone
Weekly Chart
Trend: Long-term bullish structure
Support: ₹450-500 major support zone
Resistance: ₹700-750 target area
Monthly Chart
Trend: Recovery from major lows
Long-term View: Potential for ₹850+ targets
Time Horizon: 6-12 months for major targets
9. FORECAST & OUTLOOK
Intraday Forecast (Next 1-5 Days)
Bias: Neutral to Bullish
Range: ₹585-610
Breakout Level: Above ₹605 for ₹625 target
Stop Loss: Below ₹582
Swing Forecast (Next 2-8 Weeks)
Primary Target: ₹633-650
Secondary Target: ₹700-720
Support Zone: ₹570-580
Risk Level: Medium (volatility expected)
Key Risk Factors
Overall market sentiment and Adani group developments
Earnings disappointment (recent -23.91% surprise noted)
Broader power sector dynamics
Regulatory changes in power sector
Trading Strategy Recommendations
For Intraday Traders
Buy: Above ₹602 with ₹610-615 target
Sell: Below ₹590 with ₹582-585 target
Risk Management: 1-2% position sizing
For Swing Traders
Accumulate: ₹580-590 zone
Target: ₹633-650 (first target)
Stop Loss: Below ₹570 (daily close basis)
Time Horizon: 4-8 weeks
Confluence Factors Supporting Bullish View
Multiple theories align for ₹625-650 targets
Strong volume accumulation patterns
Technical breakout from rectangle formation
Ichimoku cloud support
Gann squares and angles alignment
Warning Signals to Watch
Daily close below ₹580
RSI divergence formation
Volume decrease on any upward moves
Broader market weakness
Disclaimer: This analysis is for educational purposes only. Always consult with financial advisors and conduct your own research before making investment decisions. Past performance does not guarantee future results.
Buy
NASDAQ Potential UpsidesHey Traders, in tomorrow's trading session we are monitoring NAS100 for a buying opportunity around 22,780 zone, NASDAQ is trading in an uptrend and currently is in a correction phase in which it is approaching the trend at 22,780 support and resistance area.
Trade safe, Joe.

APT - A lower timeframe view - Breakout Entry- On 1D candle, APT is still trading inside the channel
- currently price is trading near the resistance and got rejected from the resistance as expected.
- I'm expecting few more candles near the resistance zone before breakout.
If we look at the higher timeframe (1W) view we shared earlier, there is huge potential for uptrend as we are expecting past pattern to repeat
if you are looking for a short term trade without focusing on weekly chart, this is a good opportunity
Entry Price: 5.313
Stop Loss: 3.462
TP1: 6.141
TP2: 7.270
TP3: 8.634
TP4: 10.583
TP5: 14.768
Don't forget to keep stoploss
Cheers
GreenCrypto

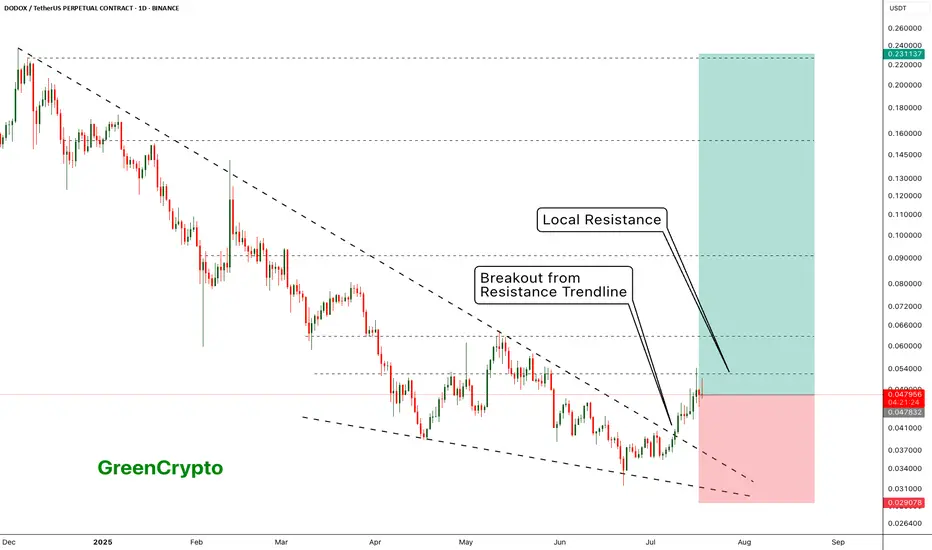
DODOX - Resistance is holding it back - Huge Potential- DODOX has successfully broken out from the resistance trendline
- Now its being pushed back back the weak local resistances
- I see a huge upward potential here.
Entry Price: 0.048271 ( Or you can wait for it breakout from the local resistance of 0.063051)
Stop Loss: 0.029078
TP1: 0.062621
TP2: 0.079766
TP3: 0.103243
TP4: 0.151853
TP5: 0.222332
Max Leverage 5x.
Don't forget to keep stoploss
Cheers!
GreenCrypto
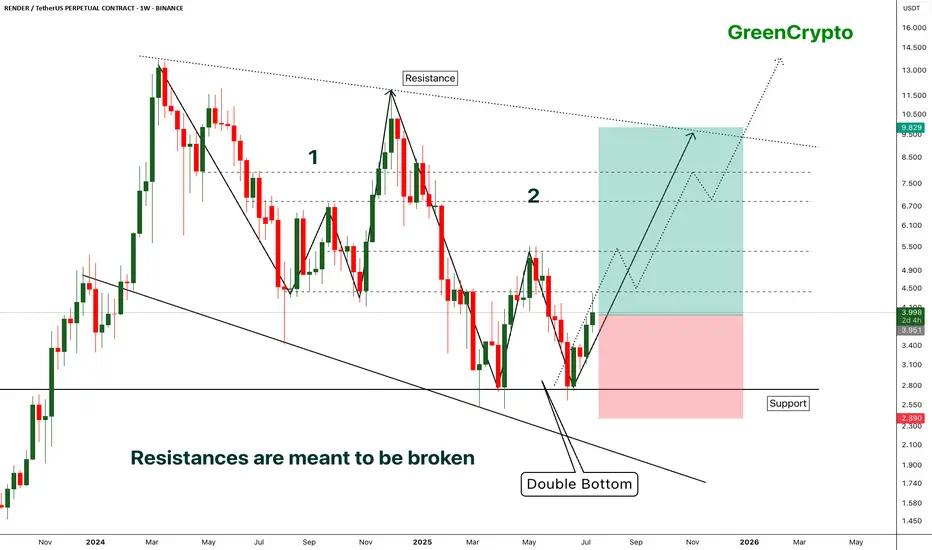
RENDER - [Double bottom] - Resistances are meant to be broken- RENDER has successfully bounced back from the support by forming the double bottom pattern.
- Double bottom pattern is bullish pattern, when it forms at the strong support it becomes extremely bullish. this is one of such scenario.
- Im expecting some minor resistance at the local resistance around 4.3
- A successfull breakout this local resistance will push the price further high.
Entry Price: 3.941
Stop Loss: 2.378
TP1: 4.413
TP2: 5.350
TP3: 6.887
TP4: 8.092
TP5: 9.810
Max Leverage 5x.
Don't forget to keep stoploss.
Support us by Liking and following.
Thanks and Cheers!
GreenCrypto
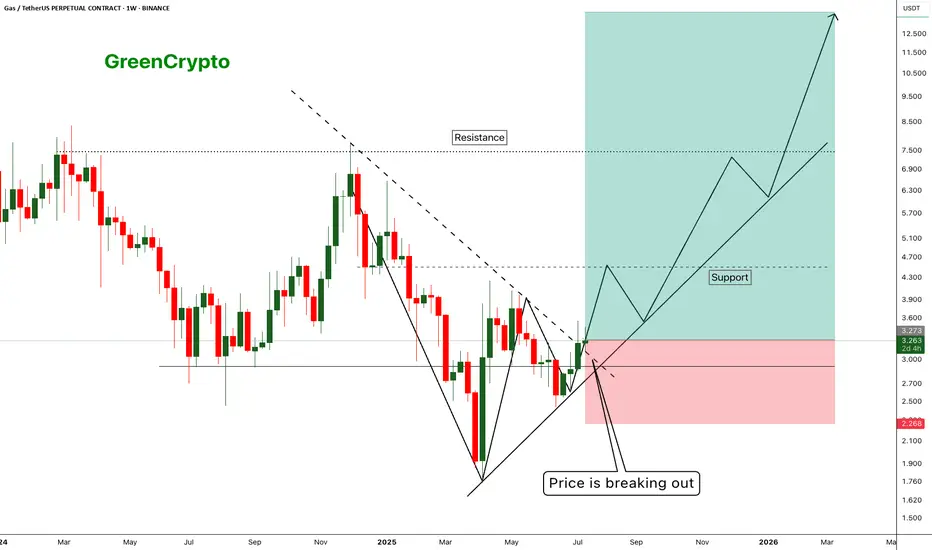
GAS - Huge Risk:Reward Trade 1:10 - Is there any Gas Left ?- Gas has finally managed to breakout from the resistance trendline and now trading just above the resistance
- I'm expecting this trend to continue along the support line shown in the chart.
Entry Price: 3.281
Stop Loss: 2.271
TP1: 3.944
TP2: 4.589
TP3: 6.775
TP4: 8.412
TP5: 13.512
Max Leverage 5x.
Don't forget to keep stoploss.
Support us by Liking and following.
Thanks and Cheers!
GreenCrypto
EURCHF Is Going Up! Buy!
Here is our detailed technical review for EURCHF.
Time Frame: 9h
Current Trend: Bullish
Sentiment: Oversold (based on 7-period RSI)
Forecast: Bullish
The market is testing a major horizontal structure 0.931.
Taking into consideration the structure & trend analysis, I believe that the market will reach 0.936 level soon.
P.S
Overbought describes a period of time where there has been a significant and consistent upward move in price over a period of time without much pullback.
Disclosure: I am part of Trade Nation's Influencer program and receive a monthly fee for using their TradingView charts in my analysis.
Like and subscribe and comment my ideas if you enjoy them!

buy bch midterm"🌟 Welcome to Golden Candle! 🌟
We're a team of 📈 passionate traders 📉 who love sharing our 🔍 technical analysis insights 🔎 with the TradingView community. 🌎
Our goal is to provide 💡 valuable perspectives 💡 on market trends and patterns, but 🚫 please note that our analyses are not intended as buy or sell recommendations. 🚫
Instead, they reflect our own 💭 personal attitudes and thoughts. 💭
Follow along and 📚 learn 📚 from our analyses! 📊💡"

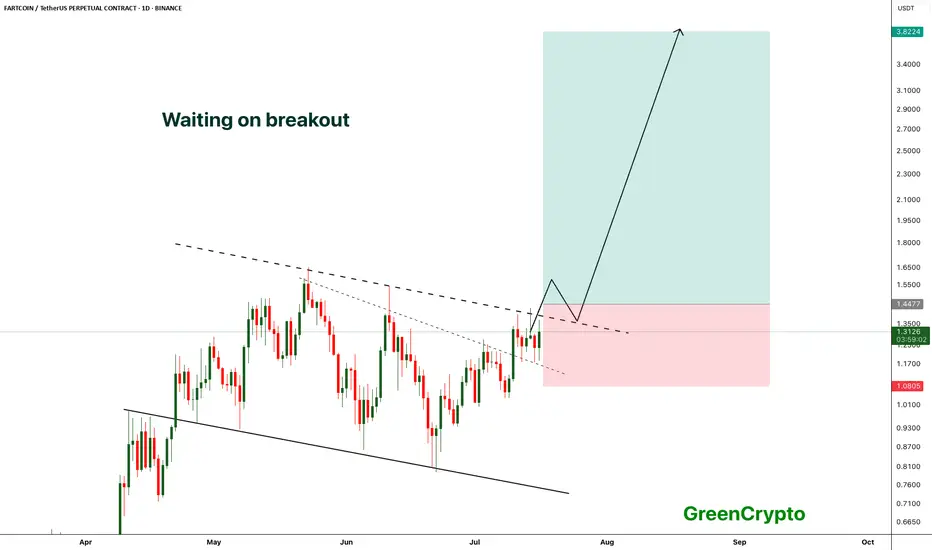
FARTCOIN - Breakout from the channel- FARTCOIN is waiting to breakout from the channel, a confirmed breakout would push the price to new all time high
- we have long trade opportunity once the price breaks above the resistance trendline
Entry Price: above 1.44
Stop Loss: Below 1.08
TP1: 1.6464
TP2: 1.8923
TP3: 2.2450
TP4: 2.9973
TP5: 3.8224
Max Leverage: 5x
Don't forget to keep stoploss
Cheers
GreenCrypto
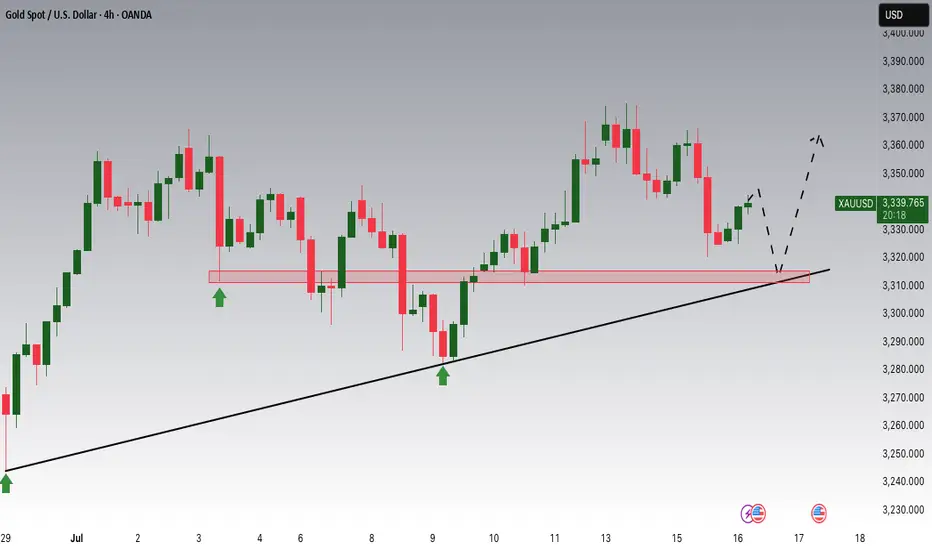
Gold Potential UpsidesHey Traders, in today's trading session we are monitoring XAUUSD for a buying opportunity around 3,310 zone, Gold is trading in an uptrend and currently is in a correction phase in which it is approaching the trend at 3,310 support and resistance area.
Trade safe, Joe.
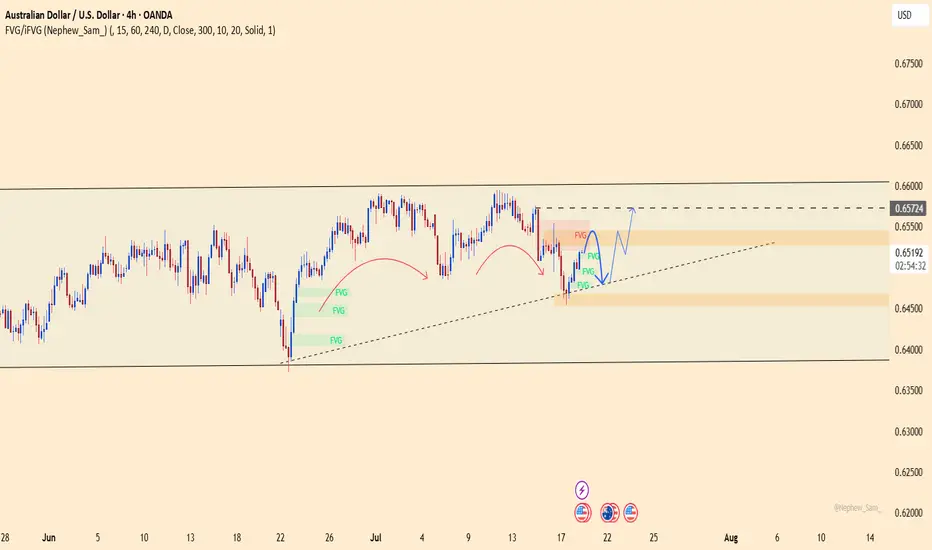
AUDUSD – bullish momentum returns, ready for a breakout?AUDUSD is showing clear strength after rebounding from a key support zone. The bullish structure remains intact with a series of higher lows, and the ascending trendline continues to hold. The recent pullback appears to be a healthy retracement before the market gathers momentum for the next leg up.
On the news front, the pair is supported by strong Australian employment data and expectations that the Federal Reserve will keep interest rates steady. This has slightly weakened the US dollar, giving AUD room to recover.
If buying pressure holds, AUDUSD could break through the overhead resistance and enter a new bullish phase. Now is the time for traders to watch price action closely and wait for a clear confirmation signal!
GOLD hits resistance – usd strikes back!XAUUSD is charging into the "danger zone" around 3,375 – a level where bulls have fallen before.
But this time, gold faces a heavyweight opponent:
– The US economy is revving up like a race car: consumer demand is surging, jobless claims are dropping.
– The Fed holds its hawkish stance like a loaded weapon: high interest rates aren’t going away.
– The US dollar is back in full force, and bond yields are shooting sky-high.
While gold buyers try to climb higher, pressure from the “USD fortress” is building fast.
Every uptick in XAUUSD now… might just be a setup before the fall.
If selling pressure returns near the previous highs, another sharp drop in gold could be just around the corner.

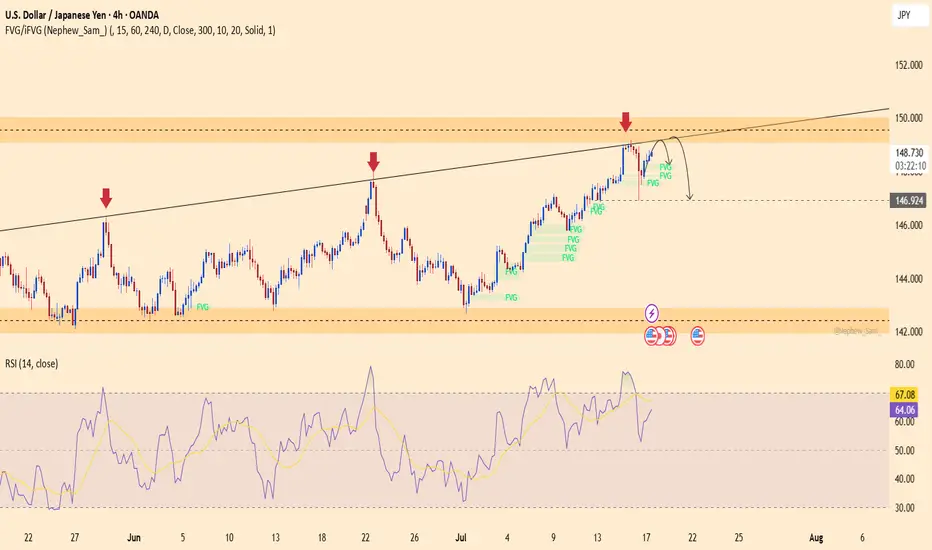
USDJPY – Rejection Pressure Builds, Is a Reversal on the HorizonUSDJPY has been rejected for the third time at the diagonal resistance line, forming a potential lower-high pattern that suggests a reversal could be underway. The RSI is dropping from the overbought zone, clearly indicating weakening bullish momentum. If the price breaks below 146.900, a bearish trend may be confirmed, with a possible move toward the lower support area.
On the news front, U.S. Treasury yields have stalled after a strong rally, and jobless claims have ticked up slightly—dampening expectations for further Fed rate hikes. This puts pressure on the USD while favoring the safe-haven JPY.
Traders should closely monitor the price action around the 149.300 level. Continued rejection could offer a prime shorting opportunity!
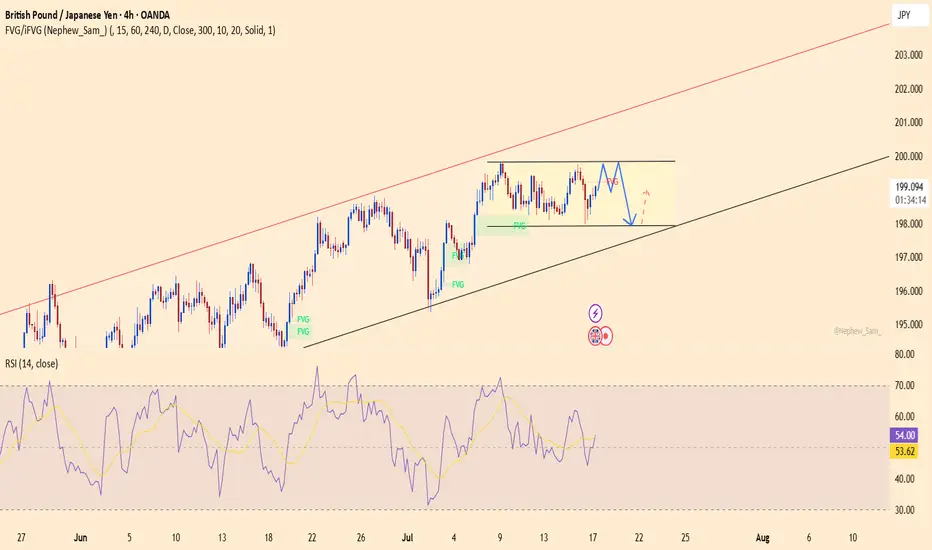
GBPJPY set for breakoutGBPJPY is currently trading in a sideways pattern within an ascending channel. The support zone around 197.900 has been respected multiple times, while price repeatedly fails to break above the 199.800 resistance – signaling that built-up pressure may soon erupt.
Recent data shows that UK inflation remains high, and the Bank of England may maintain its hawkish stance, supporting the GBP. Meanwhile, global risk-off sentiment continues to weaken the JPY.
If price breaks through the current resistance, it would confirm the continuation of the uptrend, with a target toward the upper boundary of the red channel. However, if rejection persists, buying from support remains a valid strategy.
GBPUSD Potential UpsidesHey Traders, in today's trading session we are monitoring GBPUSD for a buying opportunity around 1.33900 zone, GBPUSD is trading in an uptrend and currently is in a correction phase in which it is approaching the trend at 1.33900 support and resistance area.
Trade safe, Joe.

GBPAUD Will Go Up From Support! Long!
Here is our detailed technical review for GBPAUD.
Time Frame: 4h
Current Trend: Bullish
Sentiment: Oversold (based on 7-period RSI)
Forecast: Bullish
The market is on a crucial zone of demand 2.060.
The oversold market condition in a combination with key structure gives us a relatively strong bullish signal with goal 2.071 level.
P.S
We determine oversold/overbought condition with RSI indicator.
When it drops below 30 - the market is considered to be oversold.
When it bounces above 70 - the market is considered to be overbought.
Disclosure: I am part of Trade Nation's Influencer program and receive a monthly fee for using their TradingView charts in my analysis.
Like and subscribe and comment my ideas if you enjoy them!

SUPER - Getting ready for the super run- Price is trading near the resistance after forming higher high.
- it's highly likely that price will get rejected around the resistance and will form another higher high.
- this is an excellent opportunity for us to enter the trade.
Entry Price: 0.7322
Stop Loss: 0.5344
TP1: 0.8939
TP2: 1.0517
TP3: 1.2867
TP4: 1.6336
TP5: 2.2243
Max Leverage 5x.
Don't forget to keep stoploss.
Support us by Liking and following.
Thanks and Cheers!
GreenCrypto

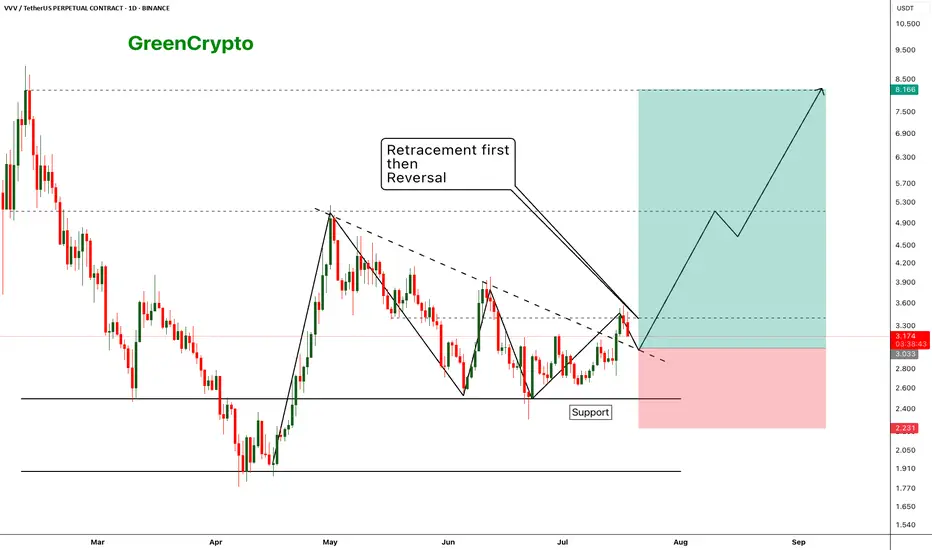
VVV - Expecting perfect reversal after the retracement- price has broken out from the resistance trendline and now we are seeing a retracement as expecting
- Price should hold the support (previous resistance) and reverse from the suppport zone.
- we can enter our trade once the retracement completed
Entry Price: 3.033
Stop Loss: 2.231
TP1: 3.411
TP2: 4.037
TP3: 4.851
TP4: 6.360
TP5: 8.028
Max Leverage 5x.
Don't forget to keep stoploss.
Cheers!
GreenCrypto
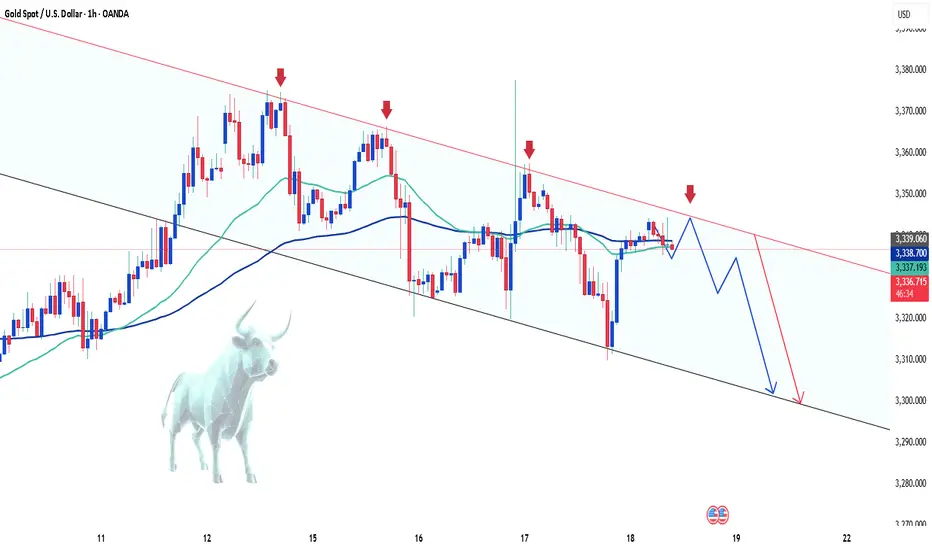
Gold prices fall in the short term – What's next?Hello everyone, what’s your take on gold?
Today, gold continues to attract short-term selling pressure as USD buying momentum returns and expectations for Fed rate cuts diminish. On the other hand, an overall positive risk sentiment is also seen as another factor weighing on the precious metal.
At the time of writing, gold is trading around the EMA 34 and 89 near 3,336 USD. With no major updates expected, the market is likely to remain steady throughout the day.
From a technical perspective, the bearish trend persists, with prices capped below the trendline. A series of lower highs and lower lows could push XAUUSD to retest deeper levels, potentially reaching the 3,300 USD mark. However, lingering trade uncertainties may limit losses for this safe-haven asset.
This is just my view on the market, not financial advice.

Gold's Short-Term Decline: What's Next?Hello everyone, what do you think about gold?
Today, gold continues its short-term downtrend. After new data was released at the end of yesterday’s trading session, the USD rose by 0.3%, and U.S. Treasury yields also increased, reducing the appeal of gold. Additionally, the latest unemployment claims data shows improvement in the U.S. economy, which has contributed to the drop in the precious metal.
As of writing, gold is trading around the EMA 34, 89 levels at 3,336 USD. With the recent news, the market is expected to maintain its current stance throughout the day, as no new significant updates are expected.
From a technical standpoint, the downtrend remains in place, with prices continuing to be capped below the trendline. The series of lower highs and lows could likely lead XAUUSD to test lower levels, with the possibility of reaching the 3,300 USD mark.
What do you think about the price of gold today? Let us know in the comments!
ETHUSD Is Going Up! Buy!
Please, check our technical outlook for ETHUSD.
Time Frame: 12h
Current Trend: Bullish
Sentiment: Oversold (based on 7-period RSI)
Forecast: Bullish
The market is approaching a key horizontal level 3,011.53.
Considering the today's price action, probabilities will be high to see a movement to 3,240.64.
P.S
The term oversold refers to a condition where an asset has traded lower in price and has the potential for a price bounce.
Overbought refers to market scenarios where the instrument is traded considerably higher than its fair value. Overvaluation is caused by market sentiments when there is positive news.
Disclosure: I am part of Trade Nation's Influencer program and receive a monthly fee for using their TradingView charts in my analysis.
Like and subscribe and comment my ideas if you enjoy them!

USD/JPY(20250718)Today's AnalysisMarket news:
① Kugler: It is appropriate to keep the interest rate policy stable for "a while".
② Daly: Whether to cut interest rates in July or September is not the most critical.
③ Bostic: It may be difficult to cut interest rates in the short term.
Technical analysis:
Today's buying and selling boundaries:
148.45
Support and resistance levels:
149.80
149.30
148.97
147.93
147.61
147.10
Trading strategy:
If the price breaks through 148.97, consider buying in, the first target price is 149.30
If the price breaks through 148.45, consider selling in, the first target price is 147.93

Latest Gold Price Update TodayGold prices today continue to maintain a short-term uptrend, driven by trade tensions and U.S. inflation data.
The weakening of the USD and the drop in U.S. Treasury yields have increased gold's appeal as a safe-haven asset. The trade tensions between the U.S. and the EU, along with new tariff measures, further boost the demand for gold.
Additionally, the U.S. PPI for June rose by 2.3%, lower than the forecast and May’s increase, suggesting that inflation could decrease in the future. The market expects the Fed to cut interest rates in September, weakening the USD and supporting gold's uptrend.
With factors like trade tensions, a weaker USD, and positive inflation data, gold prices may continue to rise. Investors need to closely monitor these factors to devise an appropriate strategy.
