BAE Systems - About to rocket?BUY – BAE SYSTEMS (BA.)
BAE Systems plc is a defense, aerospace and security company. The Company operates through five segments. The Electronic Systems segment consists of the Company's United States and United Kingdom-based electronics activities.
Fundamentals
The company boasts special relationships with both the US and Saudi Arabia. The company has provided support and equipment to the Saudi armed forces for several decades now. The Middle East is a very important revenue stream and the company is actively trying to diversify its client list. BAE has not cut its dividend for 20 years and continues to maintain a dividend yield in excess of 4%.
Best Broker Target Price: 690p (Deutsche Bank 15/07/2019)
Worst Broker Target Price: 530p (JP Morgan Cazenove 17/07/2019)
Technical Analysis
BAE Systems share price broke out of a large range in July 2019 to confirm a bottom pattern. The shares subsequently move higher towards a high of 570p. In recent weeks there has been evidence of profit taking as the shares have dipped back to the breakout level to confirm support. So far, the support level is holding, which we believe is an indication of fresh buying interest. Further upside is expected over the medium term.
Recommendation: Buy
Buy between 530-545p
Stop: 520p
Targets: 615p
Buyandhold

Buy Auto Trader - Correction over?BUY – AUTO TRADER (AUTO)
Auto Trader Group plc is a digital automotive marketplace. The Company is engaged in the business of buying and selling new and used vehicles. The Company also operates similar business in Ireland through its Website carzone.ie.
Fundamentals
Auto Trader is forecast to post a rise in earnings of 12% in the current year. This follows three years of consecutive double-digit net profit growth, which suggests its business may be relatively resilient within what is a highly cyclical automotive sector. The company is in a dominant position within its industry with virtually no competition.
Best Broker Target Price: 640p (Liberum Capital 09/07/2019)
Worst Broker Target Price: 414p (JP Morgan Cazenove 17/07/2019)
Technical Analysis
Auto Trader has traded in a corrective channel since reaching all time highs in June this year. The corrective move appears to have stalled around the 38.2% Fibonacci support level which is from the October 2018 lows to the June 2019 all time highs. A bullish outside candle has been posted on the daily chart, which is positive for short term sentiment. The break of the corrective channel indicates the move lower has come to an end the long term trend can now reassert itself.
Recommendation: Buy
Buy between 515-540p
Stop: 505p
Targets: 600p

Vodafone - Extending higher from a bottom patternBUY – VODAFONE (VOD)
Vodafone Group Plc is a telecommunications company. The Company's business is organized into two geographic regions: Europe, and Africa, Middle East and Asia Pacific.
Fundamentals
Vodafone’s share price has drifted sideways to lower for the past few years, but all of a sudden, the price has risen almost 25% in 3 months. This follows the first cut of the dividend since 1990 back in May 2019. The most recent update was a positive one with the company stating they are confident in delivering their revised earnings target. They also planned to raise around €20million from the sale of 60,000 mobile masts through a potential IPO of firm TowerCo. This would create Europe’s largest power company.
Best Broker Target Price: 250p (Deutsche Bank 09/08/2019)
Worst Broker Target Price: 140p (Berenberg Bank 19/06/2019)
Technical Analysis
The share price gapped up through the long-term downtrend channel on the May results. This then led to the completion of a large bottom pattern on the break above resistance at 147.8p. The projected upside move from the bottom pattern comes in at 171.44p. Beyond that there is scope for significantly more upside according to the 250p price target from Deutsche Bank that was published on the 9th August 2019.
Recommendation: Buy
Buy between 150-157p
Stop: 143.5p
Target: 175p

Howden Joinery - Throw the kitchen sink at it?Technical
Howden Joinery looks interesting on a technical basis. The shares shot higher to new highs following a bullish update to the market. We have since seen the share price unwind to some sensible levels as the overall market continues in this condolidaiton phase. The shares have reached a confluence of Fibonacci support levels, which I have highlighted on the chart. We have seen buying interest emerge and a gap higher in price to break out of a consolidation wedge. The overall trend remains bullish and a move to new highs is expected.
Fundamentals
The UK’s leading manufacturer and supplier of fitted kitchens, appliances and joinery products has been paying dividend yields of around 2.5%. Howden ended the reporting period with net cash of £217.1m, which makes its forward P/E multiples of around 14-15 look attractive.
Stop: 505p
Target: 600p

Ocado - Looking ripe for buying.Technical
Ocado has had a dramatic rise in price over the past 18 months. The breakout level at 1163p has been retested and has so far been well supported. The shares have been in a consolidation phase for the past few weeks, but some signs are emerging that could put an end to the sideways price action. A move back to and above the previous highs is expected from here.
Fundamentals
The company continues to make strides into technology, which offers potential medium-term growth.
Numis reiterated thier 'Buy' rating on the 10th May 2019 with a price target of 1700p
Ocado has announced a string of deals and recently tied up a joint venture with Marks and Spencer.
Stop 1105p
Target 1500p

$MACK Merrimack Pharmaceuticals Inc Heading HigherShareholders of $MACK are getting a $20 million special dividend.
The special dividend is payable on September 5, 2019 to stockholders of record as of the close of business on August 28, 2019. The ex-dividend date for the special dividend will be September 6, 2019, the first trading day following the payment date. Stockholders of record on the record date who sell their shares prior to the ex-dividend date will not receive the special dividend. Based on the current number of shares outstanding, the special dividend will be approximately $1.50 per common share; this amount may vary based on the number of outstanding shares as of the record date.
"The authorization of a special dividend higher than the range that we had initially estimated is an important step in implementing the strategic plan that we announced on May 30, 2019 and reflects our success in restructuring the Company and the recent closing of the sale of certain programs to 14ner Oncology, Inc.," said Gary Crocker, Chairman of Merrimack's Board of Directors. "Our remaining cash balance is anticipated to support operations into 2027, when we estimate the longest-term potential Ipsen milestone may be achieved."
About Merrimack
Merrimack Pharmaceuticals, Inc. is a biopharmaceutical company based in Cambridge, Massachusetts that is entitled to receive up to $455.0 million in contingent milestone payments related to its sale of ONIVYDE® to Ipsen S.A. in April 2017 and up to $54.5 million in contingent milestone payments related to its sale of anti-HER3 programs to 14ner Oncology, Inc. in July 2019. The Company is seeking potential acquirers for its remaining preclinical and clinical assets.
Why is the $20 million special dividend significant?
Because $MACK has a market cap of just $80 million.
$MACK looks to be a buy and hold.
As always, use protective stops and trade with caution.
Good luck to all!

ETH - update ideas
“Ethereum needs only 10 dollars to reach 285 dollars and justify our forecast made a few days ago. Even a record transaction volume of 1 million per day can prevent the lead altcoin from falling below $ 300.
On the 4-hour chart, Ethereum monitors BTC price movements, showing a decline since June 26. However, one should not expect a drop to $ 250, since the RSI model is moving into the oversold zone. MACD is declining, indicating an early decline to 270 dollars.

AUDUSD 1,000 PIP POTENTIAL. LONG TERM BULLISH (Heaps of Upside) AUDUSD WEEKLY
minus a brief stint in the midst of the financial crisis, AUDUSD hasn't seen price maintained below .6900 for over 15 YEARS!!
As a long-term value play I can't think of a better opportunity at the current moment,
Heaps of upside.
1,000 Pip Trade in the making!

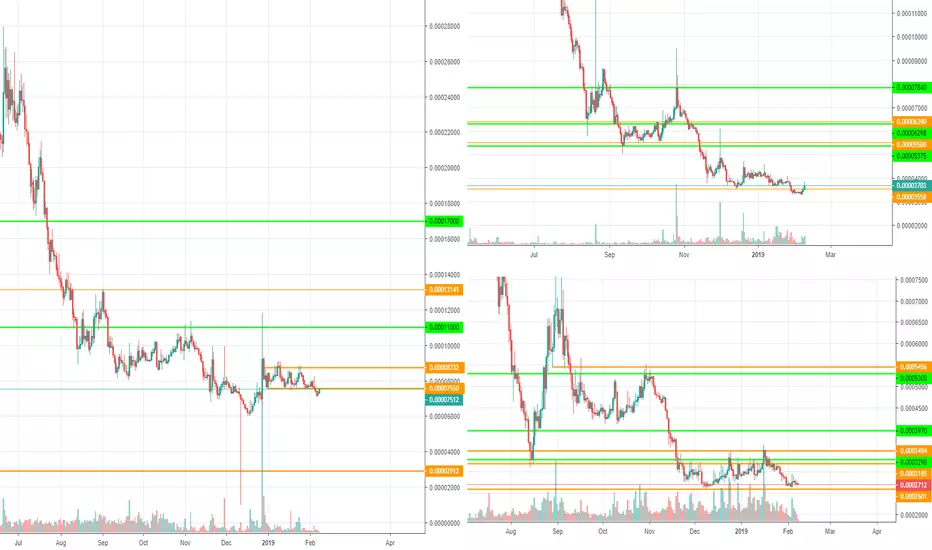
BUY & HOLD - ENG, KNC, WTCOur BUY & HOLD picks for next Alts season:
ENGBTC
KNCBTC
WTCBTC
These alts have been flat and technical structures suggest major up-tick in price. Green horizontals on the charts are our targeted sell levels.
GBPJPY BUY & HOLD FX:GBPJPY
TARGET ENTRY
BUY LIMIT @ 1.2600
SL @ 1.2550
TP @ 1.3000
RRR 1:8
NOTE:
Confluence of HNS @ 1D ( price forming right shoulder)
BRN @ 1.2600
Wait for Bullish CS confirmation only enter the market.
**The ideal SL is below the Head @ 1D**
Trade At Your Own Risk

Alef.vn still a little over-valuedMy Fair Value Theory;
My theory is that the blue channel is the "fair price channel" what the company should be worth, according to the market and price action. Anything outside of the channel is fair price plus speculation. The green line represents the average fair value as per how the market views the company at any given time.
Note: The 55 Day Dochain channel is in confluence with my channel theory.
(See Turtle Trend Traders Research - available pretty much everywhere - do a google search)
My Opinion: for what its worth.
Based on my channel theory, Alef is still a little over-valued. It should settle in by year-end. The Bears are not done yet leveling the playing field.
I am watching the 1.88/1.66 zone for a support bounce or two.

KEYS - buy and holdSector: Industrials
Sub-Sector: Industrial Machinery & Equipment
Keysight Technologies, Inc. is a measurement company engaged in providing electronic design and test solutions to communications and electronics industries. 5G test solutions as one example, automated driving another testing solution, IoT and high-speed data centers another. Keysight generated revenues of $3.2B in fiscal year 2017. In April 2017, Keysight acquired Ixia, a leader in network test, visibility, and security. More information is available at keysight.com.
Liked the MACD on this one and rare to see here, as everyone is looking for short or mid-term trades. 12.3B company with 5.8B assets and 1.7B profits on 3.2B in 2017, so 12.3B means sales growth. No dividend.

RGEN - LEAPS & BOUNDs RGEN: Repligen Corporation is a bioprocessing company. The Company is focused on the development, manufacture and commercialization of products used to improve the interconnected phases of the biological drug manufacturing process. The Company's portfolio includes protein products, chromatography products, and filtration products.
RGEN as a mid-cap is new watch and being saved for own watch list and entry steep right now. 2.4B Mkt Cap and similiar EV. BETA 0.71 so great buy and forget stock. Debt low to cash flow.
Ownership: 80 Institution, 3 Management and insider trend has been sell. Look at chart and ask why?
Q2 Earnings in early Aug. were good, but first time below mkt expectations in awhile....so watching. Q3 E in early Nov-18.
Buylongselllong format courtesy of @MarxBabu. Format changed to add 1w MA and add resistance line for optimal entry. Comments & feedback appreciated especially if you understand the technology by Repligen.

ETHUSD / D1 : After months of patience, I'm triggering buy&holdOnce again the warnings here are the same :
Buy & Hold is not possible to do with leverage.
Buy & Hold is an investment psychology and nothing close to speculative entries.
You must be ready to invest into something that may go to 0..
You'll never exit this trade until it goes to that 0 value... Or to your target !
Buy & Hold can't be done with a substantial amount of you capital. Just a tiny spared amount.
If you do follow me here with any difference to those rules, don't come cry to me if this turns out to fail.
More importantly... I'm triggering ONLY on ETH, not on BTC.. this one still requires patience to me.
Hope this idea will inspire some of you !
Don't forget to hit the like/follow button if you feel like this post deserves it ;)
That's the best way to support me and help pushing this content to other users.
All my scenarios and portfolio managements are explained in a daily basis on my Youtube channel.
You'll find a link to get there in my profile signature here : @PRO_Indicators
The English videos are posted upon the "Market Forecast (ENG)" Playlist.
Kindly,
Phil

COST Bull FlagNoticed a flag appearing on COSTCO and entered position on bounce and break.
target at around 133-134 are but no current limit. Used more of an entry for long term EPS generally growing and PE is also getting higher but at a much lower pace.
Stop is low due to the nature of getting into the position. If it were to go that low from entry then I expect the market has changed for the position and sentiment would turn more bearish.
Keeping on position for time being to find any blatant exit signals.

General Mills (NYSE: GIS) May 7, 2018GIS is a dividend fortress. The company has been in business for over a 100 years. Due to missed earnings, I believe that the stock has been oversold. This seems to be a good entry point before the next earnings report.

Bitcoin — Sharks vs. Whales: WHO GONNA WIN?! Buy and Sell SignalHello dear friends, investors and traders!
Bitcoin moving to B area in 8600-8400 levels
Rebuy partially under 8600 down to 7800 levels , hold to 10-11k price levels.
@maaq23 winner of the contest in telegram! WELL DONE! You will receive your BTC today!

XPloRR MA-Trailing-Stop Strategy Bitcoin(BTCUSD) beats Buy&HoldLong term MA-Trailing-Stop strategy with Adjustable Signal Strength to beat Buy&Hold strategy
None of the strategies that I tested can beat the long term Buy&Hold strategy. That's the reason why I wrote this strategy (link see below).
Purpose: beat Buy&Hold strategy with around 10 trades over a period of 10 years (average of 1 trade/year). 100% capitalize sold trade into new trade.
My buy strategy is triggered by the fast buy EMA (blue) crossing over the slow buy SMA curve (orange) and the fast buy EMA has a certain up strength.
My sell strategy is triggered by either one of these conditions:
the EMA(6) of the close value is crossing under the trailing stop value (green) or
the fast sell EMA (navy) is crossing under the slow sell SMA curve (red) and the fast sell EMA has a certain down strength.
The trailing stop value (green) is set to a multiple of the ATR(15) value.
ATR(15) is the SMA(15) value of the difference between the high and low values.
The script shows a lot of graphical information:
One green area represents one trade
The close value is shown in light-green. When the close value is lower then the buy value, the close value is shown in light-red. This way it is possible to evaluate the virtual losses during the trade.
the trailing stop value is shown in dark-green. When the sell value at the end of the trade is lower then the buy value, the last color of the trade will be red (best viewed when zoomed)
the EMA and SMA values for both buy and sell signals are shown as a line
the buy and sell(close) signals are labeled in blue
How to use this strategy?
Every stock has it's own "DNA", so first thing to do is tune the right parameters to get the best strategy values voor EMA , SMA, Strength for both buy and sell and the Trailing Stop (#ATR).
Look in the strategy tester overview to optimize the values Percent Profitable and Net Profit (using the strategy settings icon, you can increase/decrease the parameters)
Then keep using these parameters for future buy/sell signals only for that particular stock.
Do the same for other stocks.
Important : optimizing these parameters is no guarantee for future winning trades!
Here are the parameters:
Fast EMA Buy: buy trigger when Fast EMA Buy crosses over the Slow SMA Buy value (use values between 10-20)
Slow SMA Buy: buy trigger when Fast EMA Buy crosses over the Slow SMA Buy value (use values between 30-100)
Minimum Buy Strength: minimum upward trend value of the Fast SMA Buy value (directional coefficient)(use values between 0-120)
Fast EMA Sell: sell trigger when Fast EMA Sell crosses under the Slow SMA Sell value (use values between 10-20)
Slow SMA Sell: sell trigger when Fast EMA Sell crosses under the Slow SMA Sell value (use values between 30-100)
Minimum Sell Strength: minimum downward trend value of the Fast SMA Sell value (directional coefficient)(use values between 0-120)
Trailing Stop (#ATR): the trailing stop value as a multiple of the ATR(15) value (use values between 2-20)
Example for Bitcoin(BITFINEX:BTCUSD) (Start capital: 1000, Order=100% of equity, Period 1/1/2005 to now) compared to the Buy&Hold Strategy(=do nothing):
Fast EMA Buy=2
Slow SMA Buy=18
Minimum Buy Strength=36
Fast EMA Sell=8
Slow SMA Sell=22
Minimum Sell Strength=52
Trailing Stop (#ATR)=3
Result: 3.47 times better than Buy&Hold strategy
NetProfit: 20770%
#Trades: 25
%Profitable: 60%
Buy&HoldProfit: 5977%

XPloRR MA-Trailing-Stop Strategy on KBC(KBC) beats Buy&HoldLong term MA-Trailing-Stop strategy with Adjustable Signal Strength to beat Buy&Hold strategy
None of the strategies that I tested can beat the long term Buy&Hold strategy. That's the reason why I wrote this strategy (link see below).
Purpose: beat Buy&Hold strategy with around 10 trades over a period of 10 years (average of 1 trade/year). 100% capitalize sold trade into new trade.
My buy strategy is triggered by the fast buy EMA (blue) crossing over the slow buy SMA curve (orange) and the fast buy EMA has a certain up strength.
My sell strategy is triggered by either one of these conditions:
the EMA(6) of the close value is crossing under the trailing stop value (green) or
the fast sell EMA (navy) is crossing under the slow sell SMA curve (red) and the fast sell EMA has a certain down strength.
The trailing stop value (green) is set to a multiple of the ATR(15) value.
ATR(15) is the SMA(15) value of the difference between the high and low values.
The script shows a lot of graphical information:
One green area represents one trade
The close value is shown in light-green. When the close value is lower then the buy value, the close value is shown in light-red. This way it is possible to evaluate the virtual losses during the trade.
the trailing stop value is shown in dark-green. When the sell value at the end of the trade is lower then the buy value, the last color of the trade will be red (best viewed when zoomed)
the EMA and SMA values for both buy and sell signals are shown as a line
the buy and sell(close) signals are labeled in blue
How to use this strategy?
Every stock has it's own "DNA", so first thing to do is tune the right parameters to get the best strategy values voor EMA , SMA, Strength for both buy and sell and the Trailing Stop (#ATR).
Look in the strategy tester overview to optimize the values Percent Profitable and Net Profit (using the strategy settings icon, you can increase/decrease the parameters)
Then keep using these parameters for future buy/sell signals only for that particular stock.
Do the same for other stocks.
Important : optimizing these parameters is no guarantee for future winning trades!
Here are the parameters:
Fast EMA Buy: buy trigger when Fast EMA Buy crosses over the Slow SMA Buy value (use values between 10-20)
Slow SMA Buy: buy trigger when Fast EMA Buy crosses over the Slow SMA Buy value (use values between 30-100)
Minimum Buy Strength: minimum upward trend value of the Fast SMA Buy value (directional coefficient)(use values between 0-120)
Fast EMA Sell: sell trigger when Fast EMA Sell crosses under the Slow SMA Sell value (use values between 10-20)
Slow SMA Sell: sell trigger when Fast EMA Sell crosses under the Slow SMA Sell value (use values between 30-100)
Minimum Sell Strength: minimum downward trend value of the Fast SMA Sell value (directional coefficient)(use values between 0-120)
Trailing Stop (#ATR): the trailing stop value as a multiple of the ATR(15) value (use values between 2-20)
Example for KBC(KBC) (Start capital: 1000, Order=100% of equity, Period 1/1/2005 to now) compared to the Buy&Hold Strategy(=do nothing):
Fast EMA Buy=12
Slow SMA Buy=55
Minimum Buy Strength=56
Fast EMA Sell=12
Slow SMA Sell=55
Minimum Sell Strength=95
Trailing Stop (#ATR)=3
Result: 22.7 times better than Buy&Hold strategy
NetProfit: 590%
#Trades: 19
%Profitable: 63%
Buy&HoldProfit: 26%

XPloRR MA-Trailing-Stop Strategy on AB-Inbev(ABI) beats Buy&HoldLong term MA-Trailing-Stop strategy with Adjustable Signal Strength to beat Buy&Hold strategy
None of the strategies that I tested can beat the long term Buy&Hold strategy. That's the reason why I wrote this strategy (link see below).
Purpose: beat Buy&Hold strategy with around 10 trades over a period of 10 years (average of 1 trade/year). 100% capitalize sold trade into new trade.
My buy strategy is triggered by the fast buy EMA (blue) crossing over the slow buy SMA curve (orange) and the fast buy EMA has a certain up strength.
My sell strategy is triggered by either one of these conditions:
the EMA(6) of the close value is crossing under the trailing stop value (green) or
the fast sell EMA (navy) is crossing under the slow sell SMA curve (red) and the fast sell EMA has a certain down strength.
The trailing stop value (green) is set to a multiple of the ATR(15) value.
ATR(15) is the SMA(15) value of the difference between the high and low values.
The script shows a lot of graphical information:
One green area represents one trade
The close value is shown in light-green. When the close value is lower then the buy value, the close value is shown in light-red. This way it is possible to evaluate the virtual losses during the trade.
the trailing stop value is shown in dark-green. When the sell value at the end of the trade is lower then the buy value, the last color of the trade will be red (best viewed when zoomed)
the EMA and SMA values for both buy and sell signals are shown as a line
the buy and sell(close) signals are labeled in blue
How to use this strategy?
Every stock has it's own "DNA", so first thing to do is tune the right parameters to get the best strategy values voor EMA , SMA, Strength for both buy and sell and the Trailing Stop (#ATR).
Look in the strategy tester overview to optimize the values Percent Profitable and Net Profit (using the strategy settings icon, you can increase/decrease the parameters)
Then keep using these parameters for future buy/sell signals only for that particular stock.
Do the same for other stocks.
Important : optimizing these parameters is no guarantee for future winning trades!
Here are the parameters:
Fast EMA Buy: buy trigger when Fast EMA Buy crosses over the Slow SMA Buy value (use values between 10-20)
Slow SMA Buy: buy trigger when Fast EMA Buy crosses over the Slow SMA Buy value (use values between 30-100)
Minimum Buy Strength: minimum upward trend value of the Fast SMA Buy value (directional coefficient)(use values between 0-120)
Fast EMA Sell: sell trigger when Fast EMA Sell crosses under the Slow SMA Sell value (use values between 10-20)
Slow SMA Sell: sell trigger when Fast EMA Sell crosses under the Slow SMA Sell value (use values between 30-100)
Minimum Sell Strength: minimum downward trend value of the Fast SMA Sell value (directional coefficient)(use values between 0-120)
Trailing Stop (#ATR): the trailing stop value as a multiple of the ATR(15) value (use values between 2-20)
Example for AB-Inbev (ABI) (Start capital: 1000, Order=100% of equity, Period 1/1/2005 to now) compared to the Buy&Hold Strategy(=do nothing):
Fast EMA Buy=9
Slow SMA Buy=30
Minimum Buy Strength=40
Fast EMA Sell=16
Slow SMA Sell=63
Minimum Sell Strength=40
Trailing Stop (#ATR)=8
Result: 2.27 times better than Buy&Hold strategy
NetProfit: 1002%
#Trades: 11
%Profitable: 63%
Buy&HoldProfit: 440%

XPloRR MA-Trailing-Stop Strategy Galapagos(GLPG) beats Buy&HoldLong term MA-Trailing-Stop strategy with Adjustable Signal Strength to beat Buy&Hold strategy
None of the strategies that I tested can beat the long term Buy&Hold strategy. That's the reason why I wrote this strategy (link see below).
Purpose: beat Buy&Hold strategy with around 10 trades over a period of 10 years (average of 1 trade/year). 100% capitalize sold trade into new trade.
My buy strategy is triggered by the fast buy EMA (blue) crossing over the slow buy SMA curve (orange) and the fast buy EMA has a certain up strength.
My sell strategy is triggered by either one of these conditions:
the EMA(6) of the close value is crossing under the trailing stop value (green) or
the fast sell EMA (navy) is crossing under the slow sell SMA curve (red) and the fast sell EMA has a certain down strength.
The trailing stop value (green) is set to a multiple of the ATR(15) value.
ATR(15) is the SMA(15) value of the difference between the high and low values.
The script shows a lot of graphical information:
One green area represents one trade
The close value is shown in light-green. When the close value is lower then the buy value, the close value is shown in light-red. This way it is possible to evaluate the virtual losses during the trade.
the trailing stop value is shown in dark-green. When the sell value at the end of the trade is lower then the buy value, the last color of the trade will be red (best viewed when zoomed)
the EMA and SMA values for both buy and sell signals are shown as a line
the buy and sell(close) signals are labeled in blue
How to use this strategy?
Every stock has it's own "DNA", so first thing to do is tune the right parameters to get the best strategy values voor EMA , SMA, Strength for both buy and sell and the Trailing Stop (#ATR).
Look in the strategy tester overview to optimize the values Percent Profitable and Net Profit (using the strategy settings icon, you can increase/decrease the parameters)
Then keep using these parameters for future buy/sell signals only for that particular stock.
Do the same for other stocks.
Important : optimizing these parameters is no guarantee for future winning trades!
Here are the parameters:
Fast EMA Buy: buy trigger when Fast EMA Buy crosses over the Slow SMA Buy value (use values between 10-20)
Slow SMA Buy: buy trigger when Fast EMA Buy crosses over the Slow SMA Buy value (use values between 30-100)
Minimum Buy Strength: minimum upward trend value of the Fast SMA Buy value (directional coefficient)(use values between 0-120)
Fast EMA Sell: sell trigger when Fast EMA Sell crosses under the Slow SMA Sell value (use values between 10-20)
Slow SMA Sell: sell trigger when Fast EMA Sell crosses under the Slow SMA Sell value (use values between 30-100)
Minimum Sell Strength: minimum downward trend value of the Fast SMA Sell value (directional coefficient)(use values between 0-120)
Trailing Stop (#ATR): the trailing stop value as a multiple of the ATR(15) value (use values between 2-20)
Example for Galapagos (GLPG) (Start capital: 1000, Order=100% of equity, Period 1/1/2005 to now) compared to the Buy&Hold Strategy(=do nothing):
Fast EMA Buy=12
Slow SMA Buy=39
Minimum Buy Strength=40
Fast EMA Sell=12
Slow SMA Sell=45
Minimum Sell Strength=95
Trailing Stop (#ATR)=3
Result: 3.15 times better than Buy&Hold strategy
NetProfit: 2370%
#Trades: 21
%Profitable: 71%
Buy&HoldProfit: 752%

XPloRR MA-Trailing-Stop Strategy on Apple(AAPL) beats Buy&HoldLong term MA-Trailing-Stop strategy with Adjustable Signal Strength to beat Buy&Hold strategy
None of the strategies that I tested can beat the long term Buy&Hold strategy. That's the reason why I wrote this strategy (link see below).
Purpose: beat Buy&Hold strategy with around 10 trades over a period of 10 years (average of 1 trade/year). 100% capitalize sold trade into new trade.
My buy strategy is triggered by the fast buy EMA (blue) crossing over the slow buy SMA curve (orange) and the fast buy EMA has a certain up strength.
My sell strategy is triggered by either one of these conditions:
the EMA(6) of the close value is crossing under the trailing stop value (green) or
the fast sell EMA (navy) is crossing under the slow sell SMA curve (red) and the fast sell EMA has a certain down strength.
The trailing stop value (green) is set to a multiple of the ATR(15) value.
ATR(15) is the SMA(15) value of the difference between the high and low values.
The script shows a lot of graphical information:
One green area represents one trade
The close value is shown in light-green. When the close value is lower then the buy value, the close value is shown in light-red. This way it is possible to evaluate the virtual losses during the trade.
the trailing stop value is shown in dark-green. When the sell value at the end of the trade is lower then the buy value, the last color of the trade will be red (best viewed when zoomed)
the EMA and SMA values for both buy and sell signals are shown as a line
the buy and sell(close) signals are labeled in blue
How to use this strategy?
Every stock has it's own "DNA", so first thing to do is tune the right parameters to get the best strategy values voor EMA , SMA, Strength for both buy and sell and the Trailing Stop (#ATR).
Look in the strategy tester overview to optimize the values Percent Profitable and Net Profit (using the strategy settings icon, you can increase/decrease the parameters)
Then keep using these parameters for future buy/sell signals only for that particular stock.
Do the same for other stocks.
Important : optimizing these parameters is no guarantee for future winning trades!
Here are the parameters:
Fast EMA Buy: buy trigger when Fast EMA Buy crosses over the Slow SMA Buy value (use values between 10-20)
Slow SMA Buy: buy trigger when Fast EMA Buy crosses over the Slow SMA Buy value (use values between 30-100)
Minimum Buy Strength: minimum upward trend value of the Fast SMA Buy value (directional coefficient)(use values between 0-120)
Fast EMA Sell: sell trigger when Fast EMA Sell crosses under the Slow SMA Sell value (use values between 10-20)
Slow SMA Sell: sell trigger when Fast EMA Sell crosses under the Slow SMA Sell value (use values between 30-100)
Minimum Sell Strength: minimum downward trend value of the Fast SMA Sell value (directional coefficient)(use values between 0-120)
Trailing Stop (#ATR): the trailing stop value as a multiple of the ATR(15) value (use values between 2-20)
Example for Apple (AAPL) (Start capital: 1000, Order=100% of equity, Period 1/1/2005 to now) compared to the Buy&Hold Strategy(=do nothing):
Fast EMA Buy=12
Slow SMA Buy=45
Minimum Buy Strength=40
Fast EMA Sell=19
Slow SMA Sell=45
Minimum Sell Strength=106
Trailing Stop (#ATR)=8
Result: 2.3 times better than Buy&Hold strategy
NetProfit: 6900%
#Trades: 7
%Profitable: 71%
Buy&HoldProfit: 2938%

XPloRR MA-Trailing-Stop Strategy on Barco(BAR) beats Buy&HoldLong term MA-Trailing-Stop strategy with Adjustable Signal Strength to beat Buy&Hold strategy
None of the strategies that I tested can beat the long term Buy&Hold strategy. That's the reason why I wrote this strategy (link see below).
Purpose: beat Buy&Hold strategy with around 10 trades over a period of 10 years (average of 1 trade/year). 100% capitalize sold trade into new trade.
My buy strategy is triggered by the fast buy EMA (blue) crossing over the slow buy SMA curve (orange) and the fast buy EMA has a certain up strength.
My sell strategy is triggered by either one of these conditions:
the EMA(6) of the close value is crossing under the trailing stop value (green) or
the fast sell EMA (navy) is crossing under the slow sell SMA curve (red) and the fast sell EMA has a certain down strength.
The trailing stop value (green) is set to a multiple of the ATR(15) value.
ATR(15) is the SMA(15) value of the difference between the high and low values.
The script shows a lot of graphical information:
One green area represents one trade
The close value is shown in light-green. When the close value is lower then the buy value, the close value is shown in light-red. This way it is possible to evaluate the virtual losses during the trade.
the trailing stop value is shown in dark-green. When the sell value at the end of the trade is lower then the buy value, the last color of the trade will be red (best viewed when zoomed)
the EMA and SMA values for both buy and sell signals are shown as a line
the buy and sell(close) signals are labeled in blue
How to use this strategy?
Every stock has it's own "DNA", so first thing to do is tune the right parameters to get the best strategy values voor EMA , SMA, Strength for both buy and sell and the Trailing Stop (#ATR).
Look in the strategy tester overview to optimize the values Percent Profitable and Net Profit (using the strategy settings icon, you can increase/decrease the parameters)
Then keep using these parameters for future buy/sell signals only for that particular stock.
Do the same for other stocks.
Important : optimizing these parameters is no guarantee for future winning trades!
Here are the parameters:
Fast EMA Buy: buy trigger when Fast EMA Buy crosses over the Slow SMA Buy value (use values between 10-20)
Slow SMA Buy: buy trigger when Fast EMA Buy crosses over the Slow SMA Buy value (use values between 30-100)
Minimum Buy Strength: minimum upward trend value of the Fast SMA Buy value (directional coefficient)(use values between 0-120)
Fast EMA Sell: sell trigger when Fast EMA Sell crosses under the Slow SMA Sell value (use values between 10-20)
Slow SMA Sell: sell trigger when Fast EMA Sell crosses under the Slow SMA Sell value (use values between 30-100)
Minimum Sell Strength: minimum downward trend value of the Fast SMA Sell value (directional coefficient)(use values between 0-120)
Trailing Stop (#ATR): the trailing stop value as a multiple of the ATR(15) value (use values between 2-20)
Example for Barco (BAR) (Start capital: 1000, Order=100% of equity, Period 1/1/2005 to now) compared to the Buy&Hold Strategy(=do nothing):
Fast EMA Buy=16
Slow SMA Buy=80
Minimum Buy Strength=44
Fast EMA Sell=12
Slow SMA Sell=45
Minimum Sell Strength=82
Trailing Stop (#ATR)=9
Result: 7 times better than Buy&Hold strategy
NetProfit: 386%
#Trades: 7
%Profitable: 71%
Buy&HoldProfit: 55%
