2 buy zones Gold showing a price movement in a flag or ascending triangle, looking for buy at top resistance breakout with rejection and lower trend line rejection
Buygold

Triangle Pattern, Gold is going to 1909!Gold is looking bull after consolidation with triangle pattern
This price action would make gold go bullish to 1909 and might test 1920 level


GOLD BUYBuy opportunity 🏦 on gold for the next day ✅ Trading a small retracement 🥶 TP at 1750 SL at 1725 (big risk I know but it oscillates) Employ proper risk management and enjoy trading 👍🏿 📈

XAUUSD, Buy limit A potential Buy, Buy Limit and Wait Buy limit for a potential Buy on Gold , The price is heading to an important zone , so waiting for any reversal pattern and confirmation than go long .
PLEASE, if you like my signals and want more like and follow , Have good trades mates.
Free Powerful Signals


It is no surprise that people are buying goldCrispin Odey, one of Europe's most prominent hedge fund managers, has said governments might ban private ownership of gold if inflation runs out of control after the Covid-19 crisis.
Odey wrote:
“It is no surprise that people are buying gold.
But the authorities may attempt at some point to de-monetise gold,
making it illegal to own as a private individual.
They will only do this if they feel the need to create a stable unit of account for world trade.”
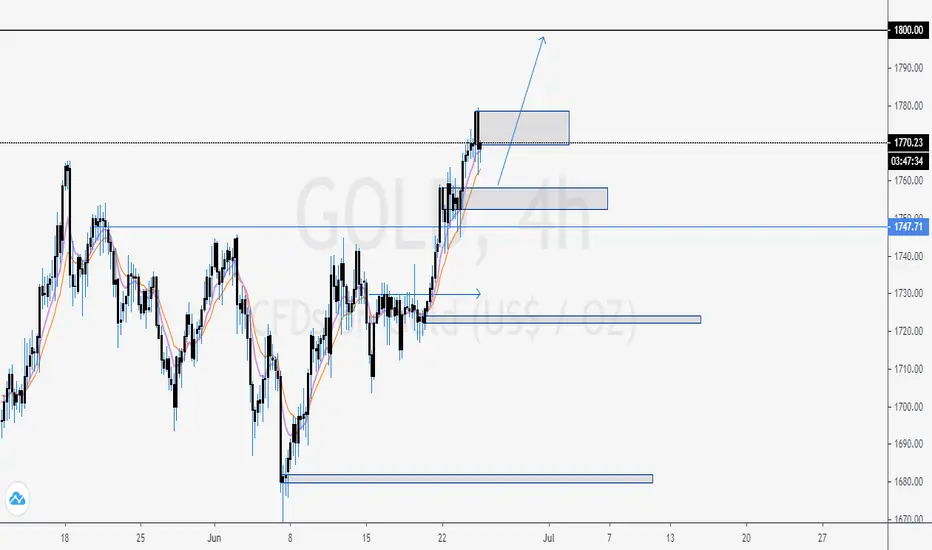
Technically gold 1764. We expect a new hold in the levels 1730-1770, followed by a new breakthrough and reaching the next resistance of 1800.
A breakthrough at these levels allows for an increase by 1839.
We will monitor the development and inform you!
Are you buying gold?


XauUsd waiting for breakout to go longThis is the way i see gold, once again i say, every drop on gold is a good opportunity to buy.
Good Trades and share your ideas!


Gold is the best TO SHORTHere is the medium term/short term nut not long term but something term forecast for gold. Look for demand at the green dotted lines. My eyes really couldnt stop looking at the yolo target at 2.618- so I market it. Lets get at her boys. And ladies lets get at him!
******This is not Financial Advice******

Xau/Usd Long after testing the 1730.00This is the way i see Gold.
Judge me the way you want but i really think and learned within my experience as trader that Every Drop On Gold is A Great Opportunity to buy
Let me know what you think!

Focus buy on GOLD!Focus on buying GOLD, waiting for a break above for confirmation.
Reason:
1. Double bottom indicates changing the trend to an uptrend, combine with bigger time frame its still an uptrend.
2. XAUUSD just finish an ascending triangle which strengthens the buyers.
3. The price did not break the third orange trendline below and keep continue bullish.
If you Agree, hit the like button to share with others how to set up a trade. FX:XAUUSD
Priority:
1. Stop loss must smaller than your take profit.
2. Must at least 2 reasons why you enter the trade.
3. Trade and Forget
Psychology:
1. Not all setup is valid, its fact, the market always changing its direction, the important is we have reason and we have analysed it.
2. Trading is predicting the market.
3. The only way to win in Forex is by controlling your lot size and your risk to reward ratio.
4. Sometimes when the price hit your stop loss but you still follow your SYSTEM, its still a good trade. READ IT AGAIN!

gold long hello traders,
as you can see, gold kept trying to break the 1642 resistance and failed to do so.
as a result, bulls gained back power and broke the bearish triangle with engulfing with a good volume (1h chart).
BUY GOLD 1st target 1680.
goodluck

15 mn buy entry on Gold for high potentiel LONG play !!!! Gold will go back on its up trend - Get ready to buy after PB

i dont trade gold much on bigger charts but its going upi dont trade gold on bigger charts but i can tell you its going up just tajke the best position and hold it if your account supports hahaha. gold will be a long buy. yes the best time to milk gold n your broker lol

gold longgold has broken a daily level to the upside, if we can get a pull back and show this holds as support with a candle rejection on the 1hr - I will look to enter for the long.

GOLD - Big correction ended ?Last week GOLD has drop heavily almost 800pip !
This movement suggest big correction has took place.
Our trade plan :
1) As critical level still intact - We will buy until Key Level only : and IF price stays above the Key Level , we suggesting more strong upward movement will continue to complete third wave impulsive.

GOLD projection until 2023This is rough assumption for GOLD to go more higher near / more than 1900+- as average all time high on 2011.
2011 high is expected as the BIG wave 3. On weekly perspective, we are in the middle of BIG wave 5.
**This count may changed as lower time frame would lead, before the major wave unfolded.

BUY GOLD AT 1611 !!!!Traders, you are getting another opportunity to ride GOLD LONG at a great RRR !!
wait until it reaches 1611, buy and 1st target 1689 then 2nd target 1720.
wish you the best of luck
