EURUSD BUY TP_1.1768_2.38%_0.0273pips_SL_1.1451_0.38%_0.0043pipsEURUSD BUY TP_1.1768_2.38%_0.0273pips_SL_1.1451_0.38%_0.0043pips
Buying

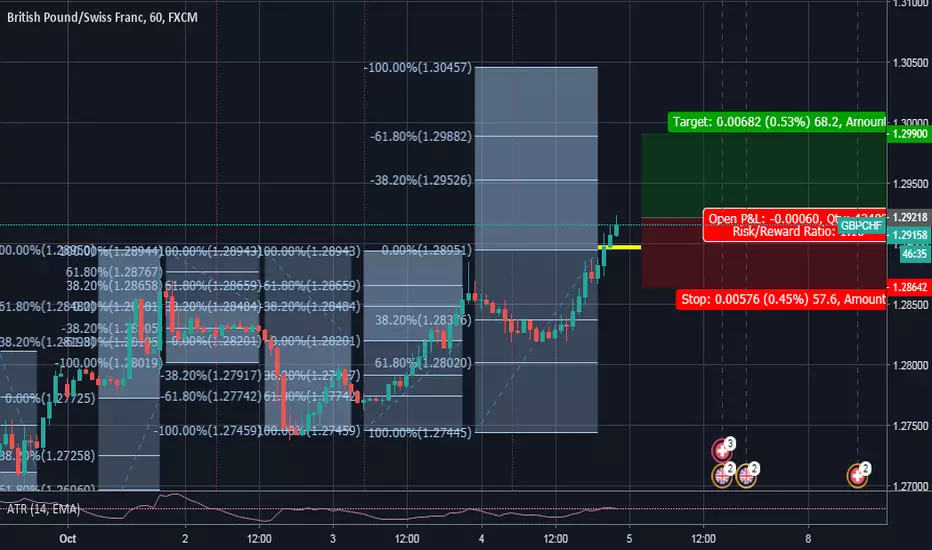
GBPCHF LongRiding the recent bullish momentum on GBP after Ireland declared support to Theresa May's Brexit plan. Buying with TP near 1.30 (68.2 fib level) and SL @1.28651 (previous period 68.2 fib level).
www.express.co.uk
Daily:
Weekly:
Confidence: B (more likelihood of reversal because of strong downtrend on higher time frame -- aka I might have gotten too excited and entered early. Best to wait and enter by next week, but oh well..)


PENN heavy purchase by CEOBought at the recent lows and price is already 10% higher. Either he has firm belief in the company or knows something. Both are good signs.
The only "black stone" is the risk reward/ratio.
Tread your path


NGL CEO buying at 11.5I like the way the chart looks. The upside might be even greater than the RR I charted.
tread your path

ZRX market structure tradingZRX looks bearish for the time being. Ever since its taken out 13401 satoshis (market structure shift level), its proceeded to make lower lows and lower highs indicated by the red boxes. Simple market structure trading. It had a nice little bounce at the demand zone around 9791 satoshis, but couldn't breach the resistance level preceding it. Take short trades on this with caution. If it doesn't bounce at current price levels, and cannot breach above 9791 satoshis should see accelerated selling once again towards the red line which is where i'll be taking profits. You can ultimately take profits inside the green zone, but I will be playing it safe and taking profits at the red line which is where an old high of a volume spike (buying pressure) is located.
TLDR: Neutral until price dips below the pink box, will then short until prices reaches the red line located at the top of the green box labeled "target zone".


ELF Insider CEO buys at lowsHe bought the dip I think It might continue climbing to the 100 MA or the trend line or the small resistance/support line.
tread your path.


Large insider buy filing in AMRBayou City Energy Management LLC increased their ownership by 12%. They purchased 422,000 shares worth $2,065,360 at an average price of $4.89. At the moment of filing the shares were priced at $4.74. Take profit at 8%, stop loss at 10%, close automatically after 14 days.

PTLA Very large buy by on InsiderI like charts that look like this with insider buying.
It seems ripe to reverse trend.
Tread you path


eurusd Outlookin upcoming week, first we will be looking for Short opportunity in any Rally to the Up side .
2nd we will be looking for Buying Opportunity on pull backs in the hope of Perfect Reversal Pattern from the Down side .
Overall we will have both opportunities in this pair in coming week .
best of luck !

MXWL Insider tradingThey already made about 10% but so many insiders buying at the bottom it has to mean something.
Looks like a bit of consolidation then hopefully shoot up.
Tread your path

DXY Dollar Index Next Trade Point Monday: Buy Dip back to 95.53 DXY Dollar Index
The dollar broke above the 95.53 line on Friday on DXY chart and surged to within 4 pips of the next line at 96.49 by the end of the day before halting.
It's a little overbought and should come off from here back to retest the 95.53 line before rallying once again.
At some point fairly soon it should go on to break above the 96.49 line and move up to the next line of resistance at 97.83.
This chart is usually the best confirming indicator there is for timing tops and bottoms across the Dollar pairs.


AT&T is on the breakout (T) 32.13AT&T has just broken it's weeklong consolidation and it's looking very bullish. Good for some solid gains if you come in now and catch it early


Large insider buy in IDT - director buys 20,000 sharesDirector buys 20,000 shares. What does he know that we don't?
