NZDUSD analysis higher chance for reversingMy opinion after analysis i expecting here from Monday bigger jump i price. The pair is be in consolidation, for now we can see low periodic moves higher, i expecting break and higher push up in price. price is saturadet, NZD one of strongest, USD is start losing power on Friday. Tuesday RBA have Interest Rate Decision which in my op will have impact on NZD can push him higher
ENTRY: 0.62950
TP: 0.63300
SL: 0.62600
If be chance i will upd TP2.
Chart time frame - 1D
Time for reaching TP - 8 - 72 hours
Follow, Like, Share or Comment
Thanks on supporting!
All best!
Buyingopportunity

Bulls cooking the trend on breakout.The price has hit a demand zone and will probably move upwards to the next resistance level.

Buying OpportunityUndervalued by 38% using Div Yield Theory, 25% <5 yr PE
-BRK's most undervalued bank holding
-Nearing 30 year demand uptrend line
- 8 years consecutive dividend increases

EOS - HEADING UPEOS is climbing up in the potential channel. I am posting here a view on my wave count and trade channel.
Alsways keep in mind that you have to count that this channel is not unbreakable, there can occur a throw-over and peaked higher as the upper line of the channel shown in chart.
But even though is trading in the channel very strong weapon for your simple imagination, range of movements and support/resistance zones.
According to conditions of market you have to adapt your counting and set your mind.
In many cases is good to have an alternate wave count scenario and be able to react on the market at the right time.
My targets for the wave 3 are the red zones. Then I expect pullback in wave 4 and after we gain a momentum with good volume I am going for the wave 5.

Nice Juicy Setup via AMD. Thanks for the Bag Homie.'bout to hit a lick on these AMD 30$ Calls. Papa needs a new Benz; lets go.

Good buying opportunity!NASDAQ:NTAP Trigger: $63.66 after a pullback. Buy Stop: above 62.66.
Please like and comment if you like my ideas. THANK YOU!!!
Please note that this information is not a recommendation to buy or sell. It is to be used for educational purposes only.

Gold hitted sell break even now we are going long big time Gold hitted break even . Now its buy signal from fibo levels and other confirmations. After fact that it did not sold off, and hited our protective stop so we now for sure now it will run up.
Unfortunately its not good for economy. Because you know the reason. Hard times coming to people . Prepare and be safe.
Take care

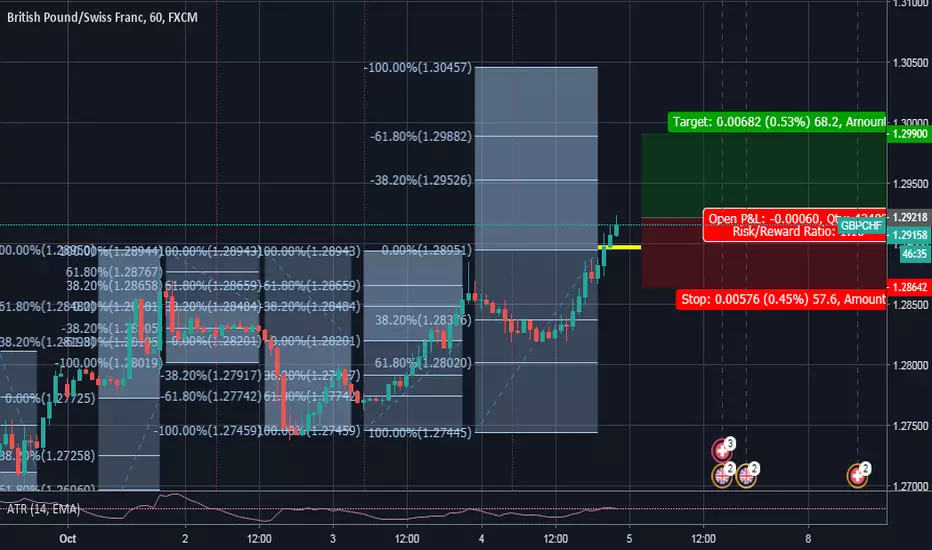
GBPCHF LongRiding the recent bullish momentum on GBP after Ireland declared support to Theresa May's Brexit plan. Buying with TP near 1.30 (68.2 fib level) and SL @1.28651 (previous period 68.2 fib level).
www.express.co.uk
Daily:
Weekly:
Confidence: B (more likelihood of reversal because of strong downtrend on higher time frame -- aka I might have gotten too excited and entered early. Best to wait and enter by next week, but oh well..)
VZ resist the overall decline. This is bullishThe price and volume relationship reveals the preparation for the upcoming break-out

BABA panic selling Alibaba stock market chart reveals the entering of demand. That is why I suppose the good news is coming.

AA Strong 1D supportAA 1D support line ranges back to late 2016, showing VERY strong trendline. Should be a good buy around this area and possibly ride it up to resistance in 2-4 months.

MODBTC a great mid term opportunityThe last analysis for this coin was about 2 month ago and we made a little profit. There is another opportunity to bust your portfolio. The price found support and an uptrend has started. The price went out of Ichi cloud, we expect a little consolidation before another bull run will start.

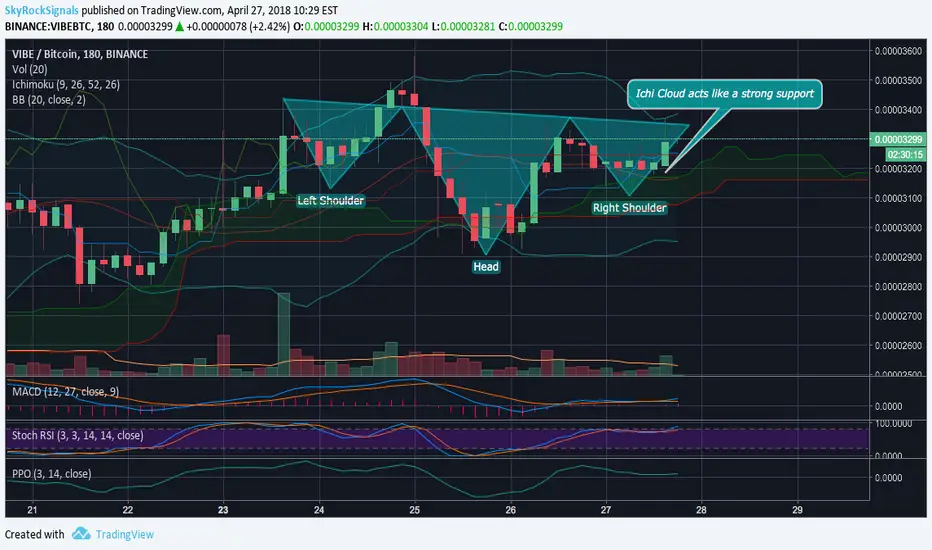
VIBEBTC Reversed H&SWe found a finished reversed H&S pattern and analyzed technical indicators which are bullish now. It seems like Ichi Cloud acts like a strong support zone, the price bounces from the upper edge of it. Chikou Span line is above Tenkan-sen line which means lagged for m periods close price is higher than the line of reverse so there should be a bounce which will start uptrend. Reversed H&S pattern has been formed which enhances our forecast
Btc to draw back? should do!Hey a quick update, hope you guys caught the spike too. I've sold my position currently as i have a few indicators showing a drawback is due, my target is 7.2k-7.5k before another climb. Not trade advice blah blah xx

Neo seems to be consistent with its patterns!Seems like Neo is headed for a downward turn after it sparks up to its high of yesterday's price $56. I have marked up its 3 key line prices for Neo to watch for. The most important price is its heavy support at the $50 price point I'm almost certain we will be touch this supporting line within this week and it will be something I will be paying close attention to. If we can stay within the $50 support it will determine whether we can bounce back to the $60 price range, BUT if we lose our support at 50 we are looking at the all time lows of $40 range from last week. The 40 price point is weighing in favor more than the bullish scenario I have said. For now I'll be holding cash in order to buy in at the low 40 dollar price point which I have boxed up in the graph as a buying opportunity for yourselves and I.
To recap. 3 key lines -> 1) $56 bull trap I'm expecting within the next 2 days.
2) $50 key support will determine if we go up or down.
3) $44 all time low that I will be expecting to happen once we lose our key support at $50.

SNGLSBTC continuous XABCDAfter Gartley Butterfly pattern was formed the price went up to the 0.00000850 level. We expect another XABCD pattern will be formed, hence the price should decrease to the buying zone in the signal. If it happens the price will go up from mentioned zone and will reach our targets. Momentum, MACD (12, 27), EMA (10), SMA (10, 20, 30) and HMA are in the bullish state. This is a good mid term trading opportunity


LTC/USD - Top Down Nake Chart Analysis - Just My Opinion My quick top down analysis on LTC for the day and what i'm looking at in the chart. While we've had a nice sell off so far today, i'm looking for a little more downside. I think we are sitting just above a nice area of demand on the 4HR and will be looking to add long deeper in this zone.
BTW... we did test and break $150, as i expected from my last video!! Just saying!
Leave me a comment and let me know what you think.


MUEBTC double bottom is formingVolume is rising, Stoch RSI is in the oversold state. We see a possibility of Double bottom formation to be finished on the 4-hour chart. Although BTC fluctuates hard this can be a safe long-term trade, targets are mentioned on the chart

XRP/USD - Another Buying Opp To Be HadVideo update on XRP with my thoughts, as i believe we could see some more downside in price action, which in my opinion = Buy Opportunity.
Give a like and leave me a comment with your throughts. I think you'll find some of my comments in the video of interest in terms of FUD/Bad News.

CLOAKBTC Cup&HandleMACD Level (12, 27), MA and EMA (10, 20, 50, 100, 200) indicate a buy state. On the 1-hour chart there is a cup and handle formation which is confirmed by Stoch RSI, Aroon (14) and Fib retracement levels. The price should go down to Fib 0.786 support level and then bounce back to the Fib 0.618 resistance level. Our signal for this coin is already in the Premium channel

Trading idea to go long on NGDaily LH already break..Will try to find buy position as long price dont break HL
