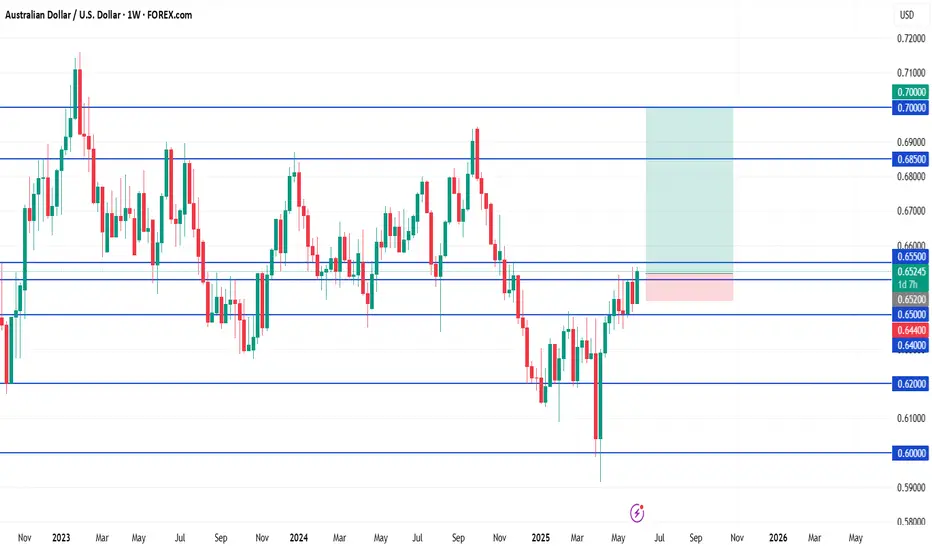
AUD/USD BuyBuy (Bullish breakout continuation)
✅ Entry Conditions (Wait for confirmation first):
Daily candle must close above 0.6550 with strength (not a wick rejection).
After breakout, wait for a retest back into the 0.6500–0.6520 zone.
Only enter if price shows bullish rejection off that zone (e.g., wick rejections, bullish engulfing, or small-bodied doji followed by green candle).
📍 Trade Setup
Buy Limit– 0.6520
Stop Loss (SL): 0.6440 (below the retest structure)
Take Profit 1 (TP1): 0.6700
Take Profit 2 (TP2): 0.6850
(Optional TP3): 0.7000 (stretch target)
Buyopportunity
[LONG IDEA] $BULL Falling Wedge - Reversal Any Day Now!!NASDAQ:BULL has been consolidating in a tight bearish range over the past few days. A potential long entry is at $10.47 with a stop loss at $9.00, offering a favorable risk-to-reward setup.
However, if the price closes below $9.50, consider switching bias and taking a short position.

$GALA Holding Support – Breakout Coming?INDEX:GALA is holding strong above the trendline support and showing signs of a bounce.
The price is now approaching a key descending trendline a breakout here could lead to a solid move toward $0.021–$0.026 📈
As long as it stays above the trendline, bulls are in control.
#GALA #ALTSEASON

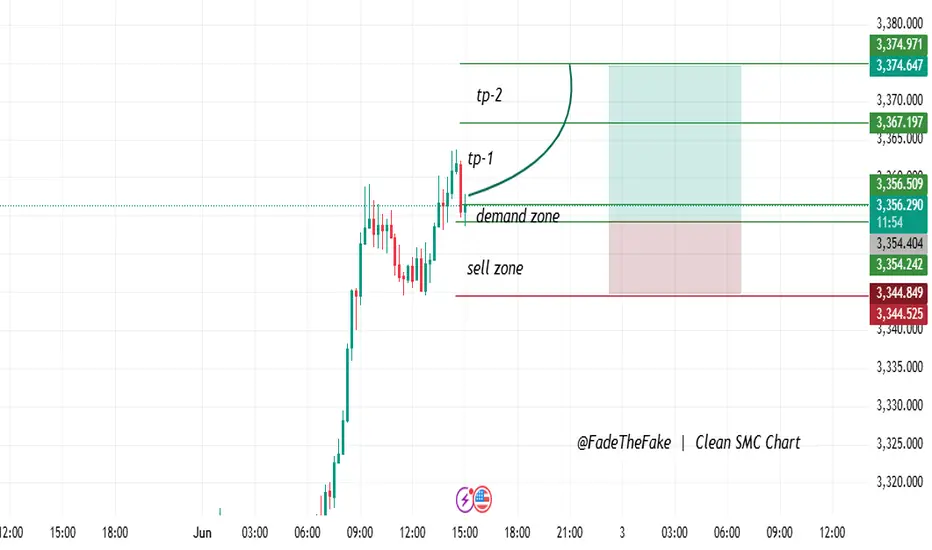
"Demand Zone Play – Targeting Fresh Highs!"Clean Buy Setup | Reaction in Demand Zone
- Price has touched a well-defined demand zone.
- Confirmed bullish reaction with good wick rejections.
- Placed entry just above the zone, stop loss below structural low.
- Targeting more liquidity zones as TP1 and TP2.
Entry: 3356.50
SL: 3344.50
TP1: 3367.20
TP2: 3374.97
This concept draws on a blend of Smart Money Ideas and Demand/Supply Zones
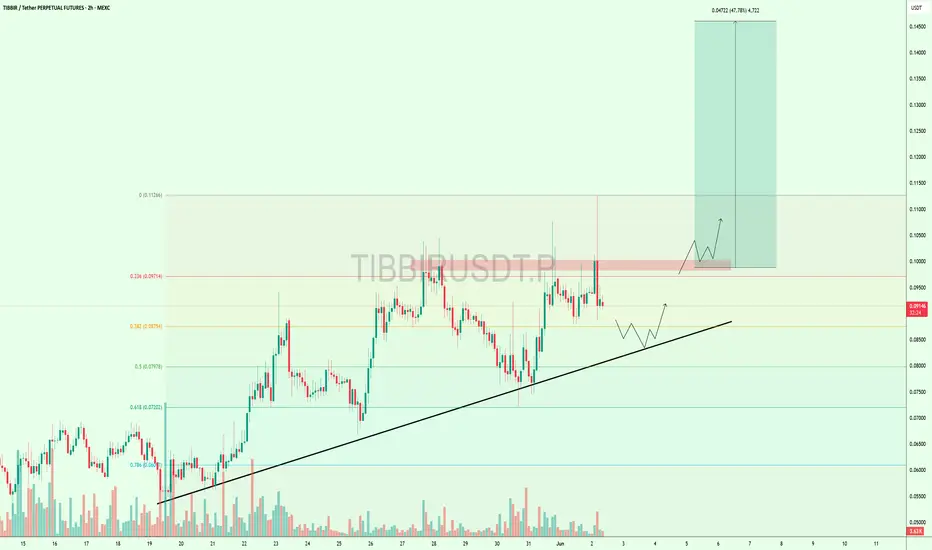
Price Cooling Off – But $TIBBIR Still Looks Bullish$TIBBIR is trying to break above the 0.097 resistance, but it hasn’t succeeded yet.
The price is now pulling back and might test the uptrend support line around 0.085–0.087. This area has helped the price bounce before.
If the support holds and price moves back up, we could see a strong move toward 0.1126 that’s nearly +47% higher.
Keep watching a breakout could come soon! 👀
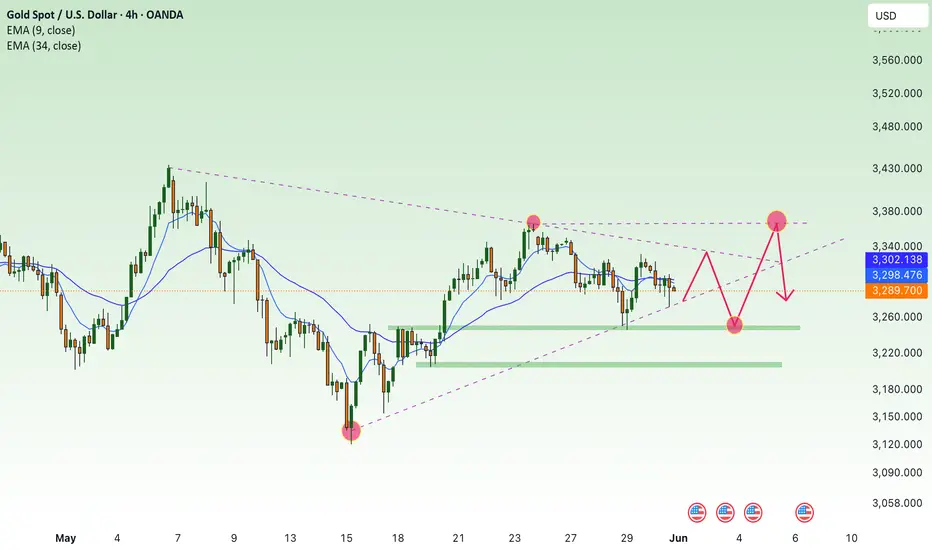
Buyers Stepping In – Is $XAUUSD Ready to Move?Gold is still holding the key support zone around $3,285–$3,290 and slowly gaining strength.
As long as this level holds, we could see the price move up to $3,320, and if momentum stays strong, maybe even $3,340+.
The structure looks good, and buyers are stepping in.
Keep an eye on a possible breakout above the dotted trendline. 👀
#XAUUSD

Bitcoin Wasn't Built for Bull Runs — It Was Built for This MomenDear traders,
You may be witnessing a “first” — a pivotal moment right before things begin to spiral.
We’re not fortune tellers. We don’t claim to predict the future.
But what you’re about to read is based entirely on **publicly available data**, interpreted not through speculation, but through a deep, rational analysis of interconnected facts — the kind of connections that most overlook, and few dare to question.
We may not know how the future is being orchestrated behind the scenes...
But one thing seems certain: **crisis always comes first...** and *then* we are given a **narrative** to justify it — be it war, a pandemic, or a "global emergency."
This is the correct sequence... and it’s the one they never teach you.
Yet for those of us who navigate the financial markets, one question matters more than all others:
**How do we profit from this?**
---
We recently shared an important setup on the **Nasdaq index**, the benchmark that reflects — to a large extent — the true state of the U.S. economy.
As a proxy for the 100 largest American corporations, the Nasdaq plays a critical role in signaling macro trends.
And while some are just now waking up to the storm ahead, **our outlook has been clear since October 2022**:
A major economic crisis was not only probable… it was **inevitable**.
Some analysts chalk this up to uncontrolled money printing post-2019 as governments tried to patch the damage from the COVID-19 crisis. That’s one explanation.
But at **Glich**, our vision is different.
More complex.
And for now… **not something we can fully release**.
---
For years, strong correlations between **risk markets** — especially U.S. equities and crypto — held firmly in place.
But something changed on **May 30th, 2025**. Completely and unmistakably.
The link was severed.
Now ask yourself:
**Why was Bitcoin created in the first place?**
It wasn’t just digital money.
It was a bold, revolutionary idea. A system designed for a future economy no longer shackled by inflation, central banking failures, or hidden agendas.
A fluid, transparent, and secure network for a world in desperate need of change.
The current financial model is obsolete. It’s no longer evolving — just surviving.
And it can no longer answer the challenges of what's to come.
**2008 was not the collapse; it was the setup.** A convenient pretext to slowly roll out something **new**.
And "Satoshi Nakamoto"? Well, let’s just say...
**That name means more than you think.**
_"HIDDEN INFORMATION"_ 👁️
---
What does NEO mean when he says:
> "This has all happened before… yet it’s happening for the first time"?
And what does that have to do with us?
This analysis is *not* just about charts or setups.
It’s a **hidden message** — a spotlight on a once-in-a-generation opportunity lying in plain sight.
But not everyone is trained to read between the lines.
---
Let us ask:
- Why was **Donald Trump** specifically pushed into position?
- Why is crypto — after being suppressed, banned and attacked worldwide — now being quietly **promoted** and fast-tracked in legislation during 2024 and 2025?
Something’s moving beneath the surface.
---
### 🔍 In summary:
- Expect a tidal wave of **global crypto legislation** to pass in the coming **days/weeks/months**.
- Crypto — particularly **BTC and ETH** — will become silent **stores of value** during the economic storm.
- Expect record-breaking levels: **$400K for Bitcoin**, **$40K for Ethereum**.
Yes, this may sound like science fiction…
But keep your eyes and ears wide open. 👁️
- And brace yourself for a **historic collapse** in U.S. equities. Possibly… something we’ve never seen before.
---
The show is starting.
And we won’t spoil the ending — because watching it unfold is part of the experience.
But here’s what we *can* say, thanks to our proprietary **algorithmic system**:
- The **U.S. economy will bleed**.
- And crypto will blow past expectations — fulfilling the very purpose it was built for.
---
🛒 Load your bags in the coming days...
Because when this train leaves the station —
It won't be stopping for anyone.

Continue to maintain stability above 3300, next week✍️ NOVA hello everyone, Let's comment on gold price next week from 06/02/2025 - 06/06/2025
🔥 World situation:
Gold prices declined on Friday, pressured by a rebound in the US Dollar, even as US Treasury yields dipped in response to a robust inflation report. Despite the yield pullback, expectations remain firm that the Federal Reserve could begin easing policy in 2025. At the time of writing, XAU/USD is down 0.83%, trading around $3,289.
Market sentiment turned more risk-averse after US President Donald Trump sharply criticized China, accusing Beijing of breaching the trade agreement reached during talks in Switzerland. In a post, Trump wrote, “China, perhaps not surprisingly to some, HAS TOTALLY VIOLATED ITS AGREEMENT WITH US. So much for being Mr. NICE GUY!”—a statement that reignited geopolitical tensions and added to market uncertainty.
🔥 Identify:
Gold price is in great competition between buyers and sellers around the price range of 3200 - 3300. Tariff policies are coming back, the trump administration is putting pressure to get favorable tariffs.
🔥 Technically:
Based on the resistance and support areas of the gold price according to the H4 frame, NOVA identifies the important key areas as follows:
Resistance: $3332, $3365
Support: $3244, $3204
🔥 NOTE:
Note: Nova wishes traders to manage their capital well
- take the number of lots that match your capital
- Takeprofit equal to 4-6% of capital account
- Stoplose equal to 2-3% of capital account
- The winner is the one who sticks with the market the longest
NEAR to $45? The Signs Are All There…Just imagine traveling through time.
Many people look back with regret, wishing they had invested in cryptocurrencies before previous bullish cycles. We've all heard phrases like "If only I had bought Bitcoin at $100, I'd be a millionaire by now."
But the real question is: Will you have the courage to make the right decision when the moment comes?
You might think I'm crazy for presenting these targets today — and that's okay. But trust me, in a few months, you'll witness the phenomenal power of our analysis system. The market is fractal by nature; what happens on lower timeframes inevitably plays out on higher ones.
NEAR is one of the most promising blockchains, and all signals are aligning for a move toward $45.
The question is: Do you have the courage to take action now?

Winter Is Coming — And LINK Is Leading the Charge (x25) Chainlink acts as a bridge between blockchain and the real world.
This asset has been on our radar for years, silently building strength. Its fundamentals are rock-solid, and the current price action is highly favorable for a strategic buy.
📈 On November 12, 2023, LINK officially confirmed its journey to $400 by breaking through our algorithmic confirmation zone. Since then, it’s shown a modest price increase… and right now, it's retesting one of the best buy zones we've seen.
But here's the catch:
In the coming weeks, we expect explosive rallies — the kind that won’t allow for optimal entries anymore.
✅ We are currently positioned long on LINK, and it’s proving to be one of our strongest investments to date.
And remember:
The assets we publish on TradingView have already confirmed their trajectory toward our predicted targets.
🎬Not even Trump... not even a world war could stop what’s coming.
🚀 Buckle up... because winter is coming.
And LINK is ready to lead the storm.
🔍 Disclaimer: This is our personal analysis and not financial advice. Always do your own research before making any investment decisions.
💬 What’s your take on this? Drop your thoughts in the comments and feel free to share this with your friends! ❤️

ETH Investors Are Confused, But the Algorithm Says $40K's Coming🚨 Ethereum: Confusion or Opportunity?
Many investors are currently confused — wondering whether Ethereum (ETH) is due for a deeper retracement… or if it’s about to skyrocket. So, what’s really going on?
According to our algorithmic model, ETH confirmed a long-term price target of $40,000 the moment it broke above $3,594 on March 11, 2024.
The pullback that followed?
It’s not a sign of weakness — it’s a golden entry opportunity for the next leg up with a garenteed x15 ROI from actual prices.
📉 The $883 low is considered a protected low, and according to our structure, it will likely remain untouched until ETH reaches $40,000.
💰 Why We’re Heavily Exposed to ETH
Given the current market conditions, we’ve allocated the majority of our capital to Ethereum, as it currently represents one of the most secure and promising assets in the crypto space for mid- to long-term positioning.
This isn’t just a trade — it’s a strategic investment.
🚀 Happy Trading,

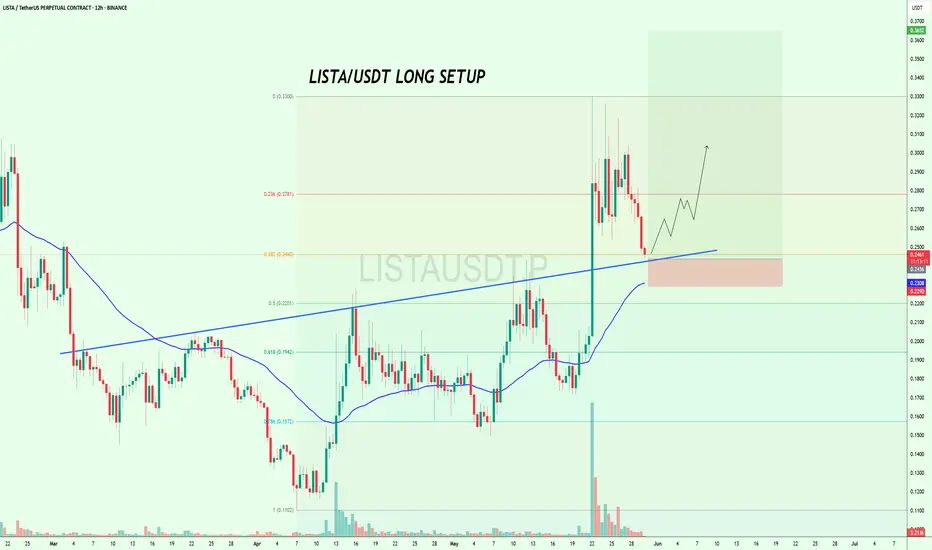
$LISTA at Key Support – Long Opportunity Loading?$LISTA looks good to long here with a short SL🚀
It is approaching a key confluence support zone right at the 0.382 Fib level (~0.2460), the rising trendline, and the 100EMA on the 12H chart.
This level held well in the last move and could once again act as the launchpad for a bullish breakout toward $0.30–$0.33.
But if it breaks below this support zone, short-term momentum could shift.
Watch how the price reacts here👀
BINANCE:LISTAUSDT
$BUSDT Ready to Explode? Breakout Could Send It Flying#BUSDT is demonstrating strong potential for a pennant breakout.
A successful breakout could trigger a +60% bullish rally in the coming days. 🚀
#Altseason2025

Unity Software (U) – Strong Earnings and Bullish FlowsFundamental Overview
Unity Software has been consolidating within a defined range for approximately a year following a significant decline in its stock price. Despite previous challenges, the company has consistently surprised investors with its earnings over the past year, maintaining strong performance. Historically, Unity tends to perform well during the May–June period. Looking ahead, projections suggest a decline in net margin, though net income is expected to increase, reinforcing the company's strong execution.
Additionally, Unity has exceeded expectations for four consecutive earnings reports, underscoring its resilience and growth trajectory.
Technical Outlook
- Momentum & Price Action: The stock exhibits solid momentum and is currently situated in a buy zone.
- Options Flow: Bullish sentiment is evident in options activity, signaling strong institutional interest.
- Analyst Ratings:
- Needham analyst Bernie McTernan maintains a Buy rating but lowers the price target from $33 to $30.
- Barclays analyst Ross Sandler maintains an Equal-Weight rating and lowers the price target from $26 to $25.
Given the current trends, bullish options flows, and favorable seasonality, Unity Software appears poised to test $25 in the upcoming weeks, particularly if momentum continues to drive price action.

XAUUSD Long PositionI've just entered this Long position on Gold and I'm looking to hold this position and eventually sell when price reaches the short-term resistance level at around the "3,360.00" area.
#GOLD #XAU #XAUUSD #LONG #BUY OANDA:XAUUSD

$EGLD Gearing Up for Next Leg – Bull Flag in PlayCRYPTOCAP:EGLD is forming a clean bull flag on the 6H chart after a strong move up.
Price is holding the trendline, and a breakout above $19.7 could target $27 that’s a 47% potential move.
This setup appears solid, incorporating confluence from Fib levels and volume zones.
Eyes on this breakout that could be explosive.
Flag breakout incoming?
DYOR, NFA.
#EGLDUSDT #Altseason2025

$AXIBT Breakout Confirmed – 2x Potential Ahead?$AXIBT just broke above a key accumulation zone after days of consolidation.🚀
Strong volume, bullish Ichimoku support, and a clean breakout above resistance suggest this could be the start of a major move.
If this rally continues, we could see a sharp push toward the $0.50+ zone, nearly 2x from here.
Reclaiming and holding above the $0.22–$0.24 zone is crucial for confirmation.
Eyes on this one.

Symmetrical Triangle Breaks – $ETHFI Targets $2+CRYPTOCAP:ETHFI just broke out of a strong symmetrical triangle on the 2H chart finally escaping a long consolidation phase.
Price surged above resistance and reclaimed key EMAs, showing clear bullish momentum. If this breakout sustains, the next leg could take us toward $2.00+
Risk is tight below $1.27 the breakout zone and previous resistance-turned-support.
This move could be the start of something big.
Watch closely!

$RWA Breakout Alert – Trend Reversal in Play?LSE:RWA just broke out of a falling channel with strong volume — signaling a potential trend reversal.
It’s now retesting the breakout zone near the 0.382–0.5 Fib level, which could act as a support area before the next leg up.
If this reclaim holds, upside targets extend toward $0.017+—a 40%+ move from here.
Keep it on your radar.
DYOR, NFA.

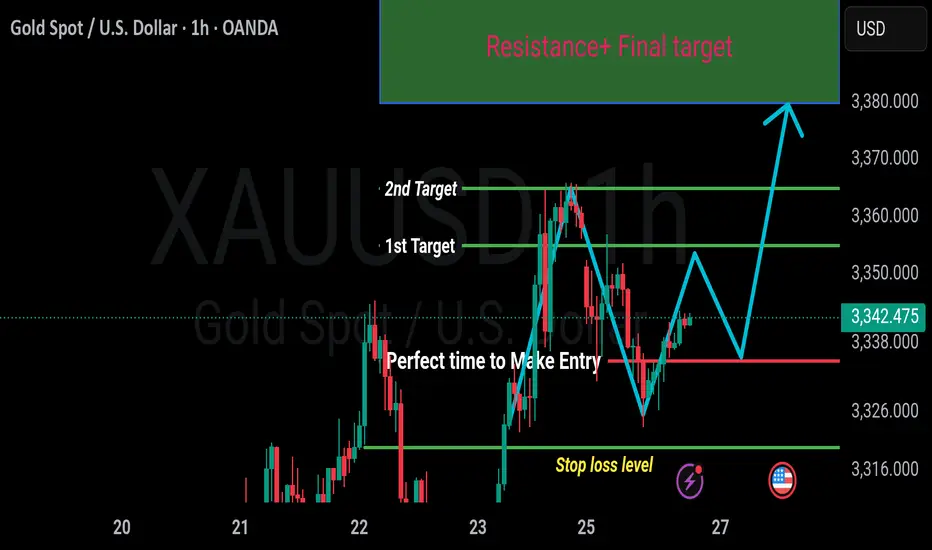
Gold (XAU/USD) Technical Analysis – Short-Term OutlookCurrent Price Range: 3340 – 3350 USD
Trend Bias: Strong Bullish
Time Frame Focus: Intraday to Short-Term (H1/H4)
---
Price Structure & Trend
Gold is currently consolidating within a narrow range of 3340 to 3350, forming a bullish continuation pattern (likely a flag or a pennant). The current consolidation is occurring after a strong bullish impulse, which signals a potential for trend continuation to the upside.
This behavior is consistent with accumulation before breakout, often seen in trending markets. The presence of higher highs and higher lows on the H1 and H4 charts supports the bullish bias.
---
Key Levels
Zone Level Significance
Support 3335 Pullback zone / Potential entry area
Minor Support 3320 Stop loss zone / Break of structure risk
Resistance 1 3365 Initial profit target / minor resistance
Resistance 2 3375 Midway resistance / partial exit level
Major Resistance 3380–3400 Final target zone / Strong supply area
---
Entry & Setup
Entry Zone: 3335–3355 (ideal is a retest of 3335 with confirmation candle)
Entry Type: Long (Buy) on support retest + bullish candle confirmation (pin bar, engulfing, etc.)
Stop Loss: Below 3320 (tight risk, below structure support)
Take Profits:
TP1: 3365
TP2: 3375
TP3: 3400 (final target)
Risk:Reward Ratio (Approximate):
From entry at 3335: R:R = 1:2.5 to 1:3.5 depending on target
From entry at 3350: R:R = 1:1.5 to 1:2.5
---
Technical Indicators
RSI: Likely in the 55–65 zone on H1/H4, indicating strength but not yet overbought.
MACD: Histogram positive, signal line above zero, supporting bullish momentum.
Volume: Look for rising volume on bullish candles and low volume on pullbacks.
---
Chart Patterns & Observations
Bullish Flag / Pennant: Suggests a continuation of the prior bullish move.
No bearish divergence observed (if indicators used).
Trendline support: Can draw ascending trendline connecting recent swing lows.
---
Conclusion & Strategy
Gold remains in a bullish phase with clear consolidation before potential breakout. Best opportunity is a buy on dip, ideally on a clean retest of 3335–3340 support zone with proper confirmation.
If gold breaks above 3355–3360 with momentum, aggressive traders may consider a breakout entry with reduced risk and tighter stops below 3340.
Avoid entries below 3320 as this would invalidate the bullish structure and may indicate a shift in trend.
$PENGU Approaching Apex – Breakout Watch On!CSECY:PENGU is forming a symmetrical triangle on the 4H chart, and price is getting close to the apex.
It’s currently holding above the support trendline and the 200 EMA a key zone to watch.
A breakout above the triangle could push the price toward the $0.022–$0.023 range.
I’m watching closely. If it breaks out with strong volume, it could be a solid setup.
Use a tight stop-loss and manage your risk properly.

$BEAM Coiling Up in the Golden Zone – Breakout Incoming?NASDAQ:BEAM is consolidating inside a symmetrical triangle, right near the 0.5–0.618 Fib golden pocket a zone where strong moves often begin.
It’s a clean setup with a good risk-reward and a clear stop-loss.
Keeping this on watch and accumulating inside the pattern, a breakout could push the price toward $0.009 or higher.
DYOR, NFA

$NXPC Rebounding from Golden Zone!!$NXPC
Based on the Fib retracement, the price is currently sitting in the golden zone between 0.5–0.618 levels a common area for strong bounces.
Also, the price is reacting well near the demand zone, and a small falling wedge has just broken out.
This setup offers a clean risk-reward with tight invalidation.
I’m keeping a close eye on it could be a solid opportunity if momentum builds.
