NEAR to $45? The Signs Are All There…Just imagine traveling through time.
Many people look back with regret, wishing they had invested in cryptocurrencies before previous bullish cycles. We've all heard phrases like "If only I had bought Bitcoin at $100, I'd be a millionaire by now."
But the real question is: Will you have the courage to make the right decision when the moment comes?
You might think I'm crazy for presenting these targets today — and that's okay. But trust me, in a few months, you'll witness the phenomenal power of our analysis system. The market is fractal by nature; what happens on lower timeframes inevitably plays out on higher ones.
NEAR is one of the most promising blockchains, and all signals are aligning for a move toward $45.
The question is: Do you have the courage to take action now?
Buyopportunity

Winter Is Coming — And LINK Is Leading the Charge (x25) Chainlink acts as a bridge between blockchain and the real world.
This asset has been on our radar for years, silently building strength. Its fundamentals are rock-solid, and the current price action is highly favorable for a strategic buy.
📈 On November 12, 2023, LINK officially confirmed its journey to $400 by breaking through our algorithmic confirmation zone. Since then, it’s shown a modest price increase… and right now, it's retesting one of the best buy zones we've seen.
But here's the catch:
In the coming weeks, we expect explosive rallies — the kind that won’t allow for optimal entries anymore.
✅ We are currently positioned long on LINK, and it’s proving to be one of our strongest investments to date.
And remember:
The assets we publish on TradingView have already confirmed their trajectory toward our predicted targets.
🎬Not even Trump... not even a world war could stop what’s coming.
🚀 Buckle up... because winter is coming.
And LINK is ready to lead the storm.
🔍 Disclaimer: This is our personal analysis and not financial advice. Always do your own research before making any investment decisions.
💬 What’s your take on this? Drop your thoughts in the comments and feel free to share this with your friends! ❤️

ETH Investors Are Confused, But the Algorithm Says $40K's Coming🚨 Ethereum: Confusion or Opportunity?
Many investors are currently confused — wondering whether Ethereum (ETH) is due for a deeper retracement… or if it’s about to skyrocket. So, what’s really going on?
According to our algorithmic model, ETH confirmed a long-term price target of $40,000 the moment it broke above $3,594 on March 11, 2024.
The pullback that followed?
It’s not a sign of weakness — it’s a golden entry opportunity for the next leg up with a garenteed x15 ROI from actual prices.
📉 The $883 low is considered a protected low, and according to our structure, it will likely remain untouched until ETH reaches $40,000.
💰 Why We’re Heavily Exposed to ETH
Given the current market conditions, we’ve allocated the majority of our capital to Ethereum, as it currently represents one of the most secure and promising assets in the crypto space for mid- to long-term positioning.
This isn’t just a trade — it’s a strategic investment.
🚀 Happy Trading,

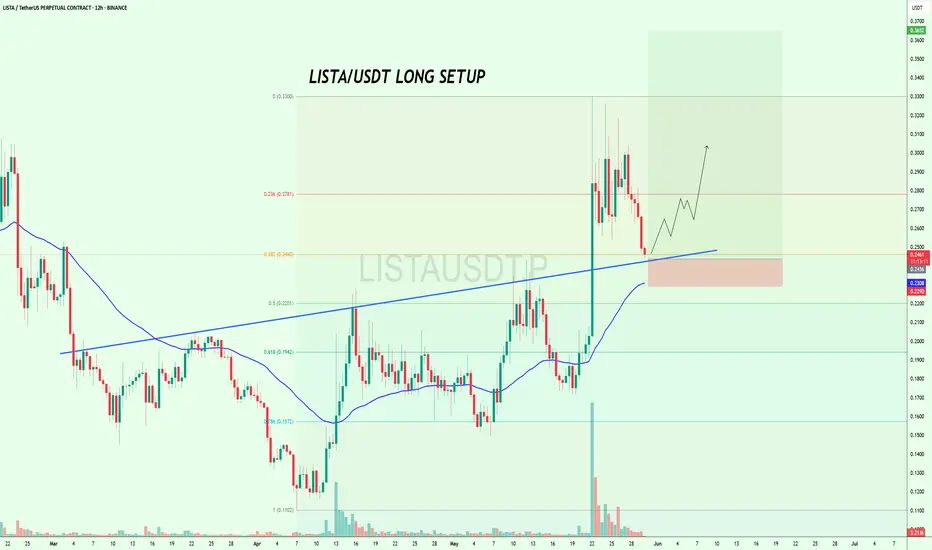
$LISTA at Key Support – Long Opportunity Loading?$LISTA looks good to long here with a short SL🚀
It is approaching a key confluence support zone right at the 0.382 Fib level (~0.2460), the rising trendline, and the 100EMA on the 12H chart.
This level held well in the last move and could once again act as the launchpad for a bullish breakout toward $0.30–$0.33.
But if it breaks below this support zone, short-term momentum could shift.
Watch how the price reacts here👀
BINANCE:LISTAUSDT
$BUSDT Ready to Explode? Breakout Could Send It Flying#BUSDT is demonstrating strong potential for a pennant breakout.
A successful breakout could trigger a +60% bullish rally in the coming days. 🚀
#Altseason2025

Unity Software (U) – Strong Earnings and Bullish FlowsFundamental Overview
Unity Software has been consolidating within a defined range for approximately a year following a significant decline in its stock price. Despite previous challenges, the company has consistently surprised investors with its earnings over the past year, maintaining strong performance. Historically, Unity tends to perform well during the May–June period. Looking ahead, projections suggest a decline in net margin, though net income is expected to increase, reinforcing the company's strong execution.
Additionally, Unity has exceeded expectations for four consecutive earnings reports, underscoring its resilience and growth trajectory.
Technical Outlook
- Momentum & Price Action: The stock exhibits solid momentum and is currently situated in a buy zone.
- Options Flow: Bullish sentiment is evident in options activity, signaling strong institutional interest.
- Analyst Ratings:
- Needham analyst Bernie McTernan maintains a Buy rating but lowers the price target from $33 to $30.
- Barclays analyst Ross Sandler maintains an Equal-Weight rating and lowers the price target from $26 to $25.
Given the current trends, bullish options flows, and favorable seasonality, Unity Software appears poised to test $25 in the upcoming weeks, particularly if momentum continues to drive price action.

XAUUSD Long PositionI've just entered this Long position on Gold and I'm looking to hold this position and eventually sell when price reaches the short-term resistance level at around the "3,360.00" area.
#GOLD #XAU #XAUUSD #LONG #BUY OANDA:XAUUSD

$EGLD Gearing Up for Next Leg – Bull Flag in PlayCRYPTOCAP:EGLD is forming a clean bull flag on the 6H chart after a strong move up.
Price is holding the trendline, and a breakout above $19.7 could target $27 that’s a 47% potential move.
This setup appears solid, incorporating confluence from Fib levels and volume zones.
Eyes on this breakout that could be explosive.
Flag breakout incoming?
DYOR, NFA.
#EGLDUSDT #Altseason2025

$AXIBT Breakout Confirmed – 2x Potential Ahead?$AXIBT just broke above a key accumulation zone after days of consolidation.🚀
Strong volume, bullish Ichimoku support, and a clean breakout above resistance suggest this could be the start of a major move.
If this rally continues, we could see a sharp push toward the $0.50+ zone, nearly 2x from here.
Reclaiming and holding above the $0.22–$0.24 zone is crucial for confirmation.
Eyes on this one.

Symmetrical Triangle Breaks – $ETHFI Targets $2+CRYPTOCAP:ETHFI just broke out of a strong symmetrical triangle on the 2H chart finally escaping a long consolidation phase.
Price surged above resistance and reclaimed key EMAs, showing clear bullish momentum. If this breakout sustains, the next leg could take us toward $2.00+
Risk is tight below $1.27 the breakout zone and previous resistance-turned-support.
This move could be the start of something big.
Watch closely!

$RWA Breakout Alert – Trend Reversal in Play?LSE:RWA just broke out of a falling channel with strong volume — signaling a potential trend reversal.
It’s now retesting the breakout zone near the 0.382–0.5 Fib level, which could act as a support area before the next leg up.
If this reclaim holds, upside targets extend toward $0.017+—a 40%+ move from here.
Keep it on your radar.
DYOR, NFA.

$PENGU Approaching Apex – Breakout Watch On!CSECY:PENGU is forming a symmetrical triangle on the 4H chart, and price is getting close to the apex.
It’s currently holding above the support trendline and the 200 EMA a key zone to watch.
A breakout above the triangle could push the price toward the $0.022–$0.023 range.
I’m watching closely. If it breaks out with strong volume, it could be a solid setup.
Use a tight stop-loss and manage your risk properly.

$BEAM Coiling Up in the Golden Zone – Breakout Incoming?NASDAQ:BEAM is consolidating inside a symmetrical triangle, right near the 0.5–0.618 Fib golden pocket a zone where strong moves often begin.
It’s a clean setup with a good risk-reward and a clear stop-loss.
Keeping this on watch and accumulating inside the pattern, a breakout could push the price toward $0.009 or higher.
DYOR, NFA

$NXPC Rebounding from Golden Zone!!$NXPC
Based on the Fib retracement, the price is currently sitting in the golden zone between 0.5–0.618 levels a common area for strong bounces.
Also, the price is reacting well near the demand zone, and a small falling wedge has just broken out.
This setup offers a clean risk-reward with tight invalidation.
I’m keeping a close eye on it could be a solid opportunity if momentum builds.

$FET has formed an ascending triangle pattern!NYSE:FET has formed an ascending triangle pattern!
After getting rejected from the $0.93–$0.95 resistance zone, price pulled back but it's holding above this lower trend-line support and this 100EMA.
If this support holds, we could see a move back toward the resistance zone, and maybe even a breakout above it.
DYOR, NFA

$GRASS just broke out of a long-term downtrend!$GRASS just broke out of a long-term downtrend!
#GRASS has broken out of a long-term symmetrical triangle and flipped the trend bullish.
Price is currently holding above the breakout zone and also respecting the 0.786 fib level from the recent range.
As long as it stays above the $2.13–$2.14 zone, the move toward $2.60+ looks likely.
This breakout could be the start of a bigger trend shift. Let’s see how it holds up in the coming days.
DYOR, NFA

$CHILLGUY is holding strong!$CHILLGUY is holding strong!
Price is respecting the ascending trendline and gearing up for a breakout.
A move above that top resistance could open the gates to $0.13
Entry zone: $0.086–$0.088
Stop-loss: $0.080
Looks like a clean setup with a good risk-reward.
Just manage your risk properly and don’t chase.
DYOR, NFA
#chillguy #cryptocurrency

$PENGU is prepared for a bounce! CSECY:PENGU is prepared for a bounce!
Price is still moving inside the rising channel and just touched the lower support line.
As long as it stays above the $0.0128–$0.0132 zone, we could see a bounce toward the top of the channel near $0.018.
This setup offers a good risk-reward.
Entry: $0.0130
Stop-loss: $0.0119
DYOR, NFA
#cryptocurrencies

$MAGIC Loading Up for a Breakout After 32 Days of Silence!OMXTSE:MAGIC has been forming this symmetrical triangle pattern for over 32 days, that's more than a month of consolidation!
Price is squeezing tighter inside the range, and a breakout is getting closer.
If it breaks above the upper trendline with volume, we could see a move toward $0.22–$0.28 🚀
This setup is worth watching closely, long consolidation often leads to strong moves.
Retweet if you're bullish !!
#MAGIC #Alts

#ChillGuy Breakout Confirmed – Long Setup Active!#ChillGuy has broken out of a symmetrical triangle and is currently holding above horizontal support in the short term, which looks strong !
We can consider a long position at the current market price (CMP) with a stop-loss at $0.0857.
If the market plays out as expected, we could see a solid move from here.
DYOR, NFA

$BRETT Bull Flag breakout Done!!$BRETT Bull Flag breakout Done ✅
Looks ready to take off anytime.
I bought it at CMP with SL $0.07083
DYOR, NFA
BYBIT:BRETTUSDT PYTH:BRETTUSD

$STO is getting ready for a breakout!ASX:STO is getting ready for a breakout!
After a long downtrend, the chart has formed a clean falling wedge a classic bullish reversal pattern.
We’re now seeing a breakout attempt, and if momentum holds, we could see a sharp 40%+ move to the upside. 🚀
Keep an eye on this, it could move fast
BLUEBERRY:STOUSD BINANCE:STOUSDT
