ETH/USD – Bullish Breakout & Buying OpportunityEthereum has broken out of a descending channel and is consolidating near a key support zone. The price action suggests a potential bullish continuation, with a buying opportunity forming above the $2,000 - $2,100 support level.
Key Levels to Watch:
Support: ~$2,000, ~$1,800
Resistance Zone: ~$2,250
Target: ~$2,530
Trading Plan:
Buy Entry: On breakout and retest above $2,250
Stop-Loss: Below $2,000
Take-Profit: $2,530
If Ethereum successfully breaks resistance with volume confirmation, it could rally toward $2,500+, making this a strong bullish setup. Keep an eye on price action for confirmation. 🚀
Buyopportunity

Nxpi in the next few daysNxpi will be bullish in the next few days
we will see very strong movement in the next few days for this stock

#HEROMOTOCORP DEMAND ZONE A demand zone at 3395 indicates a potential area of buying pressure, where price may reverse or bounce upward. Traders can consider going long on price rejection at this zone, with a stop loss below 3395.

Bitcoin Correction & Accumulation Phase!#Bitcoin is in a correction and accumulation phase, something we’ve seen multiple times in this cycle.
As long as we don’t see any bearish confirmation on the higher time frame, this remains a normal correction within the bull run
We’re near the range's lower bound, which could be a good spot for short-term long setups on lower timeframes.
The next bullish breakout requires a weekly close above $110,000 🚀
History repeats itself—stay patient, accumulate smartly
What’s your strategy during these corrections? Let’s discuss it! 👇
DYOR, NFA

GOLD ROAD MAP 3000 TO WATERFALL ALERT!🔥 Attention Traders! 🔥
XAUUSD is on fire! 🔥 Here's the latest update:
🔻 Bearish Outlook: Watch out for a potential drop if price falls below 2979. Targets: 2940 & 2960.
🔺 Bullish Outlook: A breakout above 2989 could lead to buying opportunities! Watch for targets: 3000 & 3020.
📈 Stay Tuned: Share your thoughts and strategies as we navigate this golden market! Let's hit new highs! 💰🚀

NZDCAD BUY The MACD is below its signal line and positiveNZDCAD The price could retrace, the RSI is above its neutrality area at 50. The MACD is below its signal line and positive. Moreover the price jumped from the 8EMA.

XRP Weekly-Monthly Analysis / Retracement Levels for BuyWeekly - Monthly trend: Bearish
Chart Pattern: Head & Shoulders (H&S) - Bearish Continuation Pattern
Bearish Candlesticks signals:
HANGING MAN (Bearish, Single Candlestick pattern) / Weekly Timeframe / 09 DEC 2024
BEARISH ENGULFING (Bearish, Double Candlestick pattern)/ weekly Timeframe / 27 JAN 2025
TWEEZER TOP (Bearish, Double Candlestick pattern) / 1 Day timeframe / 20 FEB 2025
FALLING THREE METHODS (Bearish, five-fold Candlestick pattern) / 1 Day timeframe / 07 MAR 2025
Retracement Fib Price Levels:
0.00% (3.4000)
23.60% (2.6879)
38.20% (2.2474)
50.00% (1.8914)
61.80% (1.5353)
78.60% (1.0284)
100.00% (0.3827)
Good prices for buy (the lower the better):
61.80% (1.5353) – Golden Zone / Golden Pocket
78.60% (1.0284) – Entry Zone
Between 78.60% (1.0284) and 100.00% (0.3827) is the Risk Zone, which we have the Neckline of the ‘’ Quadruple Bottom Pattern ‘’ at the price range ‘’ 0.6291 – 0.7850 ‘’
I am having buy limit at 0.78500 on the neckline of ‘’ Quadruple Bottom Pattern ‘’.

The Ultimate Golden Zone to Close Shorts and flip Long TESLA Must Watch Analysis on TSLA revealing the ultimate golden zone to fill your Longs and close your shorts.
In this video I pinpoint a high probability zone of where to take the next long .
I have used a suite of Fibonacci tools to include TR Pocket , Trend based fib, pitch fan , 0.618, VWAP and volume profile to determine the best Long.

EUR/USD BUYThis trade is cloaed, just another trade diary for me.
This analysis is based on the provided image and should not be considered financial advice. Trading involves risks, and it is essential to conduct your own research and consult with a financial advisor before making any trading decisions.

Google Update - Trade this range and new ATH Identified Update video on the google Long that has been planned since early FEB. The level has now been hit and we got a nice reaction off that level . In this video I look into where I think we go next and how price plays out .
In the video I use the following tools TR Pocket FIB , 0.618 FIB , Pivots , Parallel Channel and the Fixed range Vol Profile.
If we stay range bound inside the channel then we have the potential to see a new high on google at the top of the channel in confluence with 1-1 ext + tr pocket expansion .
Watch the video and mark the levels on your chart and ensure to set your alerts .
Dont forget to Boost the chart Please and i welcome any questions TY

XAU/USD LongAs I expected from my previous post, gold is more likely to drop as it fails to make a higher high on the higher timeframe. Based on my chart, there is significant liquidity that needs to be taken out, also known as the support line. I am waiting for the Candle Range Theory to occur before entering a long position, and confirmation is needed to reduce risk.
Alright, that’s it thanks!

Is the ZIP DIP OVER? Is it a suitable time to Buy?Is the Base solid enough to drive the price to 3 OR will it require a manipulation below the base to test key support "2"?
THIS IS ONLY AN IDEA AND COULD BE RIGHT...
For the Fundamental lovers:
Also keep in mind:
Dow Jones Newswires:
"Zip Price Target Raised 5.9% to A$3.60/Share by Ord Minnett"

Bullish Outlook going forward for NQNQ has pulled back and taken Feb. Monthly low as well as grabbing some additional liquidity from Nov. last year. I shorted NQ on Thursday for 473 points to my anticipated level of support. I nearly caught the bottom of the market, followed by an aggressive back move up to equilibrium to end the week. Going forward, with the high impact news coming up in the first 2 weeks of March, I see a bullish outlook and the potential for new ATH. Here is an idea of what I see playing out over the short-term.

BTC Ready To Going $200K!I am Sharing Currentn Analysis Of BTC where You Can Take Idia From This Analysis And Help In To Your Trading Journey Market Coming In Their Nearest Buying Zone This is very Important Zone For BTC Here Is BTC Will Try To Fly To Upside And Test To Resistance Side.
Remember! Without Risk Management Trading is Gambling 📊.

AUD/USD – High Probability Long Setup1️⃣ Trade Execution – Why I Took the Long Position
Today's AUD/USD trade was a perfect setup combining Fibonacci retracements, institutional order flow, and seasonality trends from Prime Market Terminal. The confluences aligned well for a high-probability long entry.
💡 Entry Details:
✅ Entry: 0.6380 (Key demand zone + Fibonacci golden zone)
✅ Stop Loss: 0.6365 (Below market structure)
✅ Take Profit: 0.6429 - 0.6450 (Previous supply zone & liquidity target)
✅ Risk-Reward Ratio: 3:1
🎯 Result: Currently in profit, monitoring for further upside! ✅
2️⃣ Why This Trade Worked – A Breakdown of the Confluences
📊 Fibonacci Retracement – Textbook Pullback & Bounce
Price retraced into the 61.8%-78.6% Fibonacci zone (0.6380 - 0.6365) and bounced perfectly.
The bullish move followed an impulse leg, suggesting smart money accumulation in this zone.
📈 Smart Money & Order Flow – Trading with Institutions
🔹 Order flow from Prime Market Terminal shows major liquidity pools accumulating long positions.
🔹 DMX Data: 43% long vs. 57% short, indicating potential for a reversal as shorts get trapped.
🔹 COT Data: Institutional traders increasing their net long exposure on AUD.
🕵️♂️ Seasonality & Historical Trends Supported the Long
📊 Seasonal Prime data indicates AUD/USD historically trends higher in late February & March.
📅 Next 3-5 day forecast shows bullish probability, reinforcing the long bias.
📉 Technical Confirmation – Structure & Momentum
✅ SuperTrend flipped bullish on the 4H chart
✅ Price is trading above key moving averages (EMA 6, 24, 72, 288)
✅ Broke above short-term resistance, confirming upward momentum
3️⃣ Key Takeaways from This Trade
🔹 Trading with smart money flow and against retail sentiment increases trade probability.
🔹 Seasonality trends aligned perfectly, adding confidence in the setup.
🔹 Fibonacci, EMAs, and Prime Market Terminal data provided a precise entry.
🔹 Patience and risk management ensured a well-executed trade.
📌 Final Thoughts – What’s Next for AUD/USD?
🚀 With this bullish breakout, I’m looking for further longs on dips, targeting the 0.6450 - 0.6480 zone.
👀 What’s your outlook on AUD/USD? Are you long or short? Let’s discuss in the comments!
🔗 Follow me for more institutional trade setups & contrarian trading ideas!

BTCUSDT TRUE ICT ANALYSISBtc in bearish trend and break ITL and make ITL or ITH but currently market at demand zone we looking for buy side becouse nearly sell leqiudity was hunted so we take a flight easy to buy side who is with us in this flight.

Bitcoin Holds Strong: $100K Breakout or Pullback Ahead?#Bitcoin Update
Bitcoin remains in a tight consolidation phase after rebounding from key support.
Support at $93,700 Holding: BTC has successfully defended the ascending trendline and 200 EMA, showing strong buyer interest around this level.
Range-bound movement: The price continues to hover between the ATH resistance and the lower support, forming a key accumulation zone.
Breakout Watch: A daily close above the $100,000 resistance could lead to a breakout, while a failure to hold support may trigger a correction.
Traders should keep an eye on BTC’s next move, as volatility could increase soon.
DYOR, NFA
#BTC #Crypto

#AGLD Ready for a Major Breakout? Accumulation Phase Ending!🔹 Trend Overview: After a prolonged downtrend, #AGLD has entered a strong accumulation phase, signaling a potential trend reversal.
🔹 Key Levels to Watch:
Resistance: 1.4
Support: 0.865
🔹 Trading Plan:
We are watching for a breakout above resistance to confirm an uptrend. If volume supports the move, it could trigger a strong rally.
🔹 Confluence Factors:
Fibonacci Levels Aligned
Volume Increasing
RSI Showing Bullish Divergence
🔹 Trade Setup:
Long above 1.4
Stop Loss: 0.865
Targets: 2.18 & 3
🔹 What do you think? Will #AGLD break out or fake out? Drop your thoughts below!
🔹 Follow for more real-time setups & market insights!

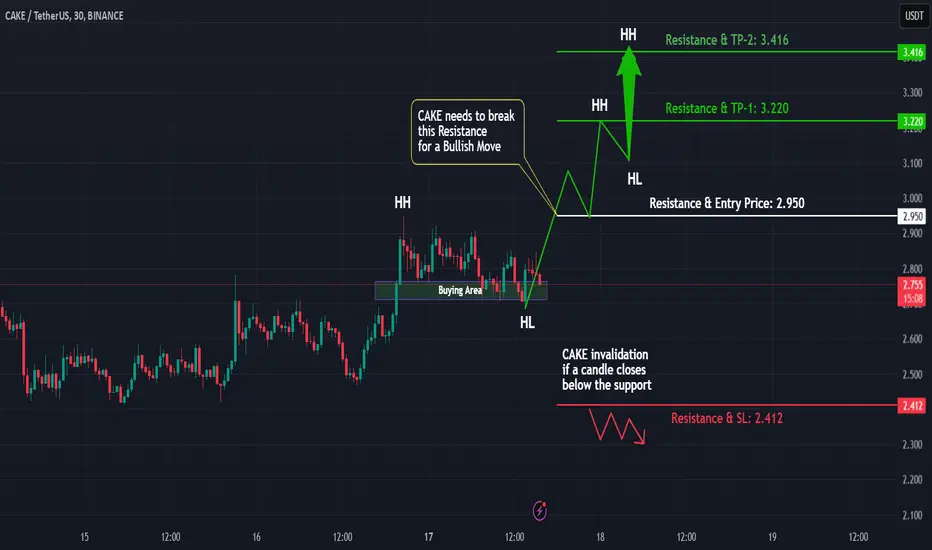
#Cake Ready for a Big Move? Bullish Breakout Incoming!🔹 Market Structure & Trend
#Cake is currently in a strong uptrend, forming higher highs (HHs) and higher lows (HLs). This is a classic sign of bullish momentum.
🔹 Key Breakout Zone
We are watching the resistance level: 2.950, which aligns with previous HHs. A breakout above this level could trigger another strong rally.
🔹 Trade Plan & Entry Strategy
Breakout Entry: Above 2.950 with confirmation
Stop Loss: Below recent HL for proper risk management
Targets: First TP at 3.220, extended TP at 3.416
🔹 Indicators & Confirmation
RSI: Above 50, indicating bullish strength
Volume: Increasing, signaling strong participation
Moving Averages: Aligning for an uptrend
What’s Your Take?
Do you think #Cake will break out or face resistance? Drop your analysis in the comments!
Nifty50 in negative zone : Be cautiousHello Friends,
After analyzing the long-term chart of the Nifty50 Index, I believe it has entered a negative zone. Therefore, I advise caution before taking long positions. It is wise to avoid speculation and naked derivative positions. If you decide to trade, please do so with strict stop-loss orders; otherwise, it may be best to refrain from initiating fresh positions.
I believe the Nifty50 has strong support at 22000 levels. However, any entry at those levels should depend on market movement and sentiment at that time.
It is important to note that this is not the time to book losses or exit in a panic, nor to re-enter at 22000 levels. I recommend holding existing positions and staying patient.
These are merely my observations regarding the market, and readers may have differing opinions.


DEVIATON INJIt looks like we have a deviation below the demand zone and the $13.8 support, which could present a buying opportunity.
I’m waiting to see if the price finds support around $14.4.
If the price drops below $14 and stays there for an extended period, I’ll reassess the trade, as we could see another leg down toward the $8-$11 zone, where stronger support is likely.
For now, the weekly oscillators look decent—Stoch RSI is close to a bullish cross, and RSI has found support at 40.

Bitcoin 30 minutes possible buy Bitcoin has been in a range for a while and it's looking like there is a possible buy currently
